导言

如上所示:
- 在左下角增加checkbos选择哪根曲线需要显示。
工程代码:
- github:https://github.com/q164129345/myPyside6_QML/tree/main/charts07_checkbox_choice_line
- gitee:https://gitee.com/wallace89/myPyside6_QML/tree/main/charts07_checkbox_choice_line
一、代码
1.1、Main.qml
js
/**
 * Charts07 - 复选框选择显示线条
 *
 * 学习要点:
 * 1. 多条 LineSeries 显示
 * 2. CheckBox 控制线条可见性
 * 3. 不同数据系列的管理
 */

import QtQuick
import QtQuick.Controls
import QtQuick.Layouts
import QtCharts

ApplicationWindow {
    visible: true
    width: 700
    height: 500
    title: "Charts07 - 复选框选择显示线条"

    // ========== 属性 ==========
    property int currentX : 0
    property int currentY1 : 0
    property int currentY2 : 0
    property int maxPoints: 50
    property bool isRunning: false

    Timer {
        id: dataTimer
        interval: 100
        running: isRunning
        repeat: true
        onTriggered: {
            // 生成第一条线的数据 (正弦波)
            currentY1 = 50 + 40 * Math.sin(currentX * 0.1) + (Math.random() - 0.5) * 10
            dataSeries1.append(currentX, currentY1)

            // 生成第二条线的数据 (余弦波)
            currentY2 = 50 + 40 * Math.cos(currentX * 0.1) + (Math.random() - 0.5) * 10
            dataSeries2.append(currentX, currentY2)

            currentX++

            // 限制数据点数量
            if (dataSeries1.count > maxPoints) {
                dataSeries1.remove(0)
            }
            if (dataSeries2.count > maxPoints) {
                dataSeries2.remove(0)
            }

            // 动态调整 X 轴范围
            if (currentX > maxPoints) {
                axisX.min = currentX - maxPoints
                axisX.max = currentX
            }
        }
    }

    ColumnLayout {
        anchors.fill: parent
        anchors.margins: 10
        spacing: 10

        ChartView {
            id: chartView
            Layout.fillWidth: true
            Layout.fillHeight: true
            antialiasing: true

            ValueAxis {
                id: axisX
                min: 0
                max: maxPoints
                tickCount: 6
                titleText: "时间"
            }

            ValueAxis {
                id: axisY
                min: 0
                max: 100
                tickCount: 6
                titleText: "数值"
            }

            LineSeries {
                id: dataSeries1
                name: "正弦波"
                color: "#4CAF50"
                width: 2
                axisX: axisX
                axisY: axisY
                visible: checkbox1.checked

                // ========== 鼠标悬停事件 ==========
                onHovered: function(point, state) {
                    if (state) {
                        tooltip.x = chartView.mapToPosition(point, dataSeries1).x + 10
                        tooltip.y = chartView.mapToPosition(point, dataSeries1).y - 40
                        tooltipText.text = "正弦波\nX: " + point.x.toFixed(1) + "\nY: " + point.y.toFixed(1)
                        tooltip.visible = true
                    } else {
                        tooltip.visible = false
                    }
                }
            }

            LineSeries {
                id: dataSeries2
                name: "余弦波"
                color: "#2196F3"
                width: 2
                axisX: axisX
                axisY: axisY
                visible: checkbox2.checked

                // ========== 鼠标悬停事件 ==========
                onHovered: function(point, state) {
                    if (state) {
                        tooltip.x = chartView.mapToPosition(point, dataSeries2).x + 10
                        tooltip.y = chartView.mapToPosition(point, dataSeries2).y - 40
                        tooltipText.text = "余弦波\nX: " + point.x.toFixed(1) + "\nY: " + point.y.toFixed(1)
                        tooltip.visible = true
                    } else {
                        tooltip.visible = false
                    }
                }
            }

            // ========== 自定义 Tooltip ==========
            Rectangle {
                id: tooltip
                visible: false
                width: 80
                height: 40
                color: "#333333"
                radius: 5
                border.color: "#4CAF50"
                border.width: 1
                z: 100

                Text {
                    id: tooltipText
                    anchors.centerIn: parent
                    color: "#ffffff"
                    font.pixelSize: 12
                }
            }
        }

        // ========== 控制按钮区域 ==========
        RowLayout {
            Layout.fillWidth: true
            spacing: 15

            // ========== 复选框区域 ==========
            CheckBox {
                id: checkbox1
                text: "正弦波"
                checked: true
                palette.text: "#4CAF50"
            }

            CheckBox {
                id: checkbox2
                text: "余弦波"
                checked: true
                palette.text: "#2196F3"
            }

            Rectangle {
                width: 1
                height: 30
                color: "#cccccc"
            }

            Button {
                text: isRunning ? "暂停" : "开始"
                onClicked: isRunning = !isRunning
            }

            Button {
                text: "清除"
                onClicked: {
                    isRunning = false
                    dataSeries1.clear()
                    dataSeries2.clear()
                    currentX = 0
                    axisX.min = 0
                    axisX.max = maxPoints
                }
            }

            Label {
                text: "数据点: " + Math.max(dataSeries1.count, dataSeries2.count)
            }

            Item { Layout.fillWidth: true }

            Label {
                text: "更新频率:"
            }

            Slider {
                id: speedSlider
                from: 50
                to: 500
                value: 100
                stepSize: 50
                Layout.preferredWidth: 150
                onValueChanged: dataTimer.interval = value
            }

            Label {
                text: speedSlider.value + "ms"
            }
        }
    }
}
mermaid
ApplicationWindow (主窗口) ColumnLayout (垂直布局) ChartView (图表容器) RowLayout (控制区域) 复选框组 按钮组 dataSeries1.append(x, sin) dataSeries2.append(x, cos) 调整 X 轴范围 axisX axisY axisX axisY 控制 visible 控制 visible 切换 isRunning clear() clear() 重置范围 设置 interval 读取 count 读取 count 读取 value onHovered onHovered ⏱️ Timer
id: dataTimer
interval: 100ms
生成正弦波/余弦波数据 Rectangle
分隔线 Label
数据点计数 Label
更新频率 Slider
id: speedSlider
50-500ms Label
频率显示 Button
开始/暂停 Button
清除数据 ☑️ CheckBox
id: checkbox1
正弦波 ☑️ CheckBox
id: checkbox2
余弦波 ValueAxis (X轴)
id: axisX
时间轴 ValueAxis (Y轴)
id: axisY
数值轴 LineSeries
id: dataSeries1
🟢 正弦波
color: #4CAF50 LineSeries
id: dataSeries2
🔵 余弦波
color: #2196F3 Rectangle (Tooltip)
显示坐标信息
二、关键点梳理
2.1、checkbox控制曲线的可见性
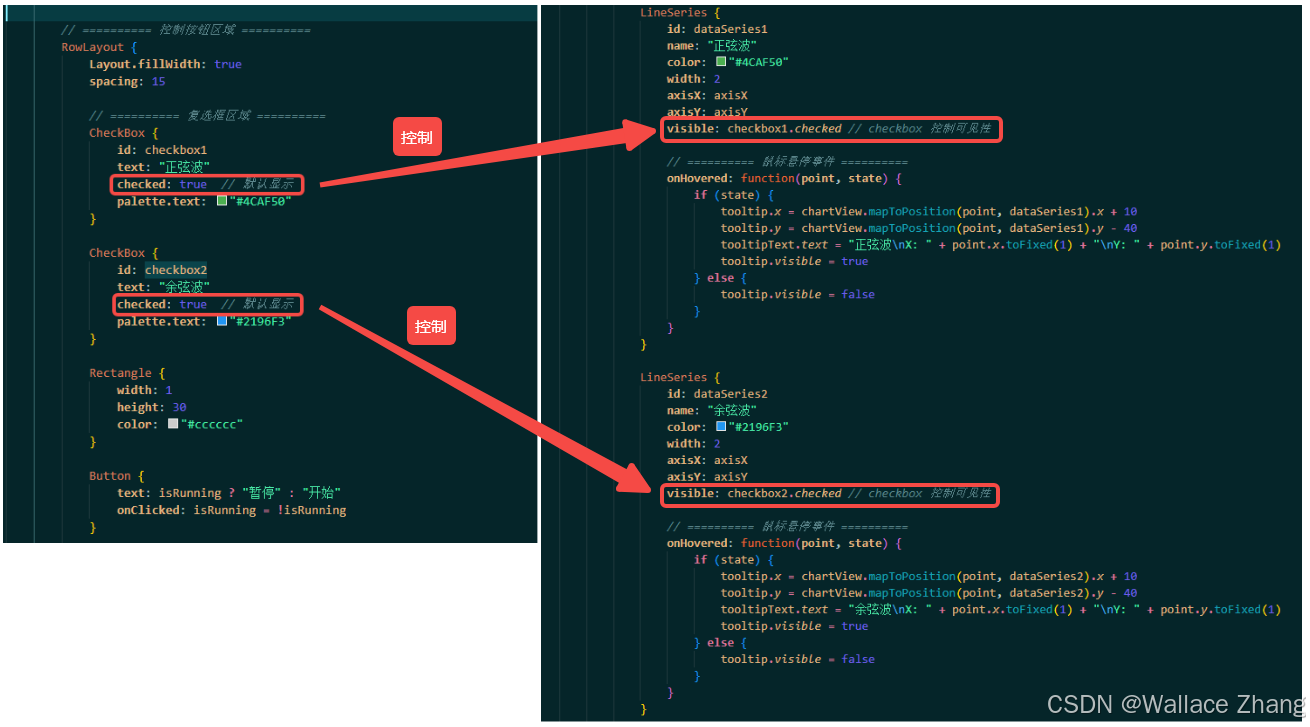
如上所示,使用CheckBox的checked属性控制LineSeries的visible属性,实现CheckBox控件控制曲线是否可见的功能。