classdef TemperatureMonitor < handle
% 温度监测类 - 实时读取、显示和保存串口温度数据
properties
serialPort
fig
ax
temperaturePlot
dataBuffer
timeBuffer
maxPoints = 1000 % 显示的最大数据点数
isRunning = false
startTime
dataTable
end
properties (Access = private)
logFileName % 修改属性名为logFileName,避免冲突
fileID
end
methods
function obj = TemperatureMonitor(port, baudRate)
% 构造函数
% port: 串口号,如 'COM3'
% baudRate: 波特率,如 9600
% 初始化数据缓冲
obj.dataBuffer = [];
obj.timeBuffer = [];
obj.dataTable = table();
% 创建串口对象
try
obj.serialPort = serialport(port, baudRate);
obj.serialPort.Timeout = 10;
configureTerminator(obj.serialPort, "CR/LF");
disp(['串口 ', port, ' 已连接,波特率: ', num2str(baudRate)]);
catch ME
error('无法打开串口: %s', ME.message); % 使用格式设定符
end
% 创建GUI界面
obj.createGUI();
% 设置回调函数
configureCallback(obj.serialPort, "terminator", ...
@(src, event)obj.readDataCallback(src, event));
end
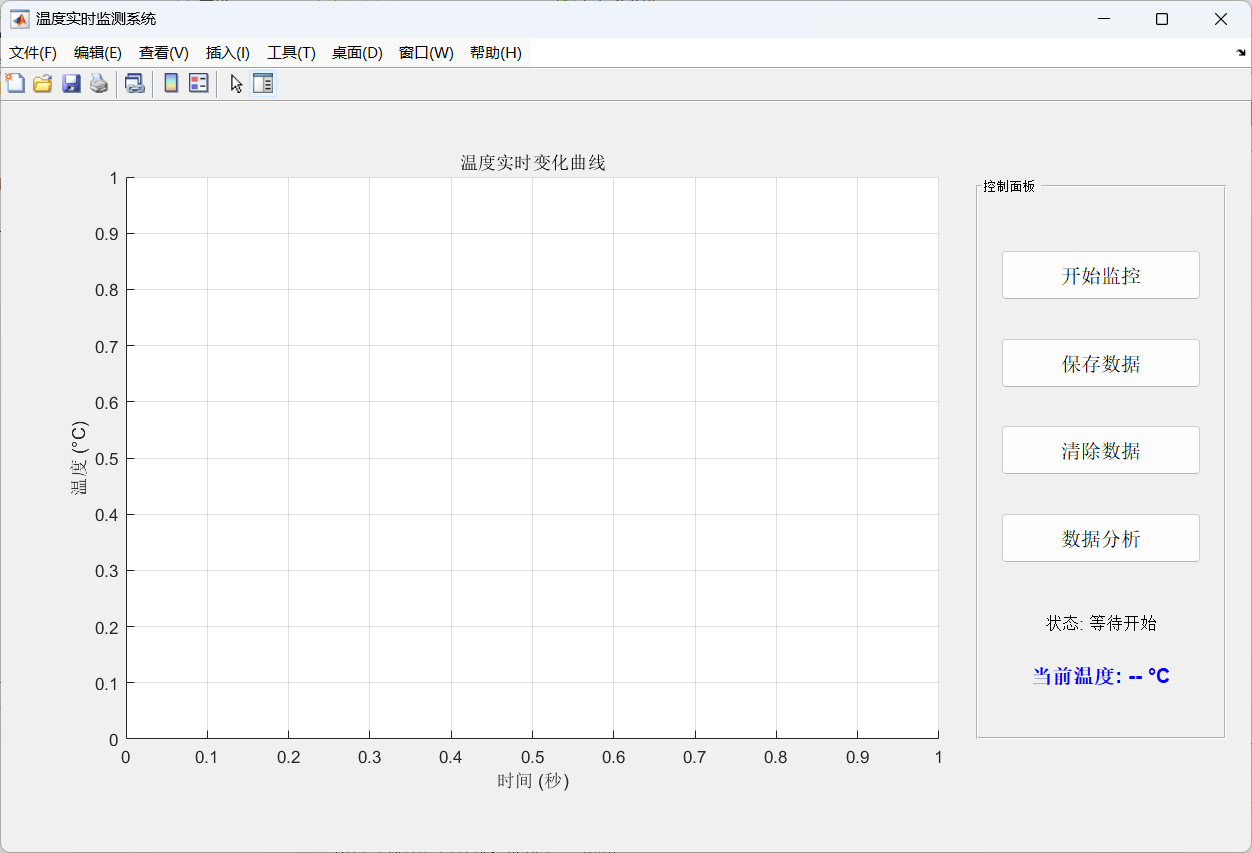
function createGUI(obj)
% 创建图形界面
obj.fig = figure('Name', '温度实时监测系统', ...
'NumberTitle', 'off', ...
'Position', [100, 100, 1000, 600], ...
'CloseRequestFcn', @obj.closeFigure);
% 创建绘图区域
obj.ax = axes('Parent', obj.fig, ...
'Position', [0.1, 0.15, 0.65, 0.75]);
xlabel(obj.ax, '时间 (秒)');
ylabel(obj.ax, '温度 (°C)');
title(obj.ax, '温度实时变化曲线');
grid(obj.ax, 'on');
hold(obj.ax, 'on');
% 初始化绘图
obj.temperaturePlot = plot(obj.ax, NaN, NaN, ...
'b-', 'LineWidth', 1.5, ...
'Marker', 'o', 'MarkerSize', 4, ...
'MarkerFaceColor', 'r');
% 创建控制面板
controlPanel = uipanel('Parent', obj.fig, ...
'Title', '控制面板', ...
'Position', [0.78, 0.15, 0.2, 0.75]);
% 开始/停止按钮
uicontrol('Parent', controlPanel, ...
'Style', 'pushbutton', ...
'String', '开始监控', ...
'Position', [20, 350, 160, 40], ...
'FontSize', 12, ...
'Callback', @obj.toggleMonitoring);
% 保存数据按钮
uicontrol('Parent', controlPanel, ...
'Style', 'pushbutton', ...
'String', '保存数据', ...
'Position', [20, 280, 160, 40], ...
'FontSize', 12, ...
'Callback', @obj.saveData);
% 清除数据按钮
uicontrol('Parent', controlPanel, ...
'Style', 'pushbutton', ...
'String', '清除数据', ...
'Position', [20, 210, 160, 40], ...
'FontSize', 12, ...
'Callback', @obj.clearData);
% 分析按钮
uicontrol('Parent', controlPanel, ...
'Style', 'pushbutton', ...
'String', '数据分析', ...
'Position', [20, 140, 160, 40], ...
'FontSize', 12, ...
'Callback', @obj.analyzeData);
% 状态显示
uicontrol('Parent', controlPanel, ...
'Style', 'text', ...
'String', '状态: 等待开始', ...
'Position', [20, 70, 160, 30], ...
'FontSize', 10, ...
'Tag', 'statusText');
% 数据显示
uicontrol('Parent', controlPanel, ...
'Style', 'text', ...
'String', '当前温度: -- °C', ...
'Position', [20, 30, 160, 30], ...
'FontSize', 12, ...
'FontWeight', 'bold', ...
'ForegroundColor', 'blue', ...
'Tag', 'tempText');
end
function toggleMonitoring(obj, ~, ~)
% 开始/停止监控
if ~obj.isRunning
% 开始监控
obj.isRunning = true;
obj.startTime = datetime('now');
obj.dataBuffer = [];
obj.timeBuffer = [];
% 更新按钮文本
btn = findobj(obj.fig, 'String', '开始监控');
btn.String = '停止监控';
% 更新状态
statusText = findobj(obj.fig, 'Tag', 'statusText');
statusText.String = '状态: 监控中...';
disp('开始监控温度数据');
else
% 停止监控
obj.isRunning = false;
% 更新按钮文本
btn = findobj(obj.fig, 'String', '停止监控');
btn.String = '开始监控';
% 更新状态
statusText = findobj(obj.fig, 'Tag', 'statusText');
statusText.String = '状态: 已停止';
disp('停止监控温度数据');
end
end
function readDataCallback(obj, src, ~)
% 串口数据读取回调函数
if ~obj.isRunning
return;
end
try
% 读取数据
data = readline(src);
% 尝试解析温度值(假设数据格式为数字)
temperature = str2double(data);
if ~isnan(temperature)
% 计算相对时间
currentTime = seconds(datetime('now') - obj.startTime);
% 更新数据缓冲区
obj.dataBuffer(end+1) = temperature;
obj.timeBuffer(end+1) = currentTime;
% 限制缓冲区大小
if length(obj.dataBuffer) > obj.maxPoints
obj.dataBuffer = obj.dataBuffer(end-obj.maxPoints+1:end);
obj.timeBuffer = obj.timeBuffer(end-obj.maxPoints+1:end);
end
% 更新绘图
set(obj.temperaturePlot, ...
'XData', obj.timeBuffer, ...
'YData', obj.dataBuffer);
% 自动调整坐标轴
xlim(obj.ax, [min(obj.timeBuffer), max(obj.timeBuffer)]);
ylim(obj.ax, [min(obj.dataBuffer)*0.9, max(obj.dataBuffer)*1.1]);
% 更新数据显示
tempText = findobj(obj.fig, 'Tag', 'tempText');
tempText.String = sprintf('当前温度: %.2f °C', temperature);
% 添加到数据表
newRow = table(datetime('now'), temperature, currentTime, ...
'VariableNames', {'Timestamp', 'Temperature', 'ElapsedTime'});
obj.dataTable = [obj.dataTable; newRow];
% 实时保存到文件(可选)- 更新为logFileName
if ~isempty(obj.fileID) && obj.fileID > 0
currentDateTime = datetime('now', 'Format', 'yyyy-MM-dd HH:mm:ss.SSS');
fprintf(obj.fileID, '%s,%.4f,%.2f\n', ...
char(currentDateTime), currentTime, temperature);
end
end
catch ME
% 修复:使用格式设定符而不是直接传递MException对象
warning(ME.identifier,'数据读取错误: %s', ME.message); % 这是正确的用法
end
end
function saveData(obj, ~, ~)
% 保存数据到文件
if isempty(obj.dataTable)
warndlg('没有数据可保存!', '警告');
return;
end
% 使用datetime生成文件名
currentDateTime = datetime('now', 'Format', 'yyyyMMdd_HHmmss');
defaultName = ['temperature_data_', char(currentDateTime), '.csv'];
% 选择保存位置 - 使用不同的变量名避免冲突
[selectedFileName, selectedPathName] = uiputfile( ...
{'*.csv', 'CSV文件 (*.csv)'; ...
'*.mat', 'MAT文件 (*.mat)'; ...
'*.xlsx', 'Excel文件 (*.xlsx)'}, ...
'保存数据', defaultName);
if selectedFileName ~= 0
fullPath = fullfile(selectedPathName, selectedFileName);
[~, ~, fileExtension] = fileparts(fullPath);
try
switch lower(fileExtension)
case '.csv'
writetable(obj.dataTable, fullPath);
case '.mat'
temperatureData = obj.dataTable;
save(fullPath, 'temperatureData');
case '.xlsx'
writetable(obj.dataTable, fullPath);
end
disp(['数据已保存到: ', fullPath]);
msgbox(['数据已成功保存到: ', fullPath], '保存成功');
catch ME
% 修复:使用格式设定符
errordlg(sprintf('保存失败: %s', ME.message), '错误');
end
end
end
function startSavingToFile(obj)
% 开始实时保存到文件
% 使用datetime生成文件名
currentDateTime = datetime('now', 'Format', 'yyyyMMdd_HHmmss');
obj.logFileName = ['temp_log_', char(currentDateTime), '.csv'];
try
obj.fileID = fopen(obj.logFileName, 'w');
if obj.fileID == -1
error('无法创建日志文件: %s', obj.logFileName);
end
fprintf(obj.fileID, 'Timestamp,ElapsedTime(s),Temperature(C)\n');
disp(['开始记录数据到文件: ', obj.logFileName]);
catch ME
% 修复:使用格式设定符
warning(ME.identifier,'无法开始保存到文件: %s', ME.message);
obj.fileID = [];
end
end
function stopSavingToFile(obj)
% 停止实时保存到文件
if ~isempty(obj.fileID) && obj.fileID > 0
try
fclose(obj.fileID);
disp('已停止记录数据到文件');
catch ME
% 修复:使用格式设定符
warning(ME.identifier,'关闭文件时出错: %s', ME.message);
end
obj.fileID = [];
end
end
function clearData(obj, ~, ~)
% 清除数据
obj.dataBuffer = [];
obj.timeBuffer = [];
obj.dataTable = table();
set(obj.temperaturePlot, 'XData', NaN, 'YData', NaN);
% 重置显示
tempText = findobj(obj.fig, 'Tag', 'tempText');
tempText.String = '当前温度: -- °C';
disp('数据已清除');
end
function analyzeData(obj, ~, ~)
% 数据分析功能
if isempty(obj.dataTable)
warndlg('没有数据可分析!', '警告');
return;
end
try
% 创建分析窗口
analysisFig = figure('Name', '温度数据分析', ...
'NumberTitle', 'off', ...
'Position', [200, 200, 800, 600]);
% 计算统计信息
temps = obj.dataTable.Temperature;
times = obj.dataTable.ElapsedTime;
stats = struct();
stats.mean = mean(temps);
stats.std = std(temps);
stats.max = max(temps);
stats.min = min(temps);
stats.range = range(temps);
% 显示统计信息
statsPanel = uipanel('Parent', analysisFig, ...
'Title', '统计信息', ...
'Position', [0.05, 0.65, 0.4, 0.3]);
statsText = sprintf(['平均值: %.2f °C\n' ...
'标准差: %.2f °C\n' ...
'最大值: %.2f °C\n' ...
'最小值: %.2f °C\n' ...
'极差: %.2f °C\n' ...
'数据点数: %d'], ...
stats.mean, stats.std, stats.max, ...
stats.min, stats.range, length(temps));
uicontrol('Parent', statsPanel, ...
'Style', 'text', ...
'String', statsText, ...
'Position', [10, 10, 280, 120], ...
'FontSize', 11, ...
'HorizontalAlignment', 'left');
% 绘制直方图
subplot(2, 3, [1, 2], 'Parent', analysisFig);
histogram(temps, 20, 'FaceColor', 'blue', 'EdgeColor', 'black');
xlabel('温度 (°C)');
ylabel('频数');
title('温度分布直方图');
grid on;
% 绘制箱线图
subplot(2, 3, 3, 'Parent', analysisFig);
boxplot(temps);
ylabel('温度 (°C)');
title('温度箱线图');
grid on;
% 绘制时间序列图(带趋势线)
subplot(2, 3, [4, 6], 'Parent', analysisFig);
plot(times, temps, 'b-', 'LineWidth', 1);
hold on;
% 添加趋势线
if length(temps) > 1
p = polyfit(times, temps, 1);
trend = polyval(p, times);
plot(times, trend, 'r--', 'LineWidth', 2);
legend('原始数据', sprintf('趋势线 (斜率=%.4f)', p(1)));
end
xlabel('时间 (秒)');
ylabel('温度 (°C)');
title('温度时间序列(带趋势分析)');
grid on;
catch ME
% 修复:使用格式设定符
errordlg(sprintf('数据分析失败: %s', ME.message), '错误');
end
end
function closeFigure(obj, ~, ~)
% 关闭图形窗口时的清理工作
if obj.isRunning
obj.isRunning = false;
end
% 关闭串口
if ~isempty(obj.serialPort) && isvalid(obj.serialPort)
try
clear obj.serialPort;
catch ME
% 修复:使用格式设定符
warning(ME.identifier,'关闭串口时出错: %s', ME.message);
end
end
% 关闭文件(如果打开)
obj.stopSavingToFile();
% 删除图形
try
delete(obj.fig);
catch ME
% 修复:使用格式设定符
warning(ME.identifier,'删除图形窗口时出错: %s', ME.message);
end
end
function delete(obj)
% 析构函数
obj.closeFigure();
end
end
end