Basic statistics - 02. The Normal distribution
examples:
the heights of the populations
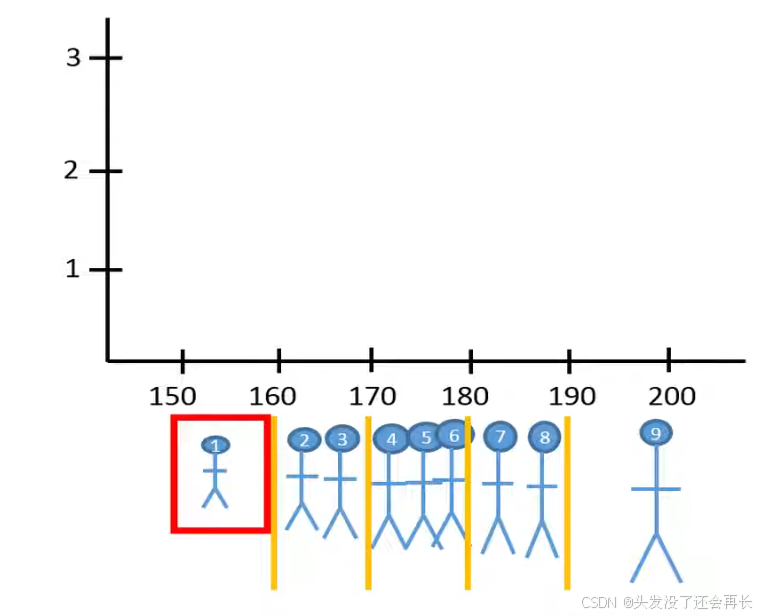
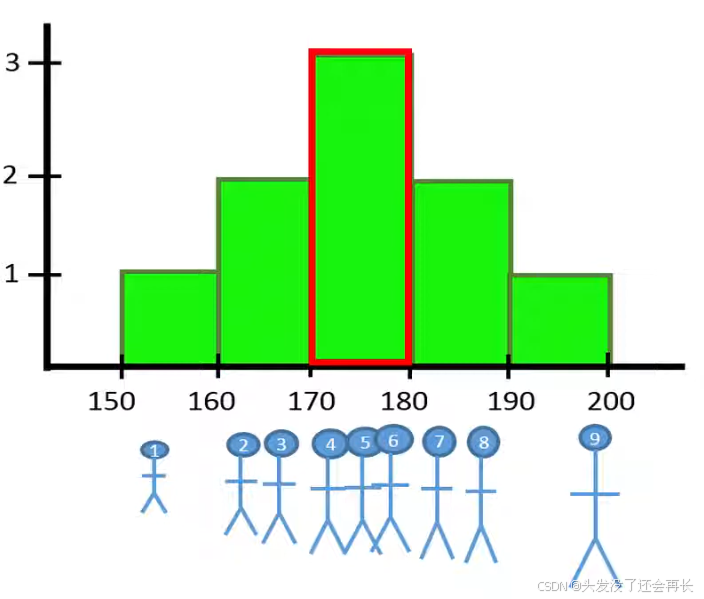
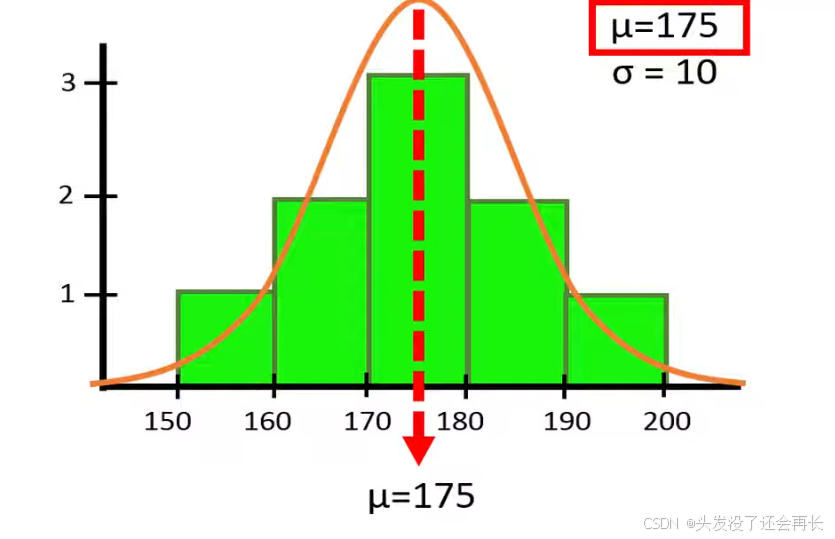
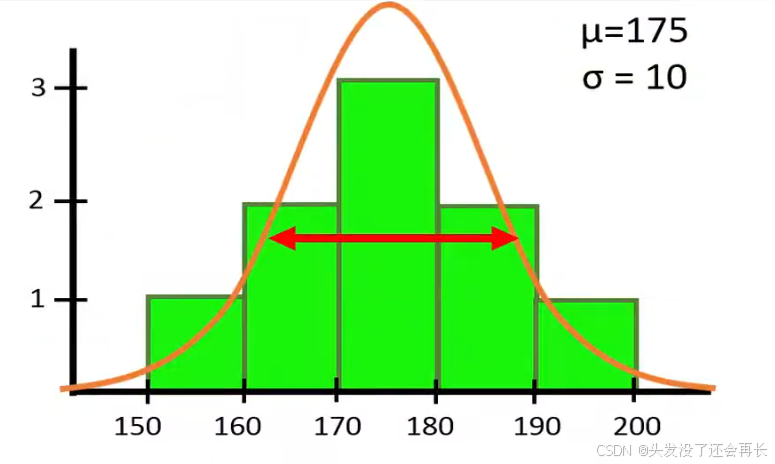
sigma represents the standard deviation
for the normal distribution curve, the area below the curve is always one.
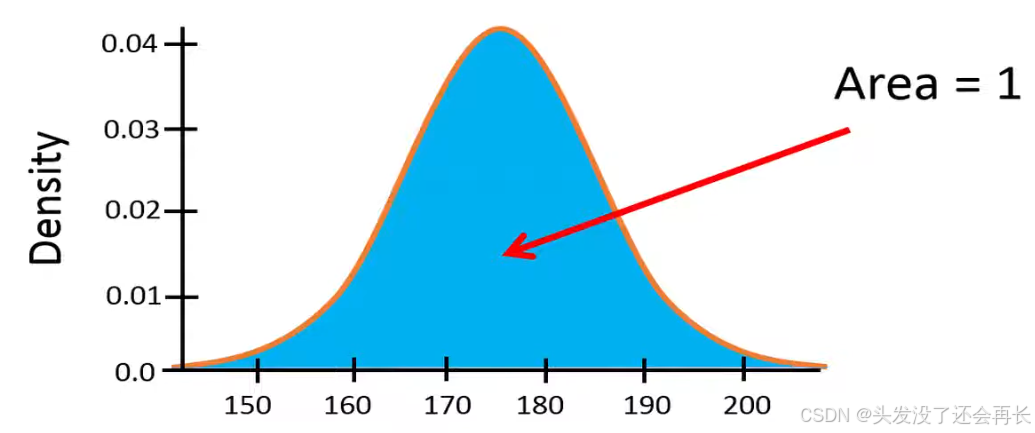
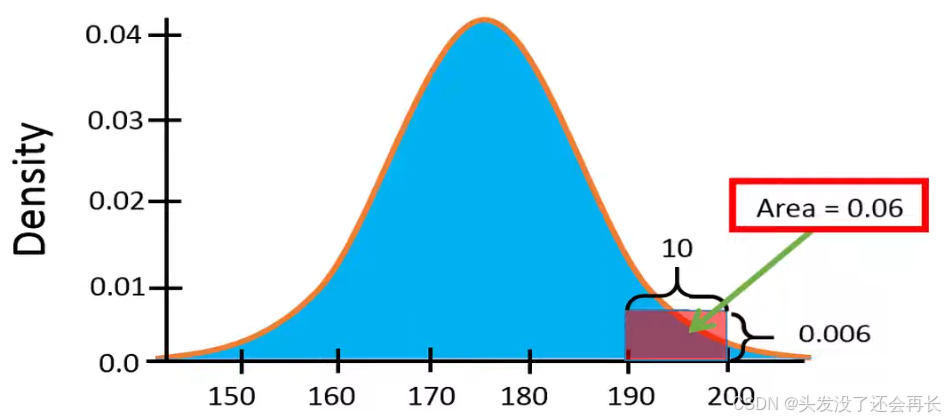
For example: we can use the area to get the rough estimation of individuals taht are between 190 and 200 centimeters in the population.
The width of the rectangle is 10 and the height is about 0.006, the area id equal 0.06, this means that about 6% of the population have a height in range of 190 to 200.
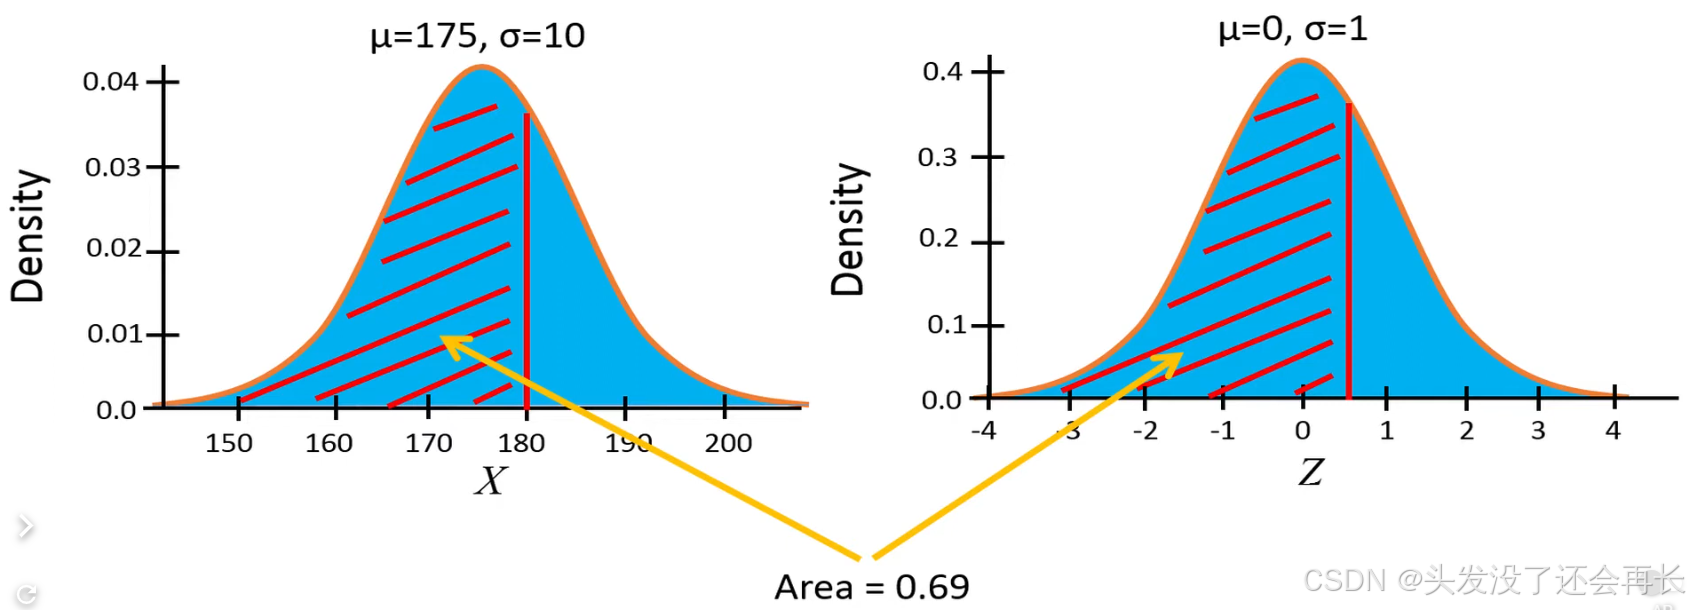
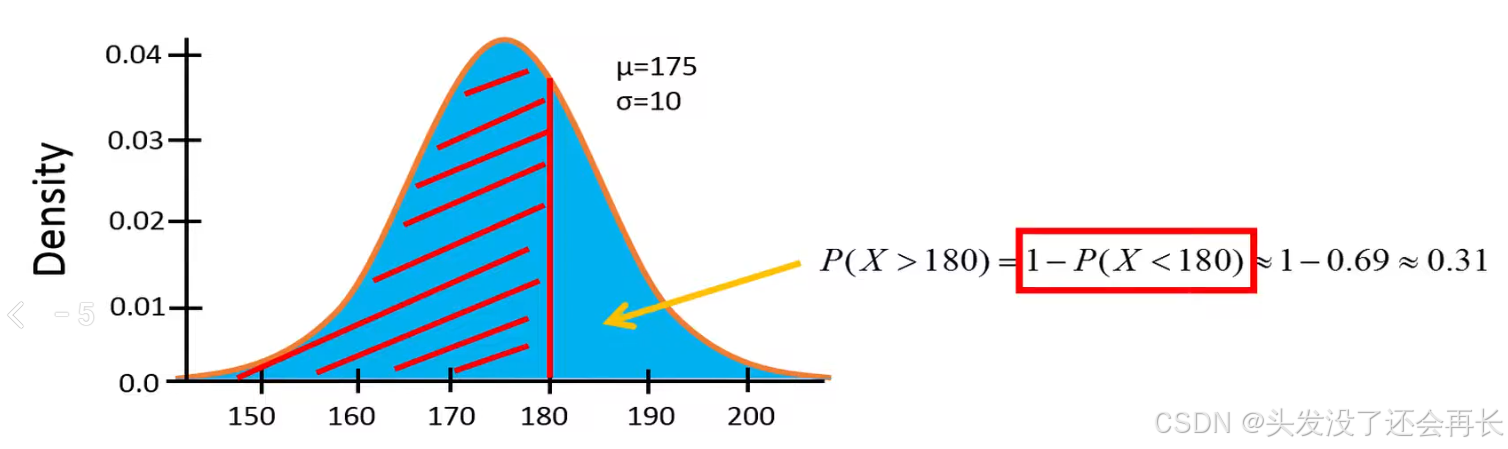
Because the area below curve is 1, so we can calculate X>=180 by 1-P(X<180).
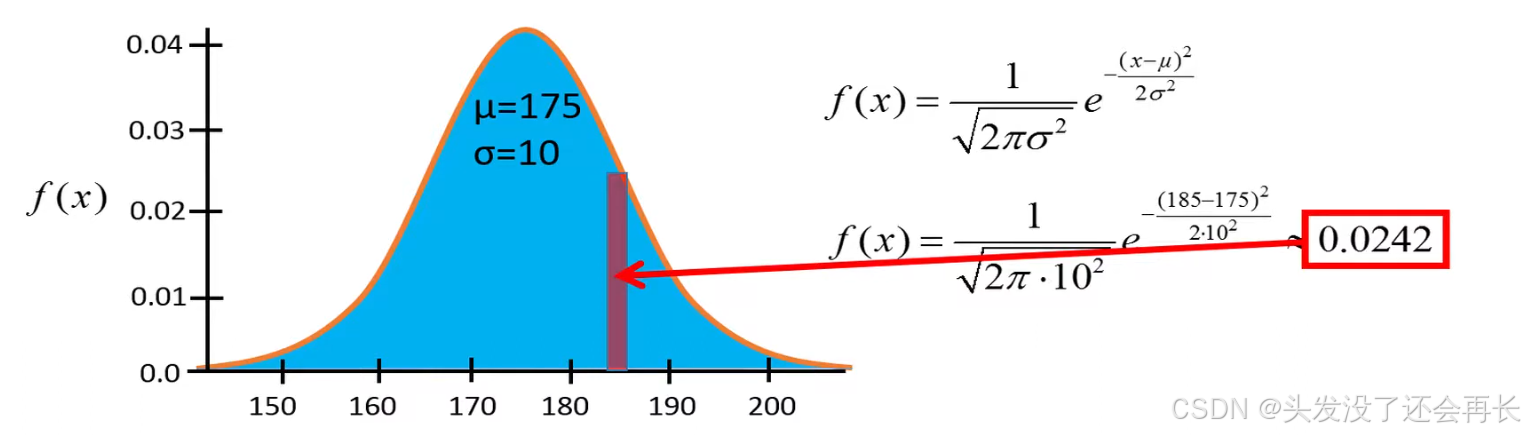
The following mathematical function can be used to depict the normal distribution for different values of x.
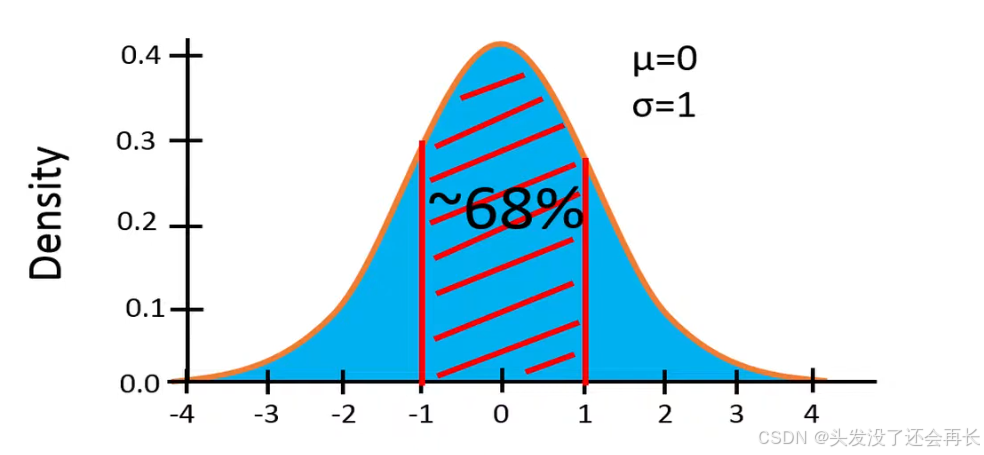
Standard normal distribution
mu is 0, sigma is 1, so the area in mean±sigma is 68%