简介:
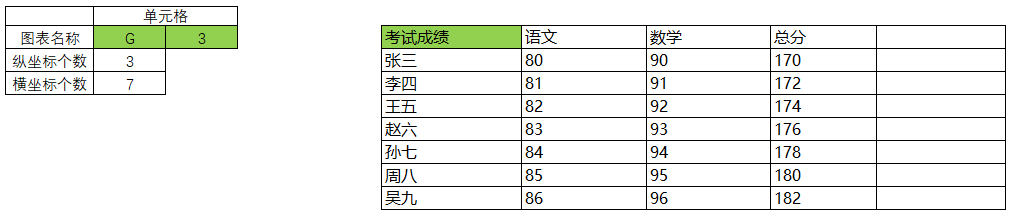
通过读取【charts_demo.xlsx】文件数据,使用pycharts生成名为【page_simple_layout.html】的HTML图表。
python
from pyecharts.charts import Bar,Page
from pyecharts import options as opts
from openpyxl import load_workbook
import numpy as np
import math
from pyecharts.globals import ThemeType
import os
#split the arr into N chunks
def chunks(arr, m):
n = int(math.ceil(len(arr) / float(m)))
return [arr[i:i + n] for i in range(0, len(arr), n)]
def build_bar():
hor_num = ws['C5'].value
ord_num = ws['C4'].value
xtype=[]
xline=[]
yline=[]
yline2=[[]]
for col in ws.iter_cols(min_col=8, max_col=8+ord_num-1, min_row=3, max_row=3):
for cell in col:
xtype.append(cell.value)
for col in ws.iter_cols(min_col=7, max_col=7, min_row=4, max_row=hor_num+3):
for cell in col:
xline.append(cell.value)
for col in ws.iter_cols(min_col=8, max_col=8+ord_num-1, min_row=4, max_row=hor_num+3):
for cell in col:
yline.append(format((cell.value),'.0f'))#yline.append(format((cell.value),'.1f'))
yline2 = chunks(yline,ord_num)
#print(xtype)
#print(xline)
#print(yline)
#print(yline2)
bar2 = Bar(init_opts=opts.InitOpts(theme=ThemeType.LIGHT,width='1200px'))
#修改源文件使保存的图片背景为白色 opts.ToolBoxFeatureSaveAsImageOpts(background_color="white")
bar2.add_xaxis(xline)
j=0
for i in yline2:
bar2.add_yaxis(xtype[j],i)
j=j+1
if j>3:
j=0
bar2.set_global_opts(
title_opts=opts.TitleOpts(title=str(ws['G3'].value)),
tooltip_opts=opts.TooltipOpts(trigger="axis"),
toolbox_opts=opts.ToolboxOpts(is_show=True,feature=opts.ToolBoxFeatureOpts(save_as_image=opts.ToolBoxFeatureSaveAsImageOpts(background_color="#F7F7F7"))),
xaxis_opts=opts.AxisOpts(type_="category", boundary_gap=True),
#datazoom_opts=opts.DataZoomOpts(range_start=10,range_end=90), # 坐标轴进行缩放
)
return bar2
excel_name = "charts_demo.xlsx"
html_name = "page_simple_layout.html"
if __name__=='__main__':
current_path = os.getcwd()
excel_path = current_path+"\\"+excel_name
html_patch = current_path+"\\"+html_name
wb = load_workbook(excel_path, data_only=True)
ws=wb['Sheet1']
# 简单布局
page = Page(layout=Page.SimplePageLayout)
# 将上面定义好的图添加到 page
page.add(build_bar())
page.render(html_patch)
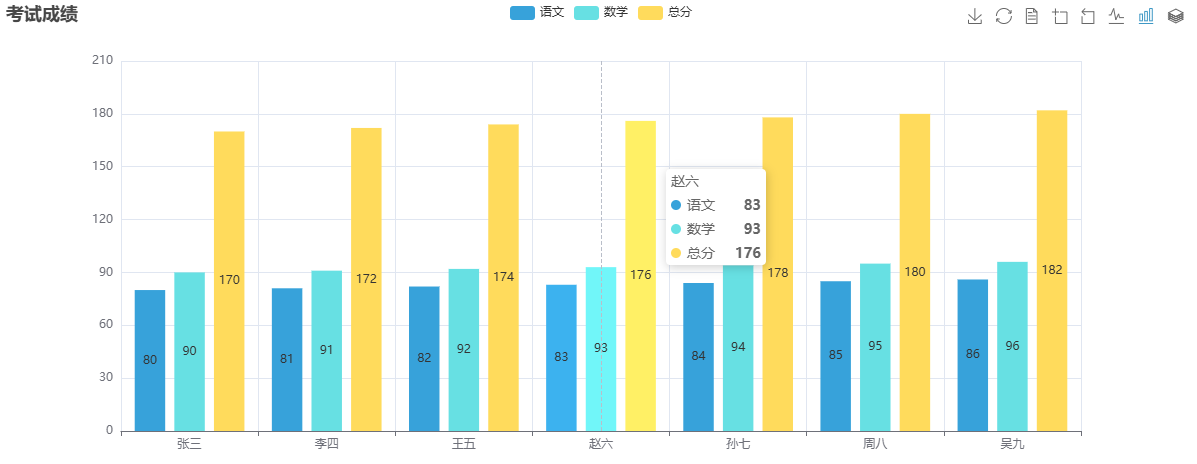
print('finish')通过指定单元格G3的内容为图表名称,指定纵坐标个数【语文、数学、总分】,横坐标个数【张三、李四、王五、赵六、孙七、周八、吴九】:
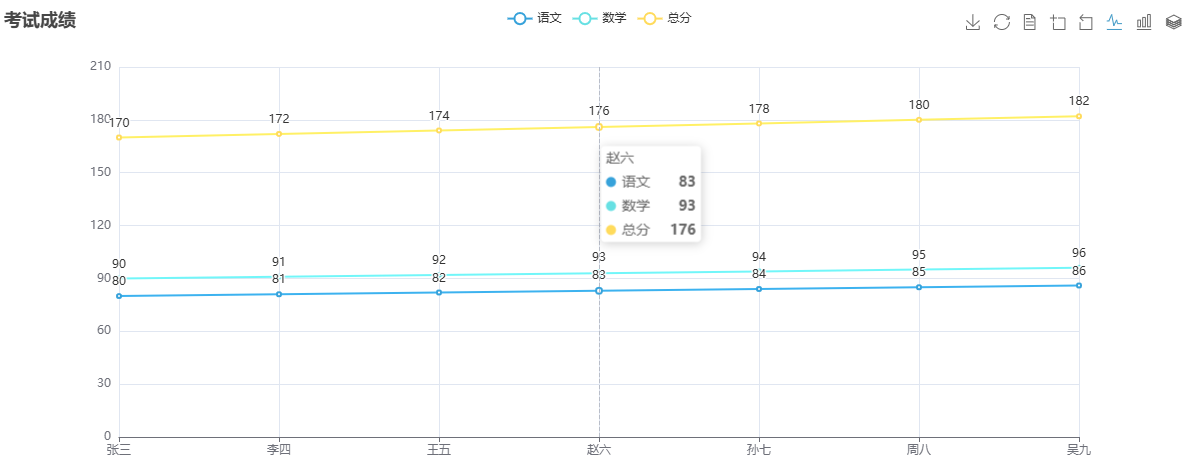
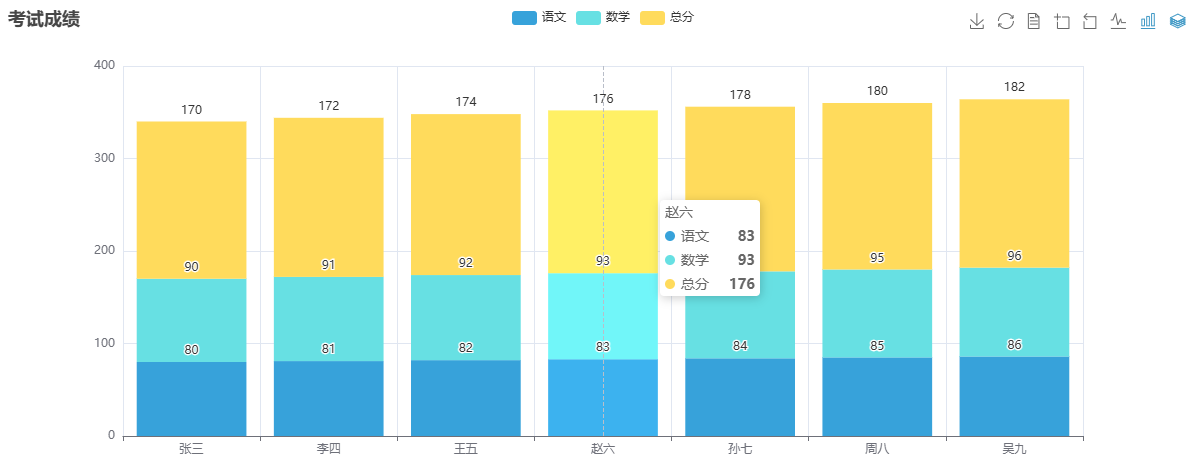
运行py程序后,可以通过右上角一排按钮转换为折线图、柱状图,保存图片等。效果如下: