C# WPF 折线图制作笔记(LiveCharts 库)
一、核心信息
1. 开发环境
-
.NET Framework 4.7.2
-
WPF 应用程序
-
核心库:LiveCharts、LiveCharts.Wpf(需通过 NuGet 安装)
2. 核心组件说明
| 组件 | 作用 |
|---|---|
| CartesianChart | LiveCharts 的核心图表控件,用于绘制笛卡尔坐标系图表(折线图、柱状图等) |
| SeriesCollection | 图表系列集合,存放多条折线的数据 |
| LineSeries | 折线系列,单条折线的样式、数据配置 |
| ChartValues<double> | 折线的数值集合,存储具体数据点 |
| Axis | 坐标轴配置(X 轴 / Y 轴),支持标题、标签、格式化器 |
二、实现步骤拆解
步骤 1:安装依赖库
通过 NuGet 包管理器安装:
-
LiveCharts(核心逻辑)
-
LiveCharts.Wpf(WPF 控件封装)
步骤 2:创建折线图用户控件(UCLineChart)
2.1 XAML 布局(UCLineChart.xaml)
<UserControl x:Class="LineChart2.UCLineChart"
             xmlns="http://schemas.microsoft.com/winfx/2006/xaml/presentation"
             xmlns:x="http://schemas.microsoft.com/winfx/2006/xaml"
             xmlns:mc="http://schemas.openxmlformats.org/markup-compatibility/2006"
             xmlns:d="http://schemas.microsoft.com/expression/blend/2008"
             xmlns:local="clr-namespace:LineChart2"
             <!-- 引入LiveCharts.Wpf命名空间 -->
             xmlns:lvc="clr-namespace:LiveCharts.Wpf;assembly=LiveCharts.Wpf"
             mc:Ignorable="d"
             d:DesignHeight="450" d:DesignWidth="800">
    <Grid>
        <!-- 核心图表控件 -->
        <lvc:CartesianChart
            Series="{Binding SeriesCollection}"  <!-- 绑定折线系列集合 -->
            LegendLocation="Right">              <!-- 图例位置:右侧 -->
            <!-- Y轴配置 -->
            <lvc:CartesianChart.AxisY>
                <lvc:Axis
                    Title="Sales"                <!-- Y轴标题 -->
                    LabelFormatter="{Binding YFormatter}"> <!-- Y轴数值格式化 -->
                </lvc:Axis>
            </lvc:CartesianChart.AxisY>
            <!-- X轴配置 -->
            <lvc:CartesianChart.AxisX>
                <lvc:Axis
                    Title="Month"                <!-- X轴标题 -->
                    Labels="{Binding Labels}">   <!-- X轴标签(文本) -->
                </lvc:Axis>
            </lvc:CartesianChart.AxisX>
        </lvc:CartesianChart>
    </Grid>
</UserControl>
2.2 后台逻辑(UCLineChart.xaml.cs)
using LiveCharts;
using LiveCharts.Wpf;
using System.Windows;
using System.Windows.Controls;
namespace LineChart2
{
public partial class UCLineChart : UserControl
{
// 绑定属性:折线系列集合
public SeriesCollection SeriesCollection { get; set; }
// 绑定属性:X轴标签
public string[] Labels { get; set; }
// 绑定属性:Y轴数值格式化器
public Func<double, string> YFormatter { get; set; }
public UCLineChart()
{
InitializeComponent();
// 1. 初始化折线系列集合
SeriesCollection = new SeriesCollection
{
// 第一条折线
new LineSeries
{
Title = "Series 1", // 折线名称(图例显示)
Values = new ChartValues<double> { 4, 6, 5, 2, 7 } // 数据点
},
// 第二条折线
new LineSeries
{
Title = "Series 2",
Values = new ChartValues<double> { 6, 7, 3, 4, 6 }
}
};
// 2. 配置X轴标签
Labels = new[] { "Jan", "Feb", "Mar", "Apr", "May" };
// 3. 配置Y轴格式化器(货币格式)
YFormatter = value => value.ToString("C");
// 4. 动态添加第三条折线(支持动画更新)
SeriesCollection.Add(new LineSeries
{
Values = new ChartValues<double> { 5, 3, 2, 4 },
LineSmoothness = 0 // 折线平滑度:0=直线,1=最平滑
});
// 5. 动态追加数据点(支持动画更新)
SeriesCollection[2].Values.Add(5d);
// 6. 设置数据上下文(绑定生效)
DataContext = this;
}
}
}步骤 3:在主窗口引用用户控件(MainWindow.xaml)
<Window x:Class="LineChart2.MainWindow"
        xmlns="http://schemas.microsoft.com/winfx/2006/xaml/presentation"
        xmlns:x="http://schemas.microsoft.com/winfx/2006/xaml"
        xmlns:d="http://schemas.microsoft.com/expression/blend/2008"
        xmlns:mc="http://schemas.openxmlformats.org/markup-compatibility/2006"
        xmlns:local="clr-namespace:LineChart2"
        mc:Ignorable="d"
        Title="MainWindow" Height="450" Width="800">
    <Grid>
        <Grid Margin="10">
            <!-- 引用自定义折线图控件 -->
            <local:UCLineChart x:Name="ucLineChart"
                           HorizontalAlignment="Stretch"  <!-- 水平拉伸 -->
                           VerticalAlignment="Stretch"    <!-- 垂直拉伸 -->
                           Background="#F5F5F5"           <!-- 背景色 -->
                           BorderBrush="#E0E0E0"          <!-- 边框色 -->
                           BorderThickness="1" />         <!-- 边框厚度 -->
        </Grid>
    </Grid>
</Window>
三、关键特性说明
1. 动态更新数据
LiveCharts 支持动画更新 ,修改 SeriesCollection 或 ChartValues 会自动触发图表动画:
// 动态添加折线
SeriesCollection.Add(new LineSeries { Values = new ChartValues<double> { 1, 2, 3 } });
// 动态追加数据点
SeriesCollection[0].Values.Add(8d);
// 动态修改数据点
SeriesCollection[1].Values[2] = 9d;
2. 折线样式配置
LineSeries 常用属性:
| 属性 | 作用 | 示例值 |
|---|---|---|
| LineSmoothness | 折线平滑度(0-1) | 0(直线)、0.5 |
| Stroke | 折线颜色 | Brushes.Red |
| StrokeThickness | 折线粗细 | 2 |
| PointGeometry | 数据点形状(圆形 / 方形等) | DefaultGeometries.Circle |
| PointForeground | 数据点填充色 | Brushes.Blue |
示例:自定义折线样式
new LineSeries
{
    Title = "Custom Series",
    Values = new ChartValues<double> { 2, 5, 3, 8 },
    LineSmoothness = 0.8,
    Stroke = Brushes.Orange,
    StrokeThickness = 3,
    PointGeometry = DefaultGeometries.Triangle,
    PointForeground = Brushes.Purple
};
3. 坐标轴自定义
// 自定义X轴
var axisX = new Axis
{
Title = "时间",
Labels = new[] { "周一", "周二", "周三" },
LabelRotation = 15, // 标签旋转角度
Foreground = Brushes.Gray // 标签颜色
};
// 自定义Y轴
var axisY = new Axis
{
Title = "数值",
MinValue = 0, // 最小值
MaxValue = 10, // 最大值
LabelFormatter = v => $"{v} 个" // 格式化标签
};
// 应用到图表
myCartesianChart.AxisX.Add(axisX);
myCartesianChart.AxisY.Add(axisY);四、完整示例(扩展版)
需求
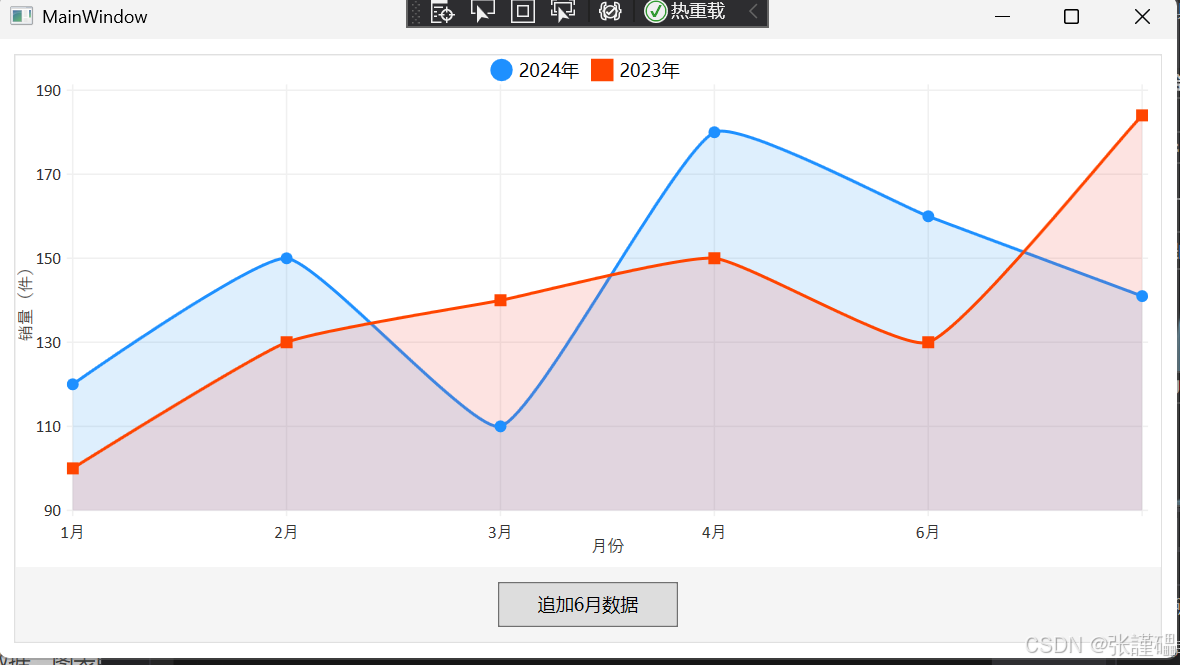
制作一个带动态数据、自定义样式的月度销量折线图,支持实时追加数据。
完整代码
1. UCLineChart.xaml
cs
<UserControl x:Class="LineChart2.UCLineChart"
             xmlns="http://schemas.microsoft.com/winfx/2006/xaml/presentation"
             xmlns:x="http://schemas.microsoft.com/winfx/2006/xaml"
             xmlns:mc="http://schemas.openxmlformats.org/markup-compatibility/2006"
             xmlns:d="http://schemas.microsoft.com/expression/blend/2008"
             xmlns:local="clr-namespace:LineChart2"
             xmlns:lvc="clr-namespace:LiveCharts.Wpf;assembly=LiveCharts.Wpf"
             mc:Ignorable="d"
             d:DesignHeight="450" d:DesignWidth="800">
    <Grid>
        <Grid.RowDefinitions>
            <RowDefinition Height="*"/>
            <RowDefinition Height="Auto"/>
        </Grid.RowDefinitions>

        <lvc:CartesianChart x:Name="chart"
                            Series="{Binding SeriesCollection}"
                            LegendLocation="Top"
                            Background="White">
            <lvc:CartesianChart.AxisY>
                <lvc:Axis Title="销量(件)"
                          LabelFormatter="{Binding YFormatter}"
                          Foreground="#333333"/>
            </lvc:CartesianChart.AxisY>
            <lvc:CartesianChart.AxisX>
                <lvc:Axis Title="月份"
                          Labels="{Binding Labels}"
                          Foreground="#333333"/>
            </lvc:CartesianChart.AxisX>
        </lvc:CartesianChart>

        <!-- 追加数据按钮 -->
        <Button Grid.Row="1"
                Content="追加6月数据"
                Width="120" Height="30"
                Margin="10"
                Click="BtnAddData_Click"/>
    </Grid>
</UserControl>
2. UCLineChart.xaml.cs
cs
using LiveCharts;
using LiveCharts.Defaults;
using LiveCharts.Wpf;
using System;
using System.Windows;
using System.Windows.Controls;
using System.Windows.Media;

namespace LineChart2
{
    public partial class UCLineChart : UserControl
    {
        public SeriesCollection SeriesCollection { get; set; }
        public string[] Labels { get; set; }
        public Func<double, string> YFormatter { get; set; }

        // 模拟销量数据
        private readonly Random _random = new Random();

        public UCLineChart()
        {
            InitializeComponent();

            // 初始化系列
            SeriesCollection = new SeriesCollection
            {
                // 2024年销量
                new LineSeries
                {
                    Title = "2024年",
                    Values = new ChartValues<double> { 120, 150, 110, 180, 160 },
                    LineSmoothness = 0.3,
                    Stroke = Brushes.DodgerBlue,
                    StrokeThickness = 2,
                    PointGeometry = DefaultGeometries.Circle,
                    PointGeometrySize = 8,
                    PointForeground = Brushes.DodgerBlue
                },
                // 2023年销量
                new LineSeries
                {
                    Title = "2023年",
                    Values = new ChartValues<double> { 100, 130, 140, 150, 130 },
                    LineSmoothness = 0.3,
                    Stroke = Brushes.OrangeRed,
                    StrokeThickness = 2,
                    PointGeometry = DefaultGeometries.Square,
                    PointGeometrySize = 8,
                    PointForeground = Brushes.OrangeRed
                }
            };

            // X轴标签(1-5月)
            Labels = new[] { "1月", "2月", "3月", "4月", "5月" };

            // Y轴格式化(显示整数)
            YFormatter = value => $"{value:N0}";

            DataContext = this;
        }

        // 追加6月数据按钮点击事件
        private void BtnAddData_Click(object sender, RoutedEventArgs e)
        {
            // 生成随机销量(100-200)
            double sales2024 = _random.Next(100, 200);
            double sales2023 = _random.Next(100, 200);

            // 追加数据点
            SeriesCollection[0].Values.Add(sales2024);
            SeriesCollection[1].Values.Add(sales2023);

            // 更新X轴标签
           // ArrResize(out Labels, Labels.Length + 1);
            Labels[Labels.Length - 1] = "6月";

            // 刷新绑定(触发UI更新)
            chart.AxisX[0].Labels = Labels;
        }
    }
}
3. MainWindow.xaml(无修改)
cs
<Window x:Class="LineChart2.MainWindow"
        xmlns="http://schemas.microsoft.com/winfx/2006/xaml/presentation"
        xmlns:x="http://schemas.microsoft.com/winfx/2006/xaml"
        xmlns:d="http://schemas.microsoft.com/expression/blend/2008"
        xmlns:mc="http://schemas.openxmlformats.org/markup-compatibility/2006"
        xmlns:local="clr-namespace:LineChart2"
        mc:Ignorable="d"
        Title="MainWindow" Height="450" Width="800">
    <Grid>
        <Grid Margin="10">
            <!-- 自定义折线图用户控件 -->
            <local:UCLineChart x:Name="ucLineChart"
                           HorizontalAlignment="Stretch"
                           VerticalAlignment="Stretch"
                           Background="#F5F5F5"
                           BorderBrush="#E0E0E0"
                           BorderThickness="1"
                           />

        </Grid>
    </Grid>
</Window>
保持原代码不变,运行后可看到:
-
包含 2023/2024 年 1-5 月销量的折线图
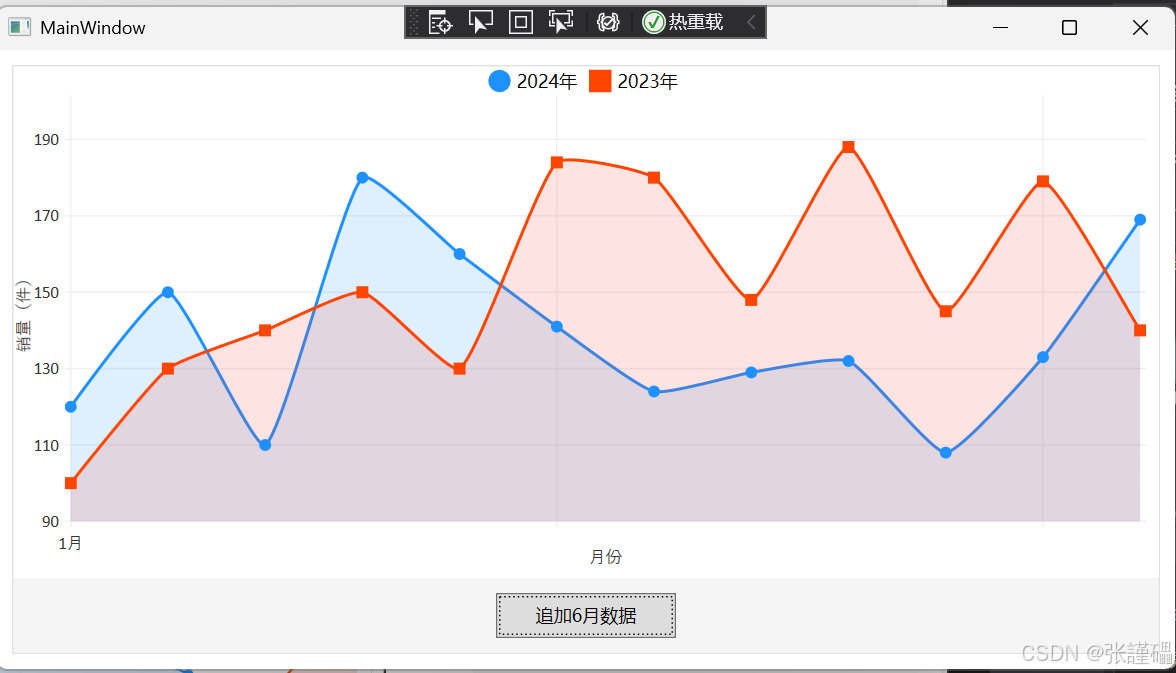
-
点击 "追加 6 月数据" 按钮,动态添加 6 月随机销量数据,图表自动更新并播放动画
五、常见问题解决
-
NuGet 安装失败:确保选择与.NET Framework 4.7.2 兼容的 LiveCharts 版本(推荐 0.9.7)。
-
绑定不生效 :检查
DataContext = this;是否执行,属性是否为公共属性(public)。 -
图表无显示 :确保
SeriesCollection有数据,且Labels长度与数据点数量匹配。 -
动画卡顿 :大量数据时可关闭动画:
chart.DisableAnimations = true;。
六、扩展方向
-
绑定 MVVM 架构:将
SeriesCollection等属性移到 ViewModel 中,实现数据与 UI 分离。 -
数据导出:结合 Excel 库(如 EPPlus)将图表数据导出为 Excel。
-
交互增强:添加数据点点击事件、图例隐藏 / 显示、坐标轴缩放等功能。
-
样式定制:通过
Chart.Style或自定义模板修改图表整体样式。