研发要求:
B i p lo t 图
基础结果表格(绘图数据,部分)
得分表
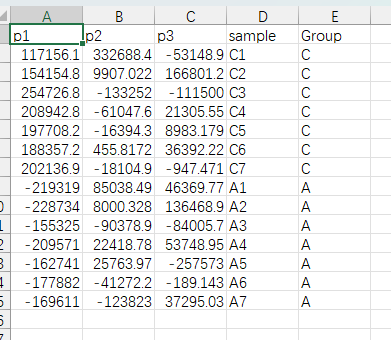
表头解释
p1:第一主成分
p2:第二主成分
p3:第三主成分
sample:样本名
Group:分组名
载荷表
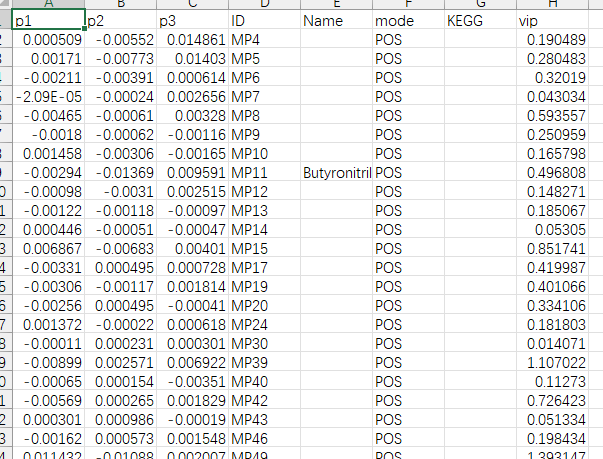
表头解释
p1:第一主成分
p2:第二主成分
p3:第三主成分
ID:此次项目代谢物对应的ID
Name:此次项目代谢物对应的Name
mode:代谢物的模式
vip:VIP值
其他表头:ID对应的注释信息
图形解释
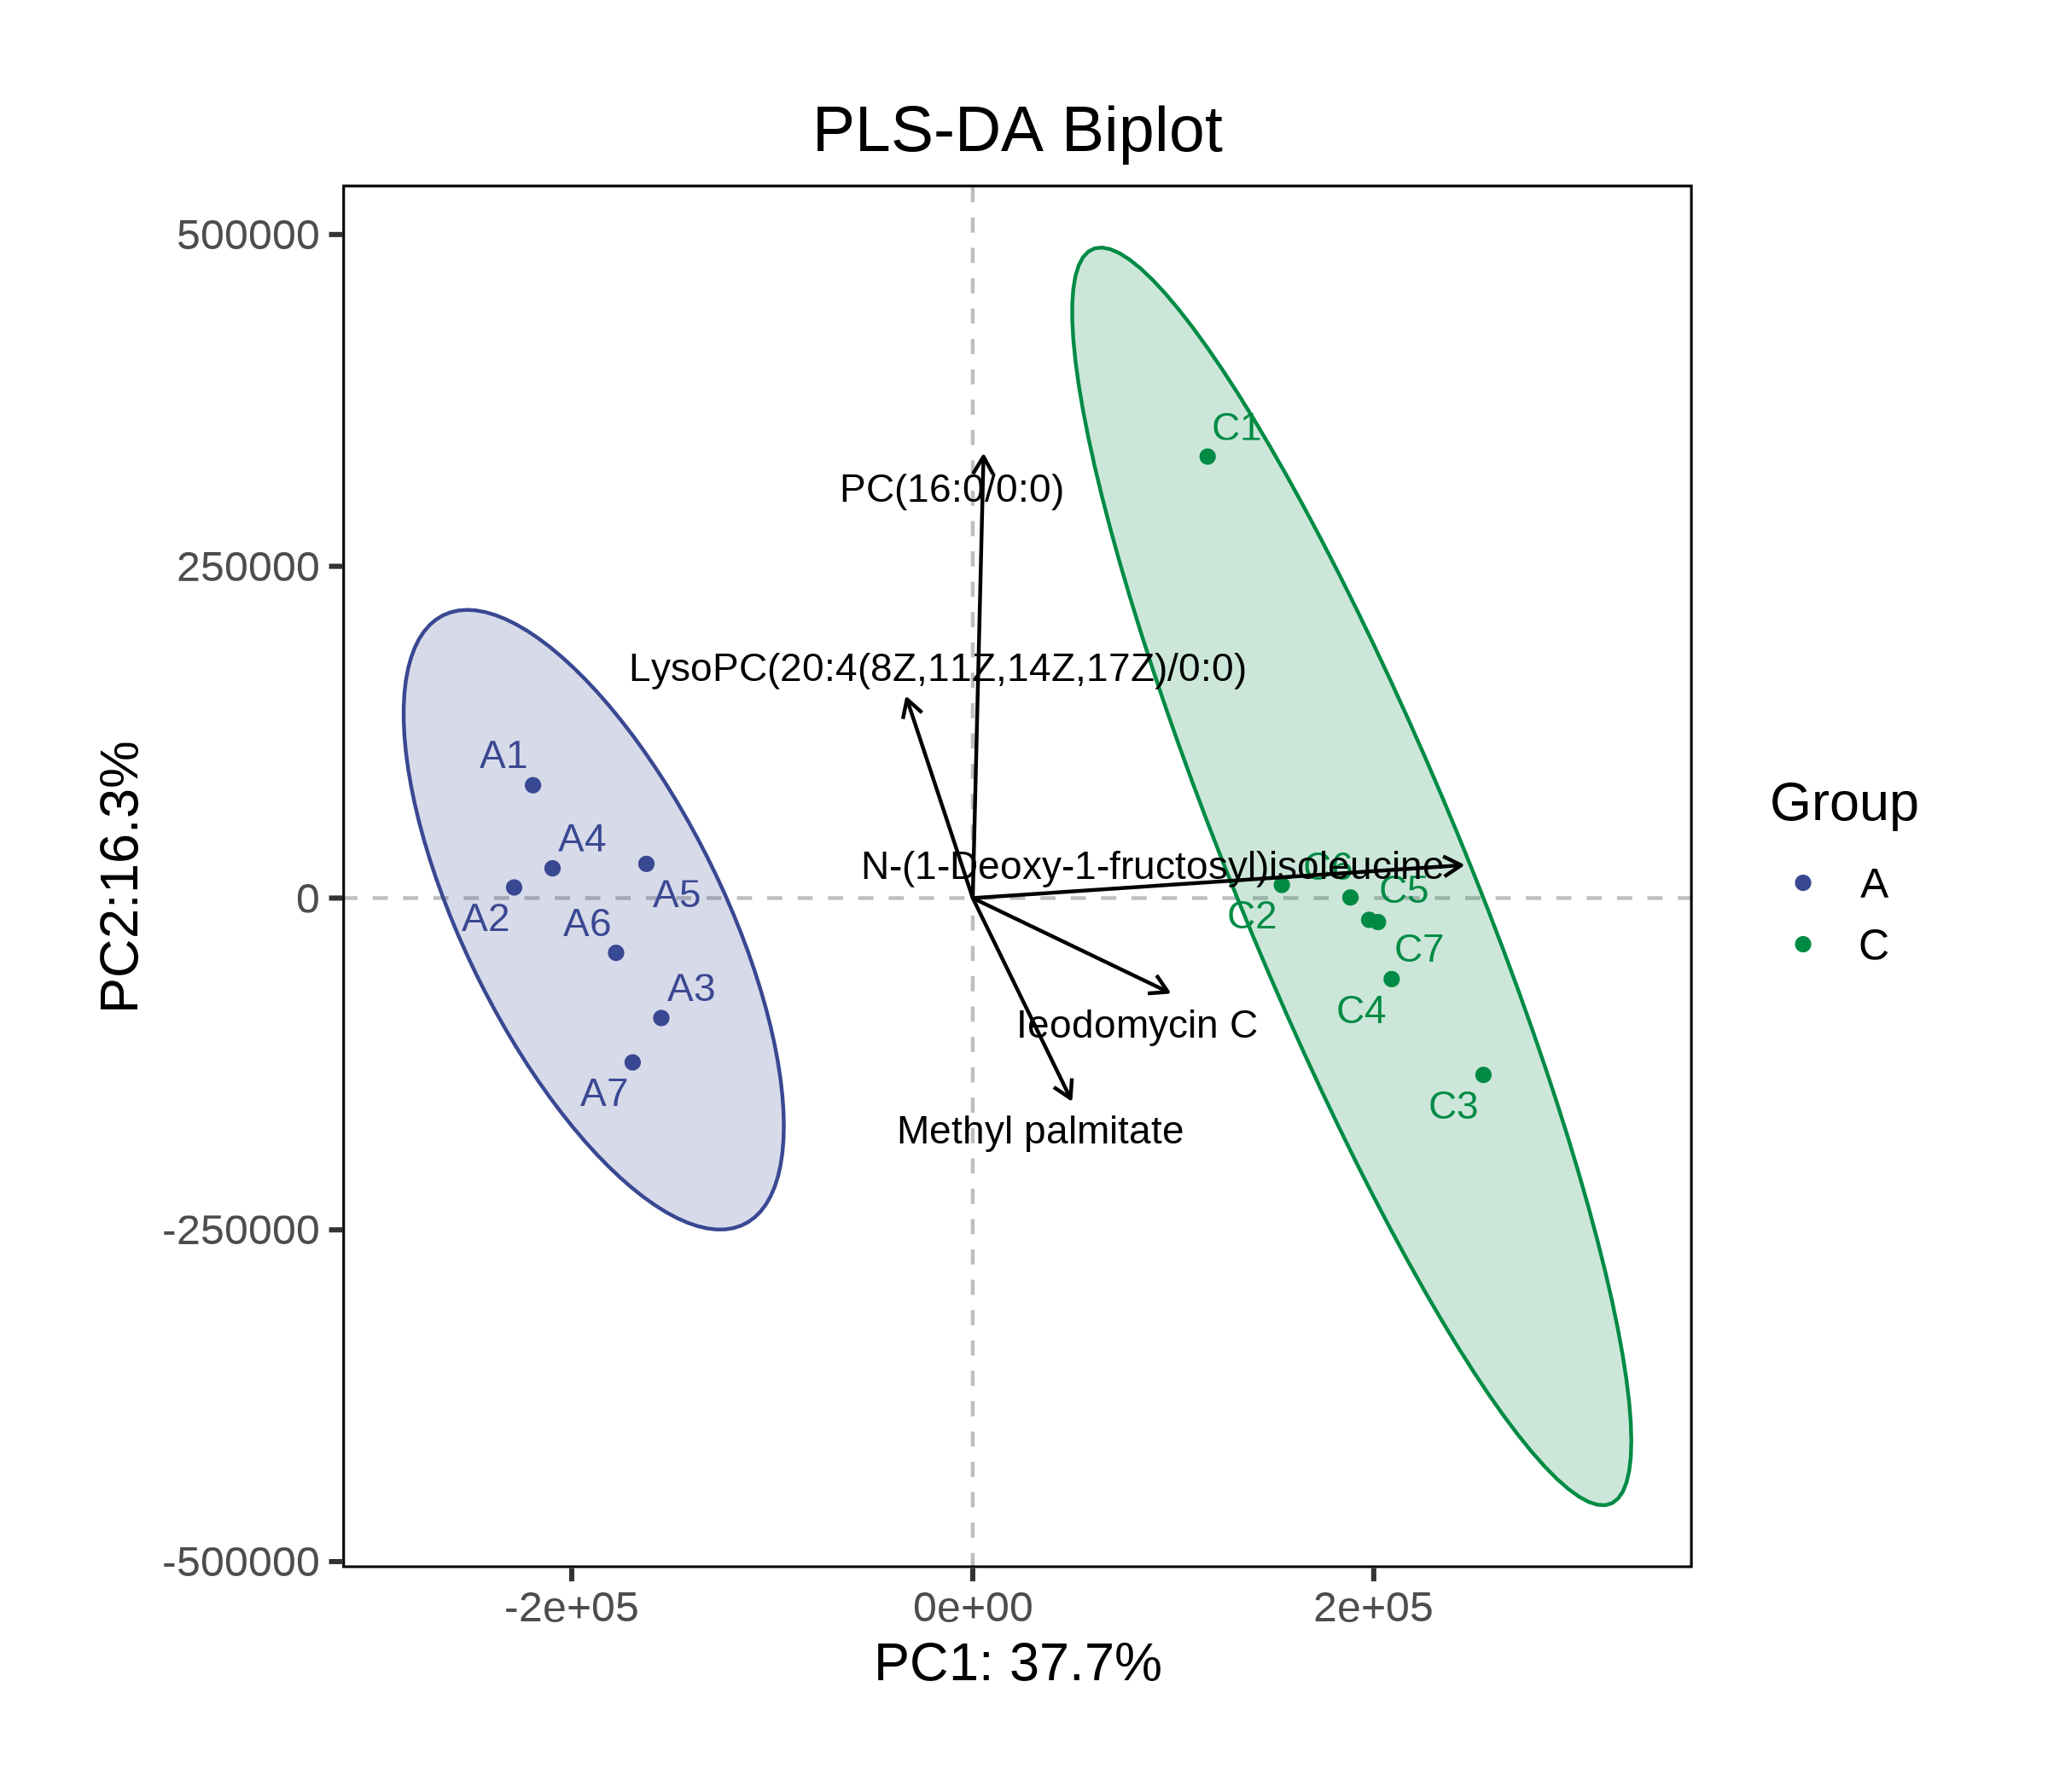
x轴为第一主成分,y轴为第二主成分。这张图在得分图的基础上加上特定的代谢物的载荷。由于载荷的数量级通常不会和得分的数量级一致,我们绘图时会将其进行缩放。样本通常以点的形式表示,而变量则以箭头表示,箭头的方向和长度分别代表了变量对主成分的贡献度和相关性。
线下缩放系数max(abs(score,c("p1","p2"))) / max(abs(loading,c("p1","p2")))。即得分表xy轴绝对值最大的数/选取代谢物xy轴绝对值最大的数
图形参数:
图表设置
宽度 100 %
高度 100 %
填充透明度:100%
X轴:PC1,可选PC1,PC2,PC3 PC1用p1,PC2用p2,PC3用p3
Y轴:PC2,可选PC1,PC2,PC3 PC1用p1,PC2用p2,PC3用p3
代谢物标签
显示代谢物TOP 5 范围1-15,TOP按照|p1|+|p2|最大的前20个(PCA),VIP由大到小(PLS-DA)
字体 Arial
字号 12
颜色 单色,默认:黑色"#000000"
线条粗细 1
线条颜色 单色,默认:黑色"#000000"
主标题设置
标题样式
标题 PCA Biplot
字体 Arial
字号 12
颜色 单色,默认:黑色"#000000"
X轴设置
标题样式
标题 PC1 (实际比例)
字体 Arial
字号 12
颜色 单色,默认黑色"#000000"
标签样式
字体 Arial
字号 12
颜色 单色,默认黑色"#000000"
Y轴设置
标题样式
标题 PC2(实际比例)
字体 Arial
字号 12
颜色 单色,默认黑色"#000000"
标签样式
字体 Arial
字号 12
颜色 单色,默认黑色"#000000"
下面是项目里封装好的方法 可以直接调用,上代码:
import * as d3 from "d3";
import { getColorList } from "@/utils/commonMethod";
const pcaChart = (options = {}) => {
let originContainer = document.querySelector("#chart-container");
let originHeight = originContainer.offsetHeight;
let originWidth = originContainer.offsetWidth;
let height = originHeight * (options.height / 100);
let width = originWidth * (options.width / 100);
// 添加存储拖拽状态的变量
let draggedMetaboliteLabels = new Map();
let currentSvg = null;
function getSvgTextStyle({
text = "",
fontSize = 14,
fontFamily = "Arial",
fontWeight = "normal"
} = {}) {
const svg = d3
.select("body")
.append("svg")
.attr("class", "get-svg-text-style");
const textStyle = svg
.append("text")
.text(text)
.attr("font-size", fontSize)
.attr("font-family", fontFamily)
.attr("font-weight", fontWeight)
.node()
.getBBox();
svg.remove();
return {
width: textStyle.width,
height: textStyle.height
};
}
function getSvgLinearAxisStyle({
fontSize = 20,
orient = "bottom",
fontFamily = "Arial",
fontWeight = "normal",
rotate = 0,
domain = [0, 9],
range = [0, 200]
} = {}) {
let axis;
let svg = d3
.select("body")
.append("svg")
.attr("width", 200)
.attr("height", 100)
.attr("transform", "translate(300, 200)")
.attr("class", "get-svg-axis-style");
let scale = d3.scaleLinear().domain(domain).range(range);
if (orient === "bottom" || orient === "top") {
axis = d3.axisBottom(scale);
} else {
axis = d3.axisLeft(scale);
}
let axisStyle = svg
.append("g")
.call(axis)
.call(g => {
g.selectAll("text")
.attr("fill", "#555")
.attr("font-size", fontSize)
.attr("font-family", fontFamily)
.attr("font-weight", fontWeight)
.attr(
"tmpY",
g.select("text").attr("tmpY") || g.select("text").attr("dy")
)
.attr(
"dy",
rotate > 70 && rotate <= 90
? "0.35em"
: rotate >= -90 && rotate < -70
? "0.4em"
: g.select("text").attr("tmpY")
)
.attr(
"text-anchor",
orient === "left"
? "end"
: rotate
? rotate > 0
? "start"
: "end"
: "middle"
)
.attr(
"transform",
`translate(0, 0) ${
rotate ? `rotate(${rotate} 0 ${g.select("text").attr("y")})` : ""
}`
);
})
.node()
.getBBox();
svg.remove();
return {
width: axisStyle.width,
height: axisStyle.height
};
}
const symbolZoomTimes = 10;
const symbolZoomTimesHover = 15;
const symbolTypes = {
circle: d3.symbolCircle,
cross: d3.symbolCross,
diamond: d3.symbolDiamond,
square: d3.symbolSquare,
star: d3.symbolStar,
triangle: d3.symbolTriangle,
wye: d3.symbolWye
};
const lineShapes = {
point: "2 2",
straigh_line: "0",
dash_dot: "10 10 2 2",
long_dash: "20 10 2 2",
short_straight_line: "10 10"
};
const classList = [
".svg-groups-hull-group",
".svg-groups-ellipse-group",
".svg-groups-line-group",
".svg-groups-scatter-group",
".svg-groups-label-group"
];
const pcaNameList = ["PC1", "PC2", "PC3"];
function legendMouse(type, index, data = []) {
data.forEach((item, i) => {
let opacity = type === "mouseout" ? 1 : index == i ? 1 : 0.3;
let fontWeight =
type === "mouseout" ? "normal" : index == i ? "bold" : "normal";
d3.select(`.svg-legend-label-item${i}`).attr("font-weight", fontWeight);
classList.forEach(subItem => {
d3.selectAll(subItem + i).attr("opacity", opacity);
});
});
}
function legendClick(index, color = "") {
let el = d3.selectAll(`.svg-groups-scatter-group${index}`);
let visibility = el.attr("visibility");
let isVisibility = visibility
? visibility === "visible"
? true
: false
: true;
d3.select(`.svg-legend-label-item${index}`).attr(
"fill",
isVisibility ? "#ccc" : "#000"
);
d3.select(`.svg-legend-path-item${index}`).attr(
"fill",
isVisibility ? "#ccc" : color
);
classList.forEach(item => {
if (isVisibility) {
el.attr("visibility", "hidden");
} else {
el.attr("visibility", "visible");
}
});
}
function tooltip({
group,
sample,
xValue,
yValue,
left,
top,
parentElement
}) {
if (d3.select(".scatter-tooltip").empty()) {
d3.select("body")
.append("div")
.attr("class", "scatter-tooltip")
.html(
`<div class="scatter-tooltip-group">
group: ${group}
</div>
<div class="scatter-tooltip-sample">
sample: ${sample}
</div>
<div class="scatter-tooltip-x">
X轴:${xValue}
</div>
<div class="scatter-tooltip-y">
Y轴:${yValue}
</div>
`
)
.style("position", "fixed")
.style("left", `${left}px`)
.style("top", `${top}px`)
.style("padding", "8px 5px")
.style("border-radius", "4px")
.style("font-size", "12px")
.style("color", "#555")
.style("background", "rgba(255, 255, 255, .8)")
.style("border", `1px solid ${d3.select(parentElement).attr("fill")}`);
} else {
d3.select(".scatter-tooltip")
.style("display", "block")
.style("left", `${left}px`)
.style("top", `${top}px`)
.style("border", `1px solid ${d3.select(parentElement).attr("fill")}`);
d3.select(".scatter-tooltip-group").html(`group: ${group}`);
d3.select(".scatter-tooltip-sample").html(`sample: ${sample}`);
d3.select(".scatter-tooltip-x").html(` X轴: ${xValue}`);
d3.select(".scatter-tooltip-y").html(` Y轴: ${yValue}`);
}
}
let {
container = "#biplot-container",
top = 15,
left = 20,
right = 10,
bottom = 20,
data = {},
groupList = [],
plot_type = "scatter",
dot_types = {
A: "circle",
B: "circle"
},
dot_size = 10,
opacity = 0.4,
grid_enabled = false,
border_enabled = true,
center_line_enabled = false,
auxiliary_line_enabled = false,
line_type = "straigh_line",
x_axis_value = "PC1",
y_axis_value = "PC2",
label_color = "#000",
label_font = "Arial",
label_size = 10,
isLabel = true,
main_title = "",
main_title_color = "#000",
main_title_font = "Arial",
main_title_size = 14,
x_title = "",
x_title_color = "#000",
x_title_font = "Arial",
x_title_size = 14,
x_text_color = "#000",
x_text_font = "Arial",
x_text_size = 12,
x_text_rotate = 0,
y_title = "",
y_title_color = "#000",
y_title_font = "Arial",
y_title_size = 14,
y_text_color = "#000",
y_text_font = "Arial",
y_text_size = 12,
legend_title = "",
legend_title_color = "#000",
legend_title_size = 12,
legend_title_font = "Arial",
legend_text_color = "#000",
legend_text_font = "Arial",
legend_text_size = 12,
legend_size = 7,
stress = false,
stressValue = "1111",
metabolites = [],
metabolites_count = 5,
metabolites_text_font = "Arial",
metabolites_text_size = 12,
metabolites_text_color = "black",
metabolites_label_type = "id",
// 添加拖拽相关配置
metabolites_draggable = true // 是否启用拖拽功能
} = options;
let forwardValue = `${x_axis_value}_${y_axis_value}`;
let reverseValue = `${y_axis_value}_${x_axis_value}`;
let colors = getColorList(options.color);
let newGroupcheck = [];
newGroupcheck = data.groups?.filter((item, index) => {
if (groupList.indexOf(item.group) !== -1) {
return item;
}
});
const box = document.querySelector(container);
if (!box || !data.list || !data.list.length) return;
if (options.data.type === "two") {
options.data.list.forEach(item => {
let lineData = item.line[forwardValue] || item.line[reverseValue];
lineData.ellipse = [];
});
}
if (options.data.type === "one") {
options.data.list.forEach(item => {
let lineData = item.line[forwardValue] || item.line[reverseValue];
lineData.hull = [];
});
}
let xIndex = pcaNameList.indexOf(x_axis_value);
let yIndex = pcaNameList.indexOf(y_axis_value);
let xCoordSet = [];
let yCoordSet = [];
data.list.forEach((item, index) => {
xCoordSet.push(item.center[0][xIndex]);
yCoordSet.push(item.center[0][yIndex]);
item.data.forEach((subItem, j) => {
xCoordSet.push(Number(subItem[xIndex + 1]));
yCoordSet.push(Number(subItem[yIndex + 1]));
});
let isAxisReverse = !item.line[forwardValue];
let pcaXIndex = isAxisReverse ? 1 : 0;
let pcaYIndex = isAxisReverse ? 0 : 1;
let pcaData = item.line[forwardValue] || item.line[reverseValue];
pcaData?.hull?.forEach((subItem, j) => {
xCoordSet.push(subItem[pcaXIndex]);
yCoordSet.push(subItem[pcaYIndex]);
});
pcaData?.ellipse?.forEach((subItem, j) => {
xCoordSet.push(subItem[pcaXIndex]);
yCoordSet.push(subItem[pcaYIndex]);
});
});
if (data.metabolites && data.metabolites.length > 0) {
data.metabolites.forEach(metabolite => {
let xValue, yValue;
if (x_axis_value === "PC1") xValue = metabolite.x;
else if (x_axis_value === "PC2") xValue = metabolite.y;
else if (x_axis_value === "PC3") xValue = metabolite.z;
if (y_axis_value === "PC1") yValue = metabolite.x;
else if (y_axis_value === "PC2") yValue = metabolite.y;
else if (y_axis_value === "PC3") yValue = metabolite.z;
xCoordSet.push(xValue);
yCoordSet.push(yValue);
});
}
const xOldMin = Math.min(...xCoordSet);
const xOldMax = Math.max(...xCoordSet);
const yOldMin = Math.min(...yCoordSet);
const yOldMax = Math.max(...yCoordSet);
const xTmpDomain = [xOldMin, xOldMax];
const yTmpDomain = [yOldMin, yOldMax];
const xTmpMin = xTmpDomain[0];
const xTmpMax = xTmpDomain[1];
const xStep = Math.abs(xTmpMax * 0.1);
const xMin = xTmpMin - xStep >= 0 ? -xStep : xTmpMin - xStep;
const xMax = xTmpMax + xStep > 0 ? xTmpMax + xStep : xStep;
const yTmpMin = yTmpDomain[0];
const yTmpMax = yTmpDomain[1];
const yStep = Math.abs(yTmpMax * 0.1);
const yMin = yTmpMin - yStep >= 0 ? -yStep : yTmpMin - yStep;
const yMax = yTmpMax + yStep > 0 ? yTmpMax + yStep : yStep;
const xDomain = [xMin, xMax];
const yDomain = [yMin, yMax];
const titleSpace = 10;
const titleH = getSvgTextStyle({
text: main_title,
fontSize: main_title_size,
fontFamily: main_title_font
}).height;
const titleTotalH = main_title ? titleH + titleSpace : 0;
const xTitleSpace = 10;
const xTitleH = getSvgTextStyle({
text: data.var ? x_title + `[${data.var[xIndex]}%]` : x_title,
fontSize: x_title_size,
fontFamily: x_title_font
}).height;
const xTitleTotalH = xTitleH + xTitleSpace;
const xAxisH = getSvgLinearAxisStyle({
fontSize: x_text_size,
fontFamily: x_text_font,
rotate: x_text_rotate,
domain: xDomain
}).height;
const yTitleSpace = 10;
const yTitleW = getSvgTextStyle({
text: data.var ? y_title + `[${data.var[yIndex]}%]` : y_title,
fontSize: y_title_size,
fontFamily: y_title_font
}).height;
const yTitleTotalW = yTitleW + yTitleSpace;
const yAxisW = getSvgLinearAxisStyle({
fontSize: y_text_size,
fontFamily: y_text_font,
domain: yDomain,
orient: "left"
}).width;
const legendList = [];
data.list.map(item => {
legendList.push({
label: item.group,
...getSvgTextStyle({
text: item.group,
fontSize: legend_text_size,
fontFamily: legend_text_font
})
});
});
const legendLabelSpace = 5;
const legendBottomSpace = 8;
const legendRightSpace = 10;
const legendLeftSpace = 15;
const legendLabelH = legendList.length
? Math.max(legendList[0].height, legend_size * 2)
: 0;
const legendLabelW = d3.max(legendList, d => d.width) || 0;
const legendEachH = legendLabelH + legendBottomSpace;
const legendEachW =
legendLabelW + legend_size * 2 + legendLabelSpace + legendRightSpace;
const chartHeight =
height - top - bottom - titleTotalH - xTitleTotalH - xAxisH;
const legendStep = Math.floor(chartHeight / legendEachH);
const legendColumn = Math.ceil(legendList.length / legendStep);
const legendTotalw = legendList.length ? legendColumn * legendEachW : 0;
const chartWidth =
width -
left -
right -
yTitleTotalW -
yAxisW -
legendLeftSpace -
legendTotalw;
const xScale = d3.scaleLinear().domain(xDomain).range([0, chartWidth]);
const yScale = d3.scaleLinear().domain(yDomain).range([chartHeight, 0]);
const xAxis = d3
.axisBottom(xScale)
.tickSizeOuter(border_enabled ? -chartHeight : 0);
const yAxis = d3
.axisLeft(yScale)
.tickSizeOuter(border_enabled ? -chartWidth : 0);
!d3.select(container).select("svg").empty() &&
d3.select(container).select("svg").remove();
const svg = d3
.select(container)
.append("svg")
.attr("width", width)
.attr("height", height)
.attr("id", "pca-svg-container");
currentSvg = svg;
svg
.append("defs")
.append("marker")
.attr("id", "lineArrow")
.attr("viewBox", "0 0 10 10")
.attr("refX", 8)
.attr("refY", 5)
.attr("orient", "auto")
.attr("markerWidth", 6)
.attr("markerHeight", 6)
.append("path")
.attr("d", "M0,0 L10,5 L0,10 L2,5 Z")
.attr("fill", "rgba(0, 0, 0, 0.4)");
svg
.append("g")
.attr("class", "svg-x-axis")
.attr(
"transform",
`translate(${left + yTitleTotalW + yAxisW}, ${
height - bottom - xTitleTotalH - xAxisH
})`
)
.call(xAxis)
.call(g => {
g.selectAll("text")
.attr("fill", x_text_color)
.attr("font-size", x_text_size)
.attr("font-family", x_text_font)
.attr(
"tmpY",
g.select("text").attr("tmpY") || g.select("text").attr("dy")
)
.attr(
"dy",
x_text_rotate > 70 && x_text_rotate <= 90
? "0.35em"
: x_text_rotate >= -90 && x_text_rotate < -70
? "0.4em"
: g.select("text").attr("tmpY")
)
.attr(
"text-anchor",
x_text_rotate ? (x_text_rotate > 0 ? "start" : "end") : "middle"
)
.attr(
"transform",
`translate(0, 0) ${
x_text_rotate
? `rotate(${x_text_rotate} 0 ${g.select("text").attr("y")})`
: ""
}`
);
});
svg
.append("g")
.attr("class", "svg-y-axis")
.attr(
"transform",
`translate(${left + yTitleTotalW + yAxisW}, ${top + titleTotalH})`
)
.call(yAxis)
.call(g => {
g.selectAll("text")
.attr("fill", y_text_color)
.attr("font-size", y_text_size)
.attr("font-family", y_text_font);
});
svg
.append("g")
.attr("class", "svg-main-title")
.append("text")
.text(main_title)
.attr("fill", main_title_color)
.attr("font-family", main_title_font)
.attr("font-size", main_title_size)
.attr("text-anchor", "middle")
.attr("dominant-baseline", "ideographic")
.attr(
"transform",
`translate(${left + yTitleTotalW + yAxisW + chartWidth / 2}, ${
main_title ? top + titleH : 0
})`
);
svg
.append("g")
.attr("class", "theme-pca")
.append("text")
.text(stressValue)
.attr("x", left + yTitleTotalW + yAxisW + chartWidth / 2)
.attr("y", main_title ? top + titleH + 9 : 9)
.attr("text-anchor", "middle")
.attr("fill", "rgba(0, 0, 0, 0.6)")
.attr("font-size", 12)
.attr("visibility", stress ? "visible" : "hidden");
svg
.append("g")
.attr("class", "svg-x-title")
.append("text")
.text(data.var ? x_title + ` [${data.var[xIndex]}%]` : x_title)
.attr("fill", x_title_color)
.attr("font-family", x_title_font)
.attr("font-size", x_title_size)
.attr("text-anchor", "middle")
.attr("dominant-baseline", "hanging")
.attr(
"transform",
`translate(${left + yTitleTotalW + yAxisW + chartWidth / 2}, ${
height - bottom - xTitleH
})`
);
svg
.append("g")
.attr("class", "svg-y-title")
.append("text")
.text(data.var ? y_title + ` [${data.var[yIndex]}%]` : y_title)
.attr("fill", y_title_color)
.attr("font-family", y_title_font)
.attr("font-size", y_title_size)
.attr("text-anchor", "middle")
.attr("dominant-baseline", "hanging")
.attr(
"transform",
`translate(${left}, ${top + titleH + chartHeight / 2}) rotate(-90)`
);
const legendEl = svg
.append("g")
.attr("cursor", "pointer")
.attr("class", "svg-legend")
.attr(
"transform",
`translate(${width - right - legendTotalw}, ${top + titleTotalH})`
);
legendEl
.append("g")
.attr("class", "svg-legend-path")
.selectAll("path")
.data(legendList)
.enter()
.append("path")
.attr("index", (d, i) => i)
.attr("class", (d, i) => `svg-legend-path-item svg-legend-path-item${i}`)
.attr("fill", (d, i) => colors[i % colors.length])
.attr("d", (d, i) => {
let group = data.list[i].group;
let type = dot_types[group] || "circle";
let symbol = d3
.symbol()
.type(symbolTypes[type])
.size(legend_size * symbolZoomTimes);
return symbol();
})
.attr("transform", (d, i) => {
let times = Math.floor(i / legendStep);
return `translate(${legend_size + legendEachW * times}, ${
legendLabelH / 2 + (legendLabelH + legendBottomSpace) * (i % legendStep)
})`;
})
.on("mouseover", function (e, d) {
let index = d3.select(this).attr("index");
legendMouse("mouseover", index, data.list);
})
.on("mouseout", function (e, d) {
let index = d3.select(this).attr("index");
legendMouse("mouseout", index, data.list);
})
.on("click", function (e, d) {
let index = d3.select(this).attr("index");
legendClick(index, colors[index]);
});
legendEl
.append("g")
.attr("class", "svg-legend-label")
.selectAll("text")
.data(legendList)
.enter()
.append("text")
.text(d => d.label)
.attr("index", (d, i) => i)
.attr("fill", legend_text_color)
.attr("font-size", legend_text_size)
.attr("font-family", legend_text_font)
.attr("dominant-baseline", "central")
.attr("class", (d, i) => `svg-legend-label-item svg-legend-label-item${i}`)
.attr("transform", (d, i) => {
let times = Math.floor(i / legendStep);
return `translate(${
legend_size * 2 + legendLabelSpace + legendEachW * times
}, ${
legendLabelH / 2 + (legendLabelH + legendBottomSpace) * (i % legendStep)
})`;
})
.on("mouseover", function (e, d) {
let index = d3.select(this).attr("index");
legendMouse("mouseover", index, data.list);
})
.on("mouseout", function (e, d) {
let index = d3.select(this).attr("index");
legendMouse("mouseout", index, data.list);
})
.on("click", function (e, d) {
let index = d3.select(this).attr("index");
legendClick(index, colors[index]);
});
if (grid_enabled) {
d3.selectAll(".svg-x-axis .tick")
.append("line")
.attr("x1", 0)
.attr("y1", 0)
.attr("x2", 0)
.attr("y2", -chartHeight)
.attr("stroke-width", 1)
.attr("stroke", "rgba(0, 0, 0, 0.2)")
.style("stroke-dasharray", "5 5");
d3.selectAll(".svg-y-axis .tick")
.append("line")
.attr("x1", 0)
.attr("y1", 0)
.attr("x2", chartWidth)
.attr("y2", 0)
.attr("stroke-width", 1)
.attr("stroke", "rgba(0, 0, 0, 0.2)")
.style("stroke-dasharray", "5 5");
}
if (auxiliary_line_enabled) {
const auxiliaryEl = svg
.append("g")
.attr("class", "svg-zero-line")
.attr(
"transform",
`translate(${left + yTitleTotalW + yAxisW}, ${top + titleTotalH})`
);
auxiliaryEl
.append("line")
.attr("class", "svg-zero-line-x")
.attr("x1", xScale(0) + 0.5)
.attr("y1", chartHeight)
.attr("x2", xScale(0) + 0.5)
.attr("y2", 0)
.attr("stroke", "rgba(0, 0, 0, 0.4)");
auxiliaryEl
.append("line")
.attr("class", "svg-zero-line-y")
.attr("x1", 0)
.attr("y1", yScale(0) + 0.5)
.attr("x2", chartWidth)
.attr("y2", yScale(0) + 0.5)
.attr("stroke", "rgba(0, 0, 0, 0.4)");
}
const groups = svg
.append("g")
.attr("class", "svg-groups")
.attr(
"transform",
`translate(${left + yTitleTotalW + yAxisW}, ${top + titleTotalH})`
);
if (plot_type === "polygon") {
groups
.append("g")
.attr("class", "svg-groups-hull")
.selectAll(".svg-groups-hull-group")
.data(data.list)
.enter()
.append("g")
.attr("fill-opacity", opacity)
.attr("fill", (d, i) => colors[i % colors.length])
.attr(
"class",
(d, i) => `svg-groups-hull-group svg-groups-hull-group${i}`
)
.append("polygon")
.attr("stroke-width", 1)
.attr("stroke", (d, i) => colors[i % colors.length])
.attr("stroke-dasharray", lineShapes[line_type])
.attr("points", (d, i) => {
let points = "";
let data = (d.line[forwardValue] || d.line[reverseValue]).hull;
let isAxisReverse = !d.line[forwardValue];
let pcaXIndex = isAxisReverse ? 1 : 0;
let pcaYIndex = isAxisReverse ? 0 : 1;
data.forEach(item => {
points += `${xScale(item[pcaXIndex])}, ${yScale(item[pcaYIndex])} `;
});
return points;
});
}
if (plot_type === "ellipse") {
groups
.append("g")
.attr("class", "svg-groups-ellipse")
.selectAll(".svg-groups-ellipse-group")
.data(data.list)
.enter()
.append("g")
.attr("fill-opacity", opacity)
.attr("fill", (d, i) => colors[i % colors.length])
.attr(
"class",
(d, i) => `svg-groups-ellipse-group svg-groups-ellipse-group${i}`
)
.append("polygon")
.attr("stroke-width", 1)
.attr("stroke", (d, i) => colors[i % colors.length])
.attr("stroke-dasharray", lineShapes[line_type])
.attr("points", (d, i) => {
let points = "";
let isAxisReverse = !d.line[forwardValue];
let pcaXIndex = isAxisReverse ? 1 : 0;
let pcaYIndex = isAxisReverse ? 0 : 1;
let data = (d.line[forwardValue] || d.line[reverseValue]).ellipse;
data.forEach(item => {
points += `${xScale(item[pcaXIndex])}, ${yScale(item[pcaYIndex])} `;
});
return points;
});
}
if (center_line_enabled) {
groups
.append("g")
.attr("class", "svg-groups-line")
.selectAll(".svg-groups-line-group")
.data(data.list)
.enter()
.append("g")
.attr("index", (d, i) => i)
.attr("stroke-opacity", 0.3)
.attr("stroke", (d, i) => colors[i % colors.length])
.attr(
"class",
(d, i) => `svg-groups-line-group svg-groups-line-group${i}`
)
.selectAll("line")
.data((d, i) => d.data)
.enter()
.append("line")
.attr("x1", (d, i, elList) => {
let index = d3.select(elList[i].parentElement).attr("index");
let centroids = data.list[index].center[0];
return xScale(centroids[xIndex]);
})
.attr("y1", (d, i, elList) => {
let index = d3.select(elList[i].parentElement).attr("index");
let centroids = data.list[index].center[0];
return yScale(centroids[yIndex]);
})
.attr("x2", d => xScale(d[xIndex + 1]))
.attr("y2", d => yScale(d[yIndex + 1]));
}
groups
.append("g")
.attr("class", "svg-groups-scatter")
.selectAll(".svg-groups-scatter-group")
.data(data.list)
.enter()
.append("g")
.attr("index", (d, i) => i)
.attr("fill", (d, i) => colors[i % colors.length])
.attr(
"class",
(d, i) =>
`svg-groups-common svg-groups-scatter-group svg-groups-scatter-group${i}`
)
.selectAll("path")
.data(d => d.data)
.enter()
.append("path")
.attr("d", (d, i, elList) => {
let index = d3.select(elList[i].parentElement).attr("index");
let group = data.list[index].group;
let type = dot_types[group] || "circle";
let symbol = d3
.symbol()
.type(symbolTypes[type])
.size(dot_size * symbolZoomTimes);
return symbol();
})
.attr(
"transform",
(d, i) => `translate(${xScale(d[xIndex + 1])}, ${yScale(d[yIndex + 1])})`
)
.on("mouseover", function (e, d) {
let index = d3.select(this.parentElement).attr("index");
d3.select(this).attr("d", (d, i) => {
let group = data.list[index].group;
let type = dot_types[group] || "circle";
let symbol = d3
.symbol()
.type(symbolTypes[type])
.size(dot_size * symbolZoomTimesHover);
return symbol();
});
tooltip({
group: data.list[index].group,
sample: d[0],
xValue: d[xIndex + 1],
yValue: d[yIndex + 1],
left: e.pageX + 15,
top: e.pageY - 27,
parentElement: this.parentElement
});
})
.on("mouseout", function (d, i, elList) {
d3.select(".scatter-tooltip").style("display", "none");
let index = d3.select(this.parentElement).attr("index");
d3.select(this).attr("d", (d, i) => {
let group = data.list[index].group;
let type = dot_types[group] || "circle";
let symbol = d3
.symbol()
.type(symbolTypes[type])
.size(dot_size * symbolZoomTimes);
return symbol();
});
});
if (isLabel) {
groups
.append("g")
.attr("class", "svg-groups-label")
.selectAll(".svg-groups-label-group")
.data(data.list)
.enter()
.append("g")
.attr(
"class",
(d, i) => `svg-groups-label-group svg-groups-label-group${i}`
)
.selectAll("text")
.data(d => {
return d.data;
})
.enter()
.append("text")
.text(d => d[0])
.attr("text-anchor", "middle")
.attr("fill", label_color)
.attr("font-size", label_size)
.attr("font-family", label_font)
.attr("x", d => xScale(d[xIndex + 1]))
.attr("y", d => yScale(d[yIndex + 1]) - dot_size);
}
if (data.metabolites && data.metabolites.length > 0) {
const selectedMetabolites = data.metabolites.slice(0, metabolites_count);
groups
.append("g")
.attr("class", "svg-groups-metabolites-lines")
.selectAll(".svg-groups-metabolites-line")
.data(selectedMetabolites)
.enter()
.append("line")
.attr("x1", xScale(0))
.attr("y1", yScale(0))
.attr("x2", d => {
let xValue;
if (x_axis_value === "PC1") xValue = d.x;
else if (x_axis_value === "PC2") xValue = d.y;
else if (x_axis_value === "PC3") xValue = d.z;
return xScale(xValue);
})
.attr("y2", d => {
let yValue;
if (y_axis_value === "PC1") yValue = d.x;
else if (y_axis_value === "PC2") yValue = d.y;
else if (y_axis_value === "PC3") yValue = d.z;
return yScale(yValue);
})
.attr("stroke", "rgba(0, 0, 0, 0.4)")
.attr("stroke-width", 1)
.attr("marker-end", "url(#lineArrow)");
const metabolitesLabelGroup = groups
.append("g")
.attr("class", "svg-groups-metabolites-label");
const drag = d3
.drag()
.on("drag", function (event, d) {
const [x, y] = d3.pointer(event, groups.node());
d3.select(this).attr("x", x).attr("y", y);
const id = d.id || (metabolites_label_type === "name" ? d.label : d.id);
draggedMetaboliteLabels.set(id, { x, y });
})
.on("end", function (event, d) {
d3.select(this)
.attr("font-weight", "normal")
.attr("fill", metabolites_text_color);
});
const metabolitesLabels = metabolitesLabelGroup
.selectAll(".svg-groups-metabolites-label-group")
.data(selectedMetabolites)
.enter()
.append("text")
.text(d =>
metabolites_label_type === "name" && d.label ? d.label : d.id
)
.attr("class", "svg-groups-metabolites-label-text")
.attr(
"data-id",
d => d.id || (metabolites_label_type === "name" ? d.label : d.id)
)
.attr("cursor", "move")
.attr("text-anchor", "start")
.attr("fill", metabolites_text_color)
.attr("font-size", metabolites_text_size)
.attr("font-family", metabolites_text_font)
.attr("x", d => {
const id = d.id || (metabolites_label_type === "name" ? d.label : d.id);
if (draggedMetaboliteLabels.has(id)) {
return draggedMetaboliteLabels.get(id).x;
}
let xValue;
if (x_axis_value === "PC1") xValue = d.x;
else if (x_axis_value === "PC2") xValue = d.y;
else if (x_axis_value === "PC3") xValue = d.z;
return xScale(xValue) + 6;
})
.attr("y", d => {
const id = d.id || (metabolites_label_type === "name" ? d.label : d.id);
if (draggedMetaboliteLabels.has(id)) {
return draggedMetaboliteLabels.get(id).y;
}
let yValue;
if (y_axis_value === "PC1") yValue = d.x;
else if (y_axis_value === "PC2") yValue = d.y;
else if (y_axis_value === "PC3") yValue = d.z;
return yScale(yValue) + 4;
});
if (metabolites_draggable) {
metabolitesLabels.call(drag);
metabolitesLabels
.on("mouseover", function () {
if (!d3.event.defaultPrevented) {
d3.select(this).attr("font-weight", "bold").attr("fill", "blue");
}
})
.on("mouseout", function () {
if (!d3.event.defaultPrevented) {
d3.select(this)
.attr("font-weight", "normal")
.attr("fill", metabolites_text_color);
}
});
}
}
};
export default pcaChart;有注释版:
import * as d3 from "d3";
import { getColorList } from "@/utils/commonMethod";
const pcaChart = (options = {}) => {
let originContainer = document.querySelector("#chart-container");
let originHeight = originContainer.offsetHeight;
let originWidth = originContainer.offsetWidth;
let height = originHeight * (options.height / 100);
let width = originWidth * (options.width / 100);
// 获取标签样式
function getSvgTextStyle({
text = "",
fontSize = 14,
fontFamily = "Arial",
fontWeight = "normal"
} = {}) {
const svg = d3
.select("body")
.append("svg")
.attr("class", "get-svg-text-style");
const textStyle = svg
.append("text")
.text(text)
.attr("font-size", fontSize)
.attr("font-family", fontFamily)
.attr("font-weight", fontWeight)
.node()
.getBBox();
svg.remove();
return {
width: textStyle.width,
height: textStyle.height
};
}
// 获取线性坐标轴宽高
function getSvgLinearAxisStyle({
fontSize = 20,
orient = "bottom",
fontFamily = "Arial",
fontWeight = "normal",
rotate = 0,
domain = [0, 9],
range = [0, 200]
} = {}) {
let axis;
let svg = d3
.select("body")
.append("svg")
.attr("width", 200)
.attr("height", 100)
.attr("transform", "translate(300, 200)")
.attr("class", "get-svg-axis-style");
let scale = d3.scaleLinear().domain(domain).range(range);
if (orient === "bottom" || orient === "top") {
axis = d3.axisBottom(scale);
} else {
axis = d3.axisLeft(scale);
}
let axisStyle = svg
.append("g")
.call(axis)
.call(g => {
g.selectAll("text")
.attr("fill", "#555")
.attr("font-size", fontSize)
.attr("font-family", fontFamily)
.attr("font-weight", fontWeight)
.attr(
"tmpY",
g.select("text").attr("tmpY") || g.select("text").attr("dy")
)
.attr(
"dy",
rotate > 70 && rotate <= 90
? "0.35em"
: rotate >= -90 && rotate < -70
? "0.4em"
: g.select("text").attr("tmpY")
)
.attr(
"text-anchor",
orient === "left"
? "end"
: rotate
? rotate > 0
? "start"
: "end"
: "middle"
)
.attr(
"transform",
`translate(0, 0) ${
rotate ? `rotate(${rotate} 0 ${g.select("text").attr("y")})` : ""
}`
);
})
.node()
.getBBox();
svg.remove();
return {
width: axisStyle.width,
height: axisStyle.height
};
}
const symbolZoomTimes = 10;
const symbolZoomTimesHover = 15;
// 散点类型
const symbolTypes = {
circle: d3.symbolCircle,
cross: d3.symbolCross,
diamond: d3.symbolDiamond,
square: d3.symbolSquare,
star: d3.symbolStar,
triangle: d3.symbolTriangle,
wye: d3.symbolWye
};
// 线条样式
const lineShapes = {
point: "2 2",
straigh_line: "0",
dash_dot: "10 10 2 2",
long_dash: "20 10 2 2",
short_straight_line: "10 10"
};
// 选择器类名
const classList = [
".svg-groups-hull-group",
".svg-groups-ellipse-group",
".svg-groups-line-group",
".svg-groups-scatter-group",
".svg-groups-label-group"
];
// pca名称列表
const pcaNameList = ["PC1", "PC2", "PC3"];
// 图例鼠标移入移出事件
function legendMouse(type, index, data = []) {
data.forEach((item, i) => {
let opacity = type === "mouseout" ? 1 : index == i ? 1 : 0.3;
let fontWeight =
type === "mouseout" ? "normal" : index == i ? "bold" : "normal";
d3.select(`.svg-legend-label-item${i}`).attr("font-weight", fontWeight);
classList.forEach(subItem => {
d3.selectAll(subItem + i).attr("opacity", opacity);
});
});
}
// 图例图表点击事件
function legendClick(index, color = "") {
let el = d3.selectAll(`.svg-groups-scatter-group${index}`);
let visibility = el.attr("visibility");
let isVisibility = visibility
? visibility === "visible"
? true
: false
: true;
d3.select(`.svg-legend-label-item${index}`).attr(
"fill",
isVisibility ? "#ccc" : "#000"
);
d3.select(`.svg-legend-path-item${index}`).attr(
"fill",
isVisibility ? "#ccc" : color
);
classList.forEach(item => {
if (isVisibility) {
el.attr("visibility", "hidden");
} else {
el.attr("visibility", "visible");
}
});
}
// tooltip
function tooltip({
group,
sample,
xValue,
yValue,
left,
top,
parentElement
}) {
if (d3.select(".scatter-tooltip").empty()) {
d3.select("body")
.append("div")
.attr("class", "scatter-tooltip")
.html(
`<div class="scatter-tooltip-group">
group: ${group}
</div>
<div class="scatter-tooltip-sample">
sample: ${sample}
</div>
<div class="scatter-tooltip-x">
X轴:${xValue}
</div>
<div class="scatter-tooltip-y">
Y轴:${yValue}
</div>
`
)
.style("position", "fixed")
.style("left", `${left}px`)
.style("top", `${top}px`)
.style("padding", "8px 5px")
.style("border-radius", "4px")
.style("font-size", "12px")
.style("color", "#555")
.style("background", "rgba(255, 255, 255, .8)")
.style("border", `1px solid ${d3.select(parentElement).attr("fill")}`);
} else {
d3.select(".scatter-tooltip")
.style("display", "block")
.style("left", `${left}px`)
.style("top", `${top}px`)
.style("border", `1px solid ${d3.select(parentElement).attr("fill")}`);
d3.select(".scatter-tooltip-group").html(`group: ${group}`);
d3.select(".scatter-tooltip-sample").html(`sample: ${sample}`);
d3.select(".scatter-tooltip-x").html(` X轴: ${xValue}`);
d3.select(".scatter-tooltip-y").html(` Y轴: ${yValue}`);
}
}
let {
container = "#biplot-container",
top = 15,
left = 20,
right = 10,
bottom = 20,
data = {},
groupList = [],
// colors = [],
plot_type = "scatter", // 散点:scatter,按组连线:polygon,置信椭圆:ellipse
dot_types = {
A: "circle",
B: "circle"
},
dot_size = 10,
opacity = 0.4,
grid_enabled = false,
border_enabled = true,
center_line_enabled = false,
auxiliary_line_enabled = false,
line_type = "straigh_line",
x_axis_value = "PC1",
y_axis_value = "PC2",
label_color = "#000",
label_font = "Arial",
label_size = 10,
isLabel = true,
main_title = "",
main_title_color = "#000",
main_title_font = "Arial",
main_title_size = 14,
x_title = "",
x_title_color = "#000",
x_title_font = "Arial",
x_title_size = 14,
x_text_color = "#000",
x_text_font = "Arial",
x_text_size = 12,
x_text_rotate = 0,
y_title = "",
y_title_color = "#000",
y_title_font = "Arial",
y_title_size = 14,
y_text_color = "#000",
y_text_font = "Arial",
y_text_size = 12,
legend_title = "",
legend_title_color = "#000",
legend_title_size = 12,
legend_title_font = "Arial",
legend_text_color = "#000",
legend_text_font = "Arial",
legend_text_size = 12,
legend_size = 7,
stress = false,
stressValue = "1111",
// 新增代谢物相关参数
metabolites = [],
metabolites_count = 5,
metabolites_text_font = "Arial",
metabolites_text_size = 12,
metabolites_text_color = "black",
metabolites_label_type = "id" // id 或 label
} = options;
// 针对多边形和椭圆
let forwardValue = `${x_axis_value}_${y_axis_value}`;
let reverseValue = `${y_axis_value}_${x_axis_value}`;
let colors = getColorList(options.color);
let newGroupcheck = [];
newGroupcheck = data.groups?.filter((item, index) => {
if (groupList.indexOf(item.group) !== -1) {
return item;
}
});
const box = document.querySelector(container);
// let width = box.clientWidth;
// let height = box.clientHeight;
if (!box || !data.list || !data.list.length) return;
if (options.data.type === "two") {
options.data.list.forEach(item => {
let lineData = item.line[forwardValue] || item.line[reverseValue];
lineData.ellipse = [];
});
}
if (options.data.type === "one") {
options.data.list.forEach(item => {
let lineData = item.line[forwardValue] || item.line[reverseValue];
lineData.hull = [];
});
}
let xIndex = pcaNameList.indexOf(x_axis_value);
let yIndex = pcaNameList.indexOf(y_axis_value);
let xCoordSet = [];
let yCoordSet = [];
data.list.forEach((item, index) => {
xCoordSet.push(item.center[0][xIndex]);
yCoordSet.push(item.center[0][yIndex]);
item.data.forEach((subItem, j) => {
xCoordSet.push(Number(subItem[xIndex + 1]));
yCoordSet.push(Number(subItem[yIndex + 1]));
});
let isAxisReverse = !item.line[forwardValue];
let pcaXIndex = isAxisReverse ? 1 : 0;
let pcaYIndex = isAxisReverse ? 0 : 1;
let pcaData = item.line[forwardValue] || item.line[reverseValue];
pcaData?.hull?.forEach((subItem, j) => {
xCoordSet.push(subItem[pcaXIndex]);
yCoordSet.push(subItem[pcaYIndex]);
});
pcaData?.ellipse?.forEach((subItem, j) => {
xCoordSet.push(subItem[pcaXIndex]);
yCoordSet.push(subItem[pcaYIndex]);
});
});
// 添加代谢物坐标到坐标集合
if (data.metabolites && data.metabolites.length > 0) {
data.metabolites.forEach(metabolite => {
// 根据轴的名称获取对应的坐标值
let xValue, yValue;
// 获取PC坐标值
if (x_axis_value === "PC1") xValue = metabolite.x;
else if (x_axis_value === "PC2") xValue = metabolite.y;
else if (x_axis_value === "PC3") xValue = metabolite.z;
if (y_axis_value === "PC1") yValue = metabolite.x;
else if (y_axis_value === "PC2") yValue = metabolite.y;
else if (y_axis_value === "PC3") yValue = metabolite.z;
xCoordSet.push(xValue);
yCoordSet.push(yValue);
});
}
const xOldMin = Math.min(...xCoordSet);
const xOldMax = Math.max(...xCoordSet);
const yOldMin = Math.min(...yCoordSet);
const yOldMax = Math.max(...yCoordSet);
// x、y作用域
const xTmpDomain = [xOldMin, xOldMax];
const yTmpDomain = [yOldMin, yOldMax];
const xTmpMin = xTmpDomain[0];
const xTmpMax = xTmpDomain[1];
const xStep = Math.abs(xTmpMax * 0.1);
const xMin = xTmpMin - xStep >= 0 ? -xStep : xTmpMin - xStep;
const xMax = xTmpMax + xStep > 0 ? xTmpMax + xStep : xStep;
const yTmpMin = yTmpDomain[0];
const yTmpMax = yTmpDomain[1];
const yStep = Math.abs(yTmpMax * 0.1);
const yMin = yTmpMin - yStep >= 0 ? -yStep : yTmpMin - yStep;
const yMax = yTmpMax + yStep > 0 ? yTmpMax + yStep : yStep;
const xDomain = [xMin, xMax];
const yDomain = [yMin, yMax];
// 主标题高度
const titleSpace = 10;
const titleH = getSvgTextStyle({
text: main_title,
fontSize: main_title_size,
fontFamily: main_title_font
}).height;
const titleTotalH = main_title ? titleH + titleSpace : 0;
// X轴及标题高度
const xTitleSpace = 10;
const xTitleH = getSvgTextStyle({
// text: x_title + `[${data.var[xIndex]}%]`,
text: data.var ? x_title + `[${data.var[xIndex]}%]` : x_title,
fontSize: x_title_size,
fontFamily: x_title_font
}).height;
const xTitleTotalH = xTitleH + xTitleSpace;
const xAxisH = getSvgLinearAxisStyle({
fontSize: x_text_size,
fontFamily: x_text_font,
rotate: x_text_rotate,
domain: xDomain
}).height;
// Y轴及标题高度
const yTitleSpace = 10;
const yTitleW = getSvgTextStyle({
// text: y_title + `[${data.var[yIndex]}%]`,
text: data.var ? y_title + `[${data.var[yIndex]}%]` : y_title,
fontSize: y_title_size,
fontFamily: y_title_font
}).height;
const yTitleTotalW = yTitleW + yTitleSpace;
const yAxisW = getSvgLinearAxisStyle({
fontSize: y_text_size,
fontFamily: y_text_font,
domain: yDomain,
orient: "left"
}).width;
// 图例宽、高、间距等
const legendList = [];
data.list.map(item => {
legendList.push({
label: item.group,
...getSvgTextStyle({
text: item.group,
fontSize: legend_text_size,
fontFamily: legend_text_font
})
});
});
// newGroupcheck.map((item) => {
// legendList.push({
// label: item.group,
// ...getSvgTextStyle({
// text: item.group,
// fontSize: legend_text_size,
// fontFamily: legend_text_font
// })
// });
// });
const legendLabelSpace = 5;
const legendBottomSpace = 8;
const legendRightSpace = 10;
const legendLeftSpace = 15;
const legendLabelH = legendList.length
? Math.max(legendList[0].height, legend_size * 2)
: 0;
const legendLabelW = d3.max(legendList, d => d.width) || 0;
const legendEachH = legendLabelH + legendBottomSpace;
const legendEachW =
legendLabelW + legend_size * 2 + legendLabelSpace + legendRightSpace;
const chartHeight =
height - top - bottom - titleTotalH - xTitleTotalH - xAxisH;
const legendStep = Math.floor(chartHeight / legendEachH);
const legendColumn = Math.ceil(legendList.length / legendStep);
const legendTotalw = legendList.length ? legendColumn * legendEachW : 0;
const chartWidth =
width -
left -
right -
yTitleTotalW -
yAxisW -
legendLeftSpace -
legendTotalw;
// x轴值映射
const xScale = d3.scaleLinear().domain(xDomain).range([0, chartWidth]);
// y轴值映射
const yScale = d3.scaleLinear().domain(yDomain).range([chartHeight, 0]);
// X轴
const xAxis = d3
.axisBottom(xScale)
.tickSizeOuter(border_enabled ? -chartHeight : 0);
// Y轴
const yAxis = d3
.axisLeft(yScale)
.tickSizeOuter(border_enabled ? -chartWidth : 0);
!d3.select(container).select("svg").empty() &&
d3.select(container).select("svg").remove();
// 创建svg
const svg = d3
.select(container)
.append("svg")
.attr("width", width)
.attr("height", height)
.attr("id", "pca-svg-container");
// 定义普通箭头标记(简单的线条箭头)
svg
.append("defs")
.append("marker")
.attr("id", "lineArrow")
.attr("viewBox", "0 0 10 10")
.attr("refX", 8)
.attr("refY", 5)
.attr("orient", "auto")
.attr("markerWidth", 6)
.attr("markerHeight", 6)
.append("path")
.attr("d", "M0,0 L10,5 L0,10 L2,5 Z") // 普通箭头形状
.attr("fill", "rgba(0, 0, 0, 0.4)");
// 创建X轴
svg
.append("g")
.attr("class", "svg-x-axis")
.attr(
"transform",
`translate(${left + yTitleTotalW + yAxisW}, ${
height - bottom - xTitleTotalH - xAxisH
})`
)
.call(xAxis)
.call(g => {
g.selectAll("text")
.attr("fill", x_text_color)
.attr("font-size", x_text_size)
.attr("font-family", x_text_font)
.attr(
"tmpY",
g.select("text").attr("tmpY") || g.select("text").attr("dy")
)
.attr(
"dy",
x_text_rotate > 70 && x_text_rotate <= 90
? "0.35em"
: x_text_rotate >= -90 && x_text_rotate < -70
? "0.4em"
: g.select("text").attr("tmpY")
)
.attr(
"text-anchor",
x_text_rotate ? (x_text_rotate > 0 ? "start" : "end") : "middle"
)
.attr(
"transform",
`translate(0, 0) ${
x_text_rotate
? `rotate(${x_text_rotate} 0 ${g.select("text").attr("y")})`
: ""
}`
);
});
// 创建Y轴
svg
.append("g")
.attr("class", "svg-y-axis")
.attr(
"transform",
`translate(${left + yTitleTotalW + yAxisW}, ${top + titleTotalH})`
)
.call(yAxis)
.call(g => {
g.selectAll("text")
.attr("fill", y_text_color)
.attr("font-size", y_text_size)
.attr("font-family", y_text_font);
});
// 主标题
svg
.append("g")
.attr("class", "svg-main-title")
.append("text")
.text(main_title)
.attr("fill", main_title_color)
.attr("font-family", main_title_font)
.attr("font-size", main_title_size)
.attr("text-anchor", "middle")
.attr("dominant-baseline", "ideographic")
.attr(
"transform",
`translate(${left + yTitleTotalW + yAxisW + chartWidth / 2}, ${
main_title ? top + titleH : 0
})`
);
//NMDS 主标题下面标识
svg
.append("g")
.attr("class", "theme-pca")
.append("text")
.text(stressValue)
.attr("x", left + yTitleTotalW + yAxisW + chartWidth / 2)
.attr("y", main_title ? top + titleH + 9 : 9)
.attr("text-anchor", "middle")
.attr("fill", "rgba(0, 0, 0, 0.6)")
.attr("font-size", 12)
.attr("visibility", stress ? "visible" : "hidden");
// X轴标题
svg
.append("g")
.attr("class", "svg-x-title")
.append("text")
// .text(x_title + ` [${data.var[xIndex]}%]`)
.text(data.var ? x_title + ` [${data.var[xIndex]}%]` : x_title)
.attr("fill", x_title_color)
.attr("font-family", x_title_font)
.attr("font-size", x_title_size)
.attr("text-anchor", "middle")
.attr("dominant-baseline", "hanging")
.attr(
"transform",
`translate(${left + yTitleTotalW + yAxisW + chartWidth / 2}, ${
height - bottom - xTitleH
})`
);
// Y轴标题
svg
.append("g")
.attr("class", "svg-y-title")
.append("text")
// .text(y_title + ` [${data.var[yIndex]}%]`)
.text(data.var ? y_title + ` [${data.var[yIndex]}%]` : y_title)
.attr("fill", y_title_color)
.attr("font-family", y_title_font)
.attr("font-size", y_title_size)
.attr("text-anchor", "middle")
.attr("dominant-baseline", "hanging")
.attr(
"transform",
`translate(${left}, ${top + titleH + chartHeight / 2}) rotate(-90)`
);
// 图例
const legendEl = svg
.append("g")
.attr("cursor", "pointer")
.attr("class", "svg-legend")
.attr(
"transform",
`translate(${width - right - legendTotalw}, ${top + titleTotalH})`
);
// 图例icon
legendEl
.append("g")
.attr("class", "svg-legend-path")
.selectAll("path")
.data(legendList)
.enter()
.append("path")
.attr("index", (d, i) => i)
.attr("class", (d, i) => `svg-legend-path-item svg-legend-path-item${i}`)
.attr("fill", (d, i) => colors[i % colors.length])
.attr("d", (d, i) => {
let group = data.list[i].group;
let type = dot_types[group] || "circle";
let symbol = d3
.symbol()
.type(symbolTypes[type])
.size(legend_size * symbolZoomTimes);
return symbol();
})
.attr("transform", (d, i) => {
let times = Math.floor(i / legendStep);
return `translate(${legend_size + legendEachW * times}, ${
legendLabelH / 2 + (legendLabelH + legendBottomSpace) * (i % legendStep)
})`;
})
.on("mouseover", function (e, d) {
let index = d3.select(this).attr("index");
legendMouse("mouseover", index, data.list);
})
.on("mouseout", function (e, d) {
let index = d3.select(this).attr("index");
legendMouse("mouseout", index, data.list);
})
.on("click", function (e, d) {
let index = d3.select(this).attr("index");
legendClick(index, colors[index]);
});
// 图例标签
legendEl
.append("g")
.attr("class", "svg-legend-label")
.selectAll("text")
.data(legendList)
.enter()
.append("text")
.text(d => d.label)
.attr("index", (d, i) => i)
.attr("fill", legend_text_color)
.attr("font-size", legend_text_size)
.attr("font-family", legend_text_font)
.attr("dominant-baseline", "central")
.attr("class", (d, i) => `svg-legend-label-item svg-legend-label-item${i}`)
.attr("transform", (d, i) => {
let times = Math.floor(i / legendStep);
return `translate(${
legend_size * 2 + legendLabelSpace + legendEachW * times
}, ${
legendLabelH / 2 + (legendLabelH + legendBottomSpace) * (i % legendStep)
})`;
})
.on("mouseover", function (e, d) {
let index = d3.select(this).attr("index");
legendMouse("mouseover", index, data.list);
})
.on("mouseout", function (e, d) {
let index = d3.select(this).attr("index");
legendMouse("mouseout", index, data.list);
})
.on("click", function (e, d) {
let index = d3.select(this).attr("index");
legendClick(index, colors[index]);
});
if (grid_enabled) {
// 网格线Y轴
d3.selectAll(".svg-x-axis .tick")
.append("line")
.attr("x1", 0)
.attr("y1", 0)
.attr("x2", 0)
.attr("y2", -chartHeight)
.attr("stroke-width", 1)
.attr("stroke", "rgba(0, 0, 0, 0.2)")
.style("stroke-dasharray", "5 5");
d3.selectAll(".svg-y-axis .tick")
.append("line")
.attr("x1", 0)
.attr("y1", 0)
.attr("x2", chartWidth)
.attr("y2", 0)
.attr("stroke-width", 1)
.attr("stroke", "rgba(0, 0, 0, 0.2)")
.style("stroke-dasharray", "5 5");
}
// 原点辅助线
if (auxiliary_line_enabled) {
const auxiliaryEl = svg
.append("g")
.attr("class", "svg-zero-line")
.attr(
"transform",
`translate(${left + yTitleTotalW + yAxisW}, ${top + titleTotalH})`
);
auxiliaryEl
.append("line")
.attr("class", "svg-zero-line-x")
.attr("x1", xScale(0) + 0.5)
.attr("y1", chartHeight)
.attr("x2", xScale(0) + 0.5)
.attr("y2", 0)
.attr("stroke", "rgba(0, 0, 0, 0.4)");
auxiliaryEl
.append("line")
.attr("class", "svg-zero-line-y")
.attr("x1", 0)
.attr("y1", yScale(0) + 0.5)
.attr("x2", chartWidth)
.attr("y2", yScale(0) + 0.5)
.attr("stroke", "rgba(0, 0, 0, 0.4)");
}
// 绘图区
const groups = svg
.append("g")
.attr("class", "svg-groups")
.attr(
"transform",
`translate(${left + yTitleTotalW + yAxisW}, ${top + titleTotalH})`
);
// 多边形(按组连线)
if (plot_type === "polygon") {
groups
.append("g")
.attr("class", "svg-groups-hull")
.selectAll(".svg-groups-hull-group")
.data(data.list)
.enter()
.append("g")
.attr("fill-opacity", opacity)
.attr("fill", (d, i) => colors[i % colors.length])
.attr(
"class",
(d, i) => `svg-groups-hull-group svg-groups-hull-group${i}`
)
.append("polygon")
.attr("stroke-width", 1)
.attr("stroke", (d, i) => colors[i % colors.length])
.attr("stroke-dasharray", lineShapes[line_type])
.attr("points", (d, i) => {
let points = "";
let data = (d.line[forwardValue] || d.line[reverseValue]).hull;
let isAxisReverse = !d.line[forwardValue];
let pcaXIndex = isAxisReverse ? 1 : 0;
let pcaYIndex = isAxisReverse ? 0 : 1;
data.forEach(item => {
points += `${xScale(item[pcaXIndex])}, ${yScale(item[pcaYIndex])} `;
});
return points;
});
}
// 椭圆
if (plot_type === "ellipse") {
groups
.append("g")
.attr("class", "svg-groups-ellipse")
.selectAll(".svg-groups-ellipse-group")
.data(data.list)
.enter()
.append("g")
.attr("fill-opacity", opacity)
.attr("fill", (d, i) => colors[i % colors.length])
.attr(
"class",
(d, i) => `svg-groups-ellipse-group svg-groups-ellipse-group${i}`
)
.append("polygon")
.attr("stroke-width", 1)
.attr("stroke", (d, i) => colors[i % colors.length])
.attr("stroke-dasharray", lineShapes[line_type])
.attr("points", (d, i) => {
let points = "";
let isAxisReverse = !d.line[forwardValue];
let pcaXIndex = isAxisReverse ? 1 : 0;
let pcaYIndex = isAxisReverse ? 0 : 1;
let data = (d.line[forwardValue] || d.line[reverseValue]).ellipse;
data.forEach(item => {
points += `${xScale(item[pcaXIndex])}, ${yScale(item[pcaYIndex])} `;
});
return points;
});
}
// 中心点连线
if (center_line_enabled) {
groups
.append("g")
.attr("class", "svg-groups-line")
.selectAll(".svg-groups-line-group")
.data(data.list)
// .data(newGroupcheck)
.enter()
.append("g")
.attr("index", (d, i) => i)
.attr("stroke-opacity", 0.3)
.attr("stroke", (d, i) => colors[i % colors.length])
.attr(
"class",
(d, i) => `svg-groups-line-group svg-groups-line-group${i}`
)
.selectAll("line")
.data((d, i) => d.data)
.enter()
.append("line")
.attr("x1", (d, i, elList) => {
let index = d3.select(elList[i].parentElement).attr("index");
let centroids = data.list[index].center[0];
return xScale(centroids[xIndex]);
})
.attr("y1", (d, i, elList) => {
let index = d3.select(elList[i].parentElement).attr("index");
let centroids = data.list[index].center[0];
return yScale(centroids[yIndex]);
})
.attr("x2", d => xScale(d[xIndex + 1]))
.attr("y2", d => yScale(d[yIndex + 1]));
}
// 散点
groups
.append("g")
.attr("class", "svg-groups-scatter")
.selectAll(".svg-groups-scatter-group")
.data(data.list)
.enter()
.append("g")
.attr("index", (d, i) => i)
.attr("fill", (d, i) => colors[i % colors.length])
.attr(
"class",
(d, i) =>
`svg-groups-common svg-groups-scatter-group svg-groups-scatter-group${i}`
)
.selectAll("path")
.data(d => d.data)
.enter()
.append("path")
.attr("d", (d, i, elList) => {
let index = d3.select(elList[i].parentElement).attr("index");
let group = data.list[index].group;
let type = dot_types[group] || "circle";
let symbol = d3
.symbol()
.type(symbolTypes[type])
.size(dot_size * symbolZoomTimes);
return symbol();
})
.attr(
"transform",
(d, i) => `translate(${xScale(d[xIndex + 1])}, ${yScale(d[yIndex + 1])})`
)
.on("mouseover", function (e, d) {
let index = d3.select(this.parentElement).attr("index");
d3.select(this).attr("d", (d, i) => {
let group = data.list[index].group;
let type = dot_types[group] || "circle";
let symbol = d3
.symbol()
.type(symbolTypes[type])
.size(dot_size * symbolZoomTimesHover);
return symbol();
});
tooltip({
group: data.list[index].group,
sample: d[0],
xValue: d[xIndex + 1],
yValue: d[yIndex + 1],
left: e.pageX + 15,
top: e.pageY - 27,
parentElement: this.parentElement
});
})
.on("mouseout", function (d, i, elList) {
d3.select(".scatter-tooltip").style("display", "none");
let index = d3.select(this.parentElement).attr("index");
d3.select(this).attr("d", (d, i) => {
let group = data.list[index].group;
let type = dot_types[group] || "circle";
let symbol = d3
.symbol()
.type(symbolTypes[type])
.size(dot_size * symbolZoomTimes);
return symbol();
});
});
if (isLabel) {
groups
.append("g")
.attr("class", "svg-groups-label")
.selectAll(".svg-groups-label-group")
.data(data.list)
.enter()
.append("g")
.attr(
"class",
(d, i) => `svg-groups-label-group svg-groups-label-group${i}`
)
.selectAll("text")
.data(d => {
return d.data;
})
.enter()
.append("text")
.text(d => d[0])
.attr("text-anchor", "middle")
.attr("fill", label_color)
.attr("font-size", label_size)
.attr("font-family", label_font)
.attr("x", d => xScale(d[xIndex + 1]))
.attr("y", d => yScale(d[yIndex + 1]) - dot_size);
}
// 绘制代谢物
if (data.metabolites && data.metabolites.length > 0) {
// 只显示前 metabolites_count 个代谢物
const selectedMetabolites = data.metabolites.slice(0, metabolites_count);
// 绘制代谢物与原点的连线(带普通箭头)
groups
.append("g")
.attr("class", "svg-groups-metabolites-lines")
.selectAll(".svg-groups-metabolites-line")
.data(selectedMetabolites)
.enter()
.append("line")
.attr("x1", xScale(0)) // 原点X坐标
.attr("y1", yScale(0)) // 原点Y坐标
.attr("x2", d => {
// 根据x轴名称获取对应的坐标值
let xValue;
if (x_axis_value === "PC1") xValue = d.x;
else if (x_axis_value === "PC2") xValue = d.y;
else if (x_axis_value === "PC3") xValue = d.z;
return xScale(xValue);
})
.attr("y2", d => {
// 根据y轴名称获取对应的坐标值
let yValue;
if (y_axis_value === "PC1") yValue = d.x;
else if (y_axis_value === "PC2") yValue = d.y;
else if (y_axis_value === "PC3") yValue = d.z;
return yScale(yValue);
})
.attr("stroke", "rgba(0, 0, 0, 0.4)")
.attr("stroke-width", 1)
.attr("marker-end", "url(#lineArrow)"); // 添加普通箭头
// 绘制代谢物标签(根据 metabolites_label_type 选择显示 id 或 label
groups
.append("g")
.attr("class", "svg-groups-metabolites-label")
.selectAll(".svg-groups-metabolites-label-group")
.data(selectedMetabolites)
.enter()
.append("text")
.text(d =>
metabolites_label_type === "name" && d.label ? d.label : d.id
) // 显示label或id
.attr("text-anchor", "start")
.attr("fill", metabolites_text_color)
.attr("font-size", metabolites_text_size)
.attr("font-family", metabolites_text_font)
.attr("x", d => {
// 根据x轴名称获取对应的坐标值
let xValue;
if (x_axis_value === "PC1") xValue = d.x;
else if (x_axis_value === "PC2") xValue = d.y;
else if (x_axis_value === "PC3") xValue = d.z;
return xScale(xValue) + 6;
})
.attr("y", d => {
// 根据y轴名称获取对应的坐标值
let yValue;
if (y_axis_value === "PC1") yValue = d.x;
else if (y_axis_value === "PC2") yValue = d.y;
else if (y_axis_value === "PC3") yValue = d.z;
return yScale(yValue) + 4;
});
}
};
export default pcaChart;新增拖拽注释:
import * as d3 from "d3";
import { getColorList } from "@/utils/commonMethod";
const pcaChart = (options = {}) => {
let originContainer = document.querySelector("#chart-container");
let originHeight = originContainer.offsetHeight;
let originWidth = originContainer.offsetWidth;
let height = originHeight * (options.height / 100);
let width = originWidth * (options.width / 100);
// 添加存储拖拽状态的变量
let draggedMetaboliteLabels = new Map();
let currentSvg = null;
function getSvgTextStyle({
text = "",
fontSize = 14,
fontFamily = "Arial",
fontWeight = "normal"
} = {}) {
const svg = d3
.select("body")
.append("svg")
.attr("class", "get-svg-text-style");
const textStyle = svg
.append("text")
.text(text)
.attr("font-size", fontSize)
.attr("font-family", fontFamily)
.attr("font-weight", fontWeight)
.node()
.getBBox();
svg.remove();
return {
width: textStyle.width,
height: textStyle.height
};
}
function getSvgLinearAxisStyle({
fontSize = 20,
orient = "bottom",
fontFamily = "Arial",
fontWeight = "normal",
rotate = 0,
domain = [0, 9],
range = [0, 200]
} = {}) {
let axis;
let svg = d3
.select("body")
.append("svg")
.attr("width", 200)
.attr("height", 100)
.attr("transform", "translate(300, 200)")
.attr("class", "get-svg-axis-style");
let scale = d3.scaleLinear().domain(domain).range(range);
if (orient === "bottom" || orient === "top") {
axis = d3.axisBottom(scale);
} else {
axis = d3.axisLeft(scale);
}
let axisStyle = svg
.append("g")
.call(axis)
.call(g => {
g.selectAll("text")
.attr("fill", "#555")
.attr("font-size", fontSize)
.attr("font-family", fontFamily)
.attr("font-weight", fontWeight)
.attr(
"tmpY",
g.select("text").attr("tmpY") || g.select("text").attr("dy")
)
.attr(
"dy",
rotate > 70 && rotate <= 90
? "0.35em"
: rotate >= -90 && rotate < -70
? "0.4em"
: g.select("text").attr("tmpY")
)
.attr(
"text-anchor",
orient === "left"
? "end"
: rotate
? rotate > 0
? "start"
: "end"
: "middle"
)
.attr(
"transform",
`translate(0, 0) ${
rotate ? `rotate(${rotate} 0 ${g.select("text").attr("y")})` : ""
}`
);
})
.node()
.getBBox();
svg.remove();
return {
width: axisStyle.width,
height: axisStyle.height
};
}
const symbolZoomTimes = 10;
const symbolZoomTimesHover = 15;
const symbolTypes = {
circle: d3.symbolCircle,
cross: d3.symbolCross,
diamond: d3.symbolDiamond,
square: d3.symbolSquare,
star: d3.symbolStar,
triangle: d3.symbolTriangle,
wye: d3.symbolWye
};
const lineShapes = {
point: "2 2",
straigh_line: "0",
dash_dot: "10 10 2 2",
long_dash: "20 10 2 2",
short_straight_line: "10 10"
};
const classList = [
".svg-groups-hull-group",
".svg-groups-ellipse-group",
".svg-groups-line-group",
".svg-groups-scatter-group",
".svg-groups-label-group"
];
const pcaNameList = ["PC1", "PC2", "PC3"];
function legendMouse(type, index, data = []) {
data.forEach((item, i) => {
let opacity = type === "mouseout" ? 1 : index == i ? 1 : 0.3;
let fontWeight =
type === "mouseout" ? "normal" : index == i ? "bold" : "normal";
d3.select(`.svg-legend-label-item${i}`).attr("font-weight", fontWeight);
classList.forEach(subItem => {
d3.selectAll(subItem + i).attr("opacity", opacity);
});
});
}
function legendClick(index, color = "") {
let el = d3.selectAll(`.svg-groups-scatter-group${index}`);
let visibility = el.attr("visibility");
let isVisibility = visibility
? visibility === "visible"
? true
: false
: true;
d3.select(`.svg-legend-label-item${index}`).attr(
"fill",
isVisibility ? "#ccc" : "#000"
);
d3.select(`.svg-legend-path-item${index}`).attr(
"fill",
isVisibility ? "#ccc" : color
);
classList.forEach(item => {
if (isVisibility) {
el.attr("visibility", "hidden");
} else {
el.attr("visibility", "visible");
}
});
}
function tooltip({
group,
sample,
xValue,
yValue,
left,
top,
parentElement
}) {
if (d3.select(".scatter-tooltip").empty()) {
d3.select("body")
.append("div")
.attr("class", "scatter-tooltip")
.html(
`<div class="scatter-tooltip-group">
group: ${group}
</div>
<div class="scatter-tooltip-sample">
sample: ${sample}
</div>
<div class="scatter-tooltip-x">
X轴:${xValue}
</div>
<div class="scatter-tooltip-y">
Y轴:${yValue}
</div>
`
)
.style("position", "fixed")
.style("left", `${left}px`)
.style("top", `${top}px`)
.style("padding", "8px 5px")
.style("border-radius", "4px")
.style("font-size", "12px")
.style("color", "#555")
.style("background", "rgba(255, 255, 255, .8)")
.style("border", `1px solid ${d3.select(parentElement).attr("fill")}`);
} else {
d3.select(".scatter-tooltip")
.style("display", "block")
.style("left", `${left}px`)
.style("top", `${top}px`)
.style("border", `1px solid ${d3.select(parentElement).attr("fill")}`);
d3.select(".scatter-tooltip-group").html(`group: ${group}`);
d3.select(".scatter-tooltip-sample").html(`sample: ${sample}`);
d3.select(".scatter-tooltip-x").html(` X轴: ${xValue}`);
d3.select(".scatter-tooltip-y").html(` Y轴: ${yValue}`);
}
}
let {
container = "#biplot-container",
top = 15,
left = 20,
right = 10,
bottom = 20,
data = {},
groupList = [],
plot_type = "scatter",
dot_types = {
A: "circle",
B: "circle"
},
dot_size = 10,
opacity = 0.4,
grid_enabled = false,
border_enabled = true,
center_line_enabled = false,
auxiliary_line_enabled = false,
line_type = "straigh_line",
x_axis_value = "PC1",
y_axis_value = "PC2",
label_color = "#000",
label_font = "Arial",
label_size = 10,
isLabel = true,
main_title = "",
main_title_color = "#000",
main_title_font = "Arial",
main_title_size = 14,
x_title = "",
x_title_color = "#000",
x_title_font = "Arial",
x_title_size = 14,
x_text_color = "#000",
x_text_font = "Arial",
x_text_size = 12,
x_text_rotate = 0,
y_title = "",
y_title_color = "#000",
y_title_font = "Arial",
y_title_size = 14,
y_text_color = "#000",
y_text_font = "Arial",
y_text_size = 12,
legend_title = "",
legend_title_color = "#000",
legend_title_size = 12,
legend_title_font = "Arial",
legend_text_color = "#000",
legend_text_font = "Arial",
legend_text_size = 12,
legend_size = 7,
stress = false,
stressValue = "1111",
metabolites = [],
metabolites_count = 5,
metabolites_text_font = "Arial",
metabolites_text_size = 12,
metabolites_text_color = "black",
metabolites_label_type = "id",
// 添加拖拽相关配置
metabolites_draggable = true // 是否启用拖拽功能
} = options;
let forwardValue = `${x_axis_value}_${y_axis_value}`;
let reverseValue = `${y_axis_value}_${x_axis_value}`;
let colors = getColorList(options.color);
let newGroupcheck = [];
newGroupcheck = data.groups?.filter((item, index) => {
if (groupList.indexOf(item.group) !== -1) {
return item;
}
});
const box = document.querySelector(container);
if (!box || !data.list || !data.list.length) return;
if (options.data.type === "two") {
options.data.list.forEach(item => {
let lineData = item.line[forwardValue] || item.line[reverseValue];
lineData.ellipse = [];
});
}
if (options.data.type === "one") {
options.data.list.forEach(item => {
let lineData = item.line[forwardValue] || item.line[reverseValue];
lineData.hull = [];
});
}
let xIndex = pcaNameList.indexOf(x_axis_value);
let yIndex = pcaNameList.indexOf(y_axis_value);
let xCoordSet = [];
let yCoordSet = [];
data.list.forEach((item, index) => {
xCoordSet.push(item.center[0][xIndex]);
yCoordSet.push(item.center[0][yIndex]);
item.data.forEach((subItem, j) => {
xCoordSet.push(Number(subItem[xIndex + 1]));
yCoordSet.push(Number(subItem[yIndex + 1]));
});
let isAxisReverse = !item.line[forwardValue];
let pcaXIndex = isAxisReverse ? 1 : 0;
let pcaYIndex = isAxisReverse ? 0 : 1;
let pcaData = item.line[forwardValue] || item.line[reverseValue];
pcaData?.hull?.forEach((subItem, j) => {
xCoordSet.push(subItem[pcaXIndex]);
yCoordSet.push(subItem[pcaYIndex]);
});
pcaData?.ellipse?.forEach((subItem, j) => {
xCoordSet.push(subItem[pcaXIndex]);
yCoordSet.push(subItem[pcaYIndex]);
});
});
if (data.metabolites && data.metabolites.length > 0) {
data.metabolites.forEach(metabolite => {
let xValue, yValue;
if (x_axis_value === "PC1") xValue = metabolite.x;
else if (x_axis_value === "PC2") xValue = metabolite.y;
else if (x_axis_value === "PC3") xValue = metabolite.z;
if (y_axis_value === "PC1") yValue = metabolite.x;
else if (y_axis_value === "PC2") yValue = metabolite.y;
else if (y_axis_value === "PC3") yValue = metabolite.z;
xCoordSet.push(xValue);
yCoordSet.push(yValue);
});
}
const xOldMin = Math.min(...xCoordSet);
const xOldMax = Math.max(...xCoordSet);
const yOldMin = Math.min(...yCoordSet);
const yOldMax = Math.max(...yCoordSet);
const xTmpDomain = [xOldMin, xOldMax];
const yTmpDomain = [yOldMin, yOldMax];
const xTmpMin = xTmpDomain[0];
const xTmpMax = xTmpDomain[1];
const xStep = Math.abs(xTmpMax * 0.1);
const xMin = xTmpMin - xStep >= 0 ? -xStep : xTmpMin - xStep;
const xMax = xTmpMax + xStep > 0 ? xTmpMax + xStep : xStep;
const yTmpMin = yTmpDomain[0];
const yTmpMax = yTmpDomain[1];
const yStep = Math.abs(yTmpMax * 0.1);
const yMin = yTmpMin - yStep >= 0 ? -yStep : yTmpMin - yStep;
const yMax = yTmpMax + yStep > 0 ? yTmpMax + yStep : yStep;
const xDomain = [xMin, xMax];
const yDomain = [yMin, yMax];
const titleSpace = 10;
const titleH = getSvgTextStyle({
text: main_title,
fontSize: main_title_size,
fontFamily: main_title_font
}).height;
const titleTotalH = main_title ? titleH + titleSpace : 0;
const xTitleSpace = 10;
const xTitleH = getSvgTextStyle({
text: data.var ? x_title + `[${data.var[xIndex]}%]` : x_title,
fontSize: x_title_size,
fontFamily: x_title_font
}).height;
const xTitleTotalH = xTitleH + xTitleSpace;
const xAxisH = getSvgLinearAxisStyle({
fontSize: x_text_size,
fontFamily: x_text_font,
rotate: x_text_rotate,
domain: xDomain
}).height;
const yTitleSpace = 10;
const yTitleW = getSvgTextStyle({
text: data.var ? y_title + `[${data.var[yIndex]}%]` : y_title,
fontSize: y_title_size,
fontFamily: y_title_font
}).height;
const yTitleTotalW = yTitleW + yTitleSpace;
const yAxisW = getSvgLinearAxisStyle({
fontSize: y_text_size,
fontFamily: y_text_font,
domain: yDomain,
orient: "left"
}).width;
const legendList = [];
data.list.map(item => {
legendList.push({
label: item.group,
...getSvgTextStyle({
text: item.group,
fontSize: legend_text_size,
fontFamily: legend_text_font
})
});
});
const legendLabelSpace = 5;
const legendBottomSpace = 8;
const legendRightSpace = 10;
const legendLeftSpace = 15;
const legendLabelH = legendList.length
? Math.max(legendList[0].height, legend_size * 2)
: 0;
const legendLabelW = d3.max(legendList, d => d.width) || 0;
const legendEachH = legendLabelH + legendBottomSpace;
const legendEachW =
legendLabelW + legend_size * 2 + legendLabelSpace + legendRightSpace;
const chartHeight =
height - top - bottom - titleTotalH - xTitleTotalH - xAxisH;
const legendStep = Math.floor(chartHeight / legendEachH);
const legendColumn = Math.ceil(legendList.length / legendStep);
const legendTotalw = legendList.length ? legendColumn * legendEachW : 0;
const chartWidth =
width -
left -
right -
yTitleTotalW -
yAxisW -
legendLeftSpace -
legendTotalw;
const xScale = d3.scaleLinear().domain(xDomain).range([0, chartWidth]);
const yScale = d3.scaleLinear().domain(yDomain).range([chartHeight, 0]);
const xAxis = d3
.axisBottom(xScale)
.tickSizeOuter(border_enabled ? -chartHeight : 0);
const yAxis = d3
.axisLeft(yScale)
.tickSizeOuter(border_enabled ? -chartWidth : 0);
!d3.select(container).select("svg").empty() &&
d3.select(container).select("svg").remove();
const svg = d3
.select(container)
.append("svg")
.attr("width", width)
.attr("height", height)
.attr("id", "pca-svg-container");
currentSvg = svg;
svg
.append("defs")
.append("marker")
.attr("id", "lineArrow")
.attr("viewBox", "0 0 10 10")
.attr("refX", 8)
.attr("refY", 5)
.attr("orient", "auto")
.attr("markerWidth", 6)
.attr("markerHeight", 6)
.append("path")
.attr("d", "M0,0 L10,5 L0,10 L2,5 Z")
.attr("fill", "rgba(0, 0, 0, 0.4)");
svg
.append("g")
.attr("class", "svg-x-axis")
.attr(
"transform",
`translate(${left + yTitleTotalW + yAxisW}, ${
height - bottom - xTitleTotalH - xAxisH
})`
)
.call(xAxis)
.call(g => {
g.selectAll("text")
.attr("fill", x_text_color)
.attr("font-size", x_text_size)
.attr("font-family", x_text_font)
.attr(
"tmpY",
g.select("text").attr("tmpY") || g.select("text").attr("dy")
)
.attr(
"dy",
x_text_rotate > 70 && x_text_rotate <= 90
? "0.35em"
: x_text_rotate >= -90 && x_text_rotate < -70
? "0.4em"
: g.select("text").attr("tmpY")
)
.attr(
"text-anchor",
x_text_rotate ? (x_text_rotate > 0 ? "start" : "end") : "middle"
)
.attr(
"transform",
`translate(0, 0) ${
x_text_rotate
? `rotate(${x_text_rotate} 0 ${g.select("text").attr("y")})`
: ""
}`
);
});
svg
.append("g")
.attr("class", "svg-y-axis")
.attr(
"transform",
`translate(${left + yTitleTotalW + yAxisW}, ${top + titleTotalH})`
)
.call(yAxis)
.call(g => {
g.selectAll("text")
.attr("fill", y_text_color)
.attr("font-size", y_text_size)
.attr("font-family", y_text_font);
});
svg
.append("g")
.attr("class", "svg-main-title")
.append("text")
.text(main_title)
.attr("fill", main_title_color)
.attr("font-family", main_title_font)
.attr("font-size", main_title_size)
.attr("text-anchor", "middle")
.attr("dominant-baseline", "ideographic")
.attr(
"transform",
`translate(${left + yTitleTotalW + yAxisW + chartWidth / 2}, ${
main_title ? top + titleH : 0
})`
);
svg
.append("g")
.attr("class", "theme-pca")
.append("text")
.text(stressValue)
.attr("x", left + yTitleTotalW + yAxisW + chartWidth / 2)
.attr("y", main_title ? top + titleH + 9 : 9)
.attr("text-anchor", "middle")
.attr("fill", "rgba(0, 0, 0, 0.6)")
.attr("font-size", 12)
.attr("visibility", stress ? "visible" : "hidden");
svg
.append("g")
.attr("class", "svg-x-title")
.append("text")
.text(data.var ? x_title + ` [${data.var[xIndex]}%]` : x_title)
.attr("fill", x_title_color)
.attr("font-family", x_title_font)
.attr("font-size", x_title_size)
.attr("text-anchor", "middle")
.attr("dominant-baseline", "hanging")
.attr(
"transform",
`translate(${left + yTitleTotalW + yAxisW + chartWidth / 2}, ${
height - bottom - xTitleH
})`
);
svg
.append("g")
.attr("class", "svg-y-title")
.append("text")
.text(data.var ? y_title + ` [${data.var[yIndex]}%]` : y_title)
.attr("fill", y_title_color)
.attr("font-family", y_title_font)
.attr("font-size", y_title_size)
.attr("text-anchor", "middle")
.attr("dominant-baseline", "hanging")
.attr(
"transform",
`translate(${left}, ${top + titleH + chartHeight / 2}) rotate(-90)`
);
const legendEl = svg
.append("g")
.attr("cursor", "pointer")
.attr("class", "svg-legend")
.attr(
"transform",
`translate(${width - right - legendTotalw}, ${top + titleTotalH})`
);
legendEl
.append("g")
.attr("class", "svg-legend-path")
.selectAll("path")
.data(legendList)
.enter()
.append("path")
.attr("index", (d, i) => i)
.attr("class", (d, i) => `svg-legend-path-item svg-legend-path-item${i}`)
.attr("fill", (d, i) => colors[i % colors.length])
.attr("d", (d, i) => {
let group = data.list[i].group;
let type = dot_types[group] || "circle";
let symbol = d3
.symbol()
.type(symbolTypes[type])
.size(legend_size * symbolZoomTimes);
return symbol();
})
.attr("transform", (d, i) => {
let times = Math.floor(i / legendStep);
return `translate(${legend_size + legendEachW * times}, ${
legendLabelH / 2 + (legendLabelH + legendBottomSpace) * (i % legendStep)
})`;
})
.on("mouseover", function (e, d) {
let index = d3.select(this).attr("index");
legendMouse("mouseover", index, data.list);
})
.on("mouseout", function (e, d) {
let index = d3.select(this).attr("index");
legendMouse("mouseout", index, data.list);
})
.on("click", function (e, d) {
let index = d3.select(this).attr("index");
legendClick(index, colors[index]);
});
legendEl
.append("g")
.attr("class", "svg-legend-label")
.selectAll("text")
.data(legendList)
.enter()
.append("text")
.text(d => d.label)
.attr("index", (d, i) => i)
.attr("fill", legend_text_color)
.attr("font-size", legend_text_size)
.attr("font-family", legend_text_font)
.attr("dominant-baseline", "central")
.attr("class", (d, i) => `svg-legend-label-item svg-legend-label-item${i}`)
.attr("transform", (d, i) => {
let times = Math.floor(i / legendStep);
return `translate(${
legend_size * 2 + legendLabelSpace + legendEachW * times
}, ${
legendLabelH / 2 + (legendLabelH + legendBottomSpace) * (i % legendStep)
})`;
})
.on("mouseover", function (e, d) {
let index = d3.select(this).attr("index");
legendMouse("mouseover", index, data.list);
})
.on("mouseout", function (e, d) {
let index = d3.select(this).attr("index");
legendMouse("mouseout", index, data.list);
})
.on("click", function (e, d) {
let index = d3.select(this).attr("index");
legendClick(index, colors[index]);
});
if (grid_enabled) {
d3.selectAll(".svg-x-axis .tick")
.append("line")
.attr("x1", 0)
.attr("y1", 0)
.attr("x2", 0)
.attr("y2", -chartHeight)
.attr("stroke-width", 1)
.attr("stroke", "rgba(0, 0, 0, 0.2)")
.style("stroke-dasharray", "5 5");
d3.selectAll(".svg-y-axis .tick")
.append("line")
.attr("x1", 0)
.attr("y1", 0)
.attr("x2", chartWidth)
.attr("y2", 0)
.attr("stroke-width", 1)
.attr("stroke", "rgba(0, 0, 0, 0.2)")
.style("stroke-dasharray", "5 5");
}
if (auxiliary_line_enabled) {
const auxiliaryEl = svg
.append("g")
.attr("class", "svg-zero-line")
.attr(
"transform",
`translate(${left + yTitleTotalW + yAxisW}, ${top + titleTotalH})`
);
auxiliaryEl
.append("line")
.attr("class", "svg-zero-line-x")
.attr("x1", xScale(0) + 0.5)
.attr("y1", chartHeight)
.attr("x2", xScale(0) + 0.5)
.attr("y2", 0)
.attr("stroke", "rgba(0, 0, 0, 0.4)");
auxiliaryEl
.append("line")
.attr("class", "svg-zero-line-y")
.attr("x1", 0)
.attr("y1", yScale(0) + 0.5)
.attr("x2", chartWidth)
.attr("y2", yScale(0) + 0.5)
.attr("stroke", "rgba(0, 0, 0, 0.4)");
}
const groups = svg
.append("g")
.attr("class", "svg-groups")
.attr(
"transform",
`translate(${left + yTitleTotalW + yAxisW}, ${top + titleTotalH})`
);
if (plot_type === "polygon") {
groups
.append("g")
.attr("class", "svg-groups-hull")
.selectAll(".svg-groups-hull-group")
.data(data.list)
.enter()
.append("g")
.attr("fill-opacity", opacity)
.attr("fill", (d, i) => colors[i % colors.length])
.attr(
"class",
(d, i) => `svg-groups-hull-group svg-groups-hull-group${i}`
)
.append("polygon")
.attr("stroke-width", 1)
.attr("stroke", (d, i) => colors[i % colors.length])
.attr("stroke-dasharray", lineShapes[line_type])
.attr("points", (d, i) => {
let points = "";
let data = (d.line[forwardValue] || d.line[reverseValue]).hull;
let isAxisReverse = !d.line[forwardValue];
let pcaXIndex = isAxisReverse ? 1 : 0;
let pcaYIndex = isAxisReverse ? 0 : 1;
data.forEach(item => {
points += `${xScale(item[pcaXIndex])}, ${yScale(item[pcaYIndex])} `;
});
return points;
});
}
if (plot_type === "ellipse") {
groups
.append("g")
.attr("class", "svg-groups-ellipse")
.selectAll(".svg-groups-ellipse-group")
.data(data.list)
.enter()
.append("g")
.attr("fill-opacity", opacity)
.attr("fill", (d, i) => colors[i % colors.length])
.attr(
"class",
(d, i) => `svg-groups-ellipse-group svg-groups-ellipse-group${i}`
)
.append("polygon")
.attr("stroke-width", 1)
.attr("stroke", (d, i) => colors[i % colors.length])
.attr("stroke-dasharray", lineShapes[line_type])
.attr("points", (d, i) => {
let points = "";
let isAxisReverse = !d.line[forwardValue];
let pcaXIndex = isAxisReverse ? 1 : 0;
let pcaYIndex = isAxisReverse ? 0 : 1;
let data = (d.line[forwardValue] || d.line[reverseValue]).ellipse;
data.forEach(item => {
points += `${xScale(item[pcaXIndex])}, ${yScale(item[pcaYIndex])} `;
});
return points;
});
}
if (center_line_enabled) {
groups
.append("g")
.attr("class", "svg-groups-line")
.selectAll(".svg-groups-line-group")
.data(data.list)
.enter()
.append("g")
.attr("index", (d, i) => i)
.attr("stroke-opacity", 0.3)
.attr("stroke", (d, i) => colors[i % colors.length])
.attr(
"class",
(d, i) => `svg-groups-line-group svg-groups-line-group${i}`
)
.selectAll("line")
.data((d, i) => d.data)
.enter()
.append("line")
.attr("x1", (d, i, elList) => {
let index = d3.select(elList[i].parentElement).attr("index");
let centroids = data.list[index].center[0];
return xScale(centroids[xIndex]);
})
.attr("y1", (d, i, elList) => {
let index = d3.select(elList[i].parentElement).attr("index");
let centroids = data.list[index].center[0];
return yScale(centroids[yIndex]);
})
.attr("x2", d => xScale(d[xIndex + 1]))
.attr("y2", d => yScale(d[yIndex + 1]));
}
groups
.append("g")
.attr("class", "svg-groups-scatter")
.selectAll(".svg-groups-scatter-group")
.data(data.list)
.enter()
.append("g")
.attr("index", (d, i) => i)
.attr("fill", (d, i) => colors[i % colors.length])
.attr(
"class",
(d, i) =>
`svg-groups-common svg-groups-scatter-group svg-groups-scatter-group${i}`
)
.selectAll("path")
.data(d => d.data)
.enter()
.append("path")
.attr("d", (d, i, elList) => {
let index = d3.select(elList[i].parentElement).attr("index");
let group = data.list[index].group;
let type = dot_types[group] || "circle";
let symbol = d3
.symbol()
.type(symbolTypes[type])
.size(dot_size * symbolZoomTimes);
return symbol();
})
.attr(
"transform",
(d, i) => `translate(${xScale(d[xIndex + 1])}, ${yScale(d[yIndex + 1])})`
)
.on("mouseover", function (e, d) {
let index = d3.select(this.parentElement).attr("index");
d3.select(this).attr("d", (d, i) => {
let group = data.list[index].group;
let type = dot_types[group] || "circle";
let symbol = d3
.symbol()
.type(symbolTypes[type])
.size(dot_size * symbolZoomTimesHover);
return symbol();
});
tooltip({
group: data.list[index].group,
sample: d[0],
xValue: d[xIndex + 1],
yValue: d[yIndex + 1],
left: e.pageX + 15,
top: e.pageY - 27,
parentElement: this.parentElement
});
})
.on("mouseout", function (d, i, elList) {
d3.select(".scatter-tooltip").style("display", "none");
let index = d3.select(this.parentElement).attr("index");
d3.select(this).attr("d", (d, i) => {
let group = data.list[index].group;
let type = dot_types[group] || "circle";
let symbol = d3
.symbol()
.type(symbolTypes[type])
.size(dot_size * symbolZoomTimes);
return symbol();
});
});
if (isLabel) {
groups
.append("g")
.attr("class", "svg-groups-label")
.selectAll(".svg-groups-label-group")
.data(data.list)
.enter()
.append("g")
.attr(
"class",
(d, i) => `svg-groups-label-group svg-groups-label-group${i}`
)
.selectAll("text")
.data(d => {
return d.data;
})
.enter()
.append("text")
.text(d => d[0])
.attr("text-anchor", "middle")
.attr("fill", label_color)
.attr("font-size", label_size)
.attr("font-family", label_font)
.attr("x", d => xScale(d[xIndex + 1]))
.attr("y", d => yScale(d[yIndex + 1]) - dot_size);
}
if (data.metabolites && data.metabolites.length > 0) {
const selectedMetabolites = data.metabolites.slice(0, metabolites_count);
groups
.append("g")
.attr("class", "svg-groups-metabolites-lines")
.selectAll(".svg-groups-metabolites-line")
.data(selectedMetabolites)
.enter()
.append("line")
.attr("x1", xScale(0))
.attr("y1", yScale(0))
.attr("x2", d => {
let xValue;
if (x_axis_value === "PC1") xValue = d.x;
else if (x_axis_value === "PC2") xValue = d.y;
else if (x_axis_value === "PC3") xValue = d.z;
return xScale(xValue);
})
.attr("y2", d => {
let yValue;
if (y_axis_value === "PC1") yValue = d.x;
else if (y_axis_value === "PC2") yValue = d.y;
else if (y_axis_value === "PC3") yValue = d.z;
return yScale(yValue);
})
.attr("stroke", "rgba(0, 0, 0, 0.4)")
.attr("stroke-width", 1)
.attr("marker-end", "url(#lineArrow)");
// 创建代谢物标签组
const metabolitesLabelGroup = groups
.append("g")
.attr("class", "svg-groups-metabolites-label");
// 定义拖拽行为
const drag = d3
.drag()
// .on("start", function (event, d) {
// // 添加拖拽时的样式
// d3.select(this).attr("font-weight", "bold").attr("fill", "red").raise(); // 将当前元素提到最上层
// })
.on("drag", function (event, d) {
// 获取鼠标在groups坐标系中的位置
const [x, y] = d3.pointer(event, groups.node());
// 更新标签位置
d3.select(this).attr("x", x).attr("y", y);
// 存储拖拽后的位置(相对于groups的坐标)
const id = d.id || (metabolites_label_type === "name" ? d.label : d.id);
draggedMetaboliteLabels.set(id, { x, y });
})
.on("end", function (event, d) {
// 恢复样式
d3.select(this)
.attr("font-weight", "normal")
.attr("fill", metabolites_text_color);
});
// 创建代谢物标签
const metabolitesLabels = metabolitesLabelGroup
.selectAll(".svg-groups-metabolites-label-group")
.data(selectedMetabolites)
.enter()
.append("text")
.text(d =>
metabolites_label_type === "name" && d.label ? d.label : d.id
)
.attr("class", "svg-groups-metabolites-label-text")
.attr(
"data-id",
d => d.id || (metabolites_label_type === "name" ? d.label : d.id)
)
.attr("cursor", "move")
.attr("text-anchor", "start")
.attr("fill", metabolites_text_color)
.attr("font-size", metabolites_text_size)
.attr("font-family", metabolites_text_font)
.attr("x", d => {
// 如果有拖拽后的位置,使用拖拽后的位置
const id = d.id || (metabolites_label_type === "name" ? d.label : d.id);
if (draggedMetaboliteLabels.has(id)) {
return draggedMetaboliteLabels.get(id).x;
}
// 否则使用计算的位置
let xValue;
if (x_axis_value === "PC1") xValue = d.x;
else if (x_axis_value === "PC2") xValue = d.y;
else if (x_axis_value === "PC3") xValue = d.z;
return xScale(xValue) + 6;
})
.attr("y", d => {
// 如果有拖拽后的位置,使用拖拽后的位置
const id = d.id || (metabolites_label_type === "name" ? d.label : d.id);
if (draggedMetaboliteLabels.has(id)) {
return draggedMetaboliteLabels.get(id).y;
}
// 否则使用计算的位置
let yValue;
if (y_axis_value === "PC1") yValue = d.x;
else if (y_axis_value === "PC2") yValue = d.y;
else if (y_axis_value === "PC3") yValue = d.z;
return yScale(yValue) + 4;
});
// 如果启用了拖拽功能,添加拖拽行为
if (metabolites_draggable) {
metabolitesLabels.call(drag);
// 添加拖拽提示样式
metabolitesLabels
.on("mouseover", function () {
if (!d3.event.defaultPrevented) {
d3.select(this).attr("font-weight", "bold").attr("fill", "blue");
}
})
.on("mouseout", function () {
if (!d3.event.defaultPrevented) {
d3.select(this)
.attr("font-weight", "normal")
.attr("fill", metabolites_text_color);
}
});
}
}
};
export default pcaChart;调用:
  biplot({
              container: "#biplot-container",
              data: plots,
              ...biplotChartParam
            });
参数配置:
  const biplotParams = {
    isLabel: false,
    label_font: "Arial",
    label_size: 12,
    label_color: "#000000",
    width: 70,
    height: 98,
    color: "Science",
    colorList: [],
    modalVisible: false,
    plot_type: "ellipse",
    dot_types: {},
    dot_group: "",
    dot_type: "circle",
    dot_size: 5,
    line_type: "straigh_line",
    opacity: 0.5,
    x_axis_value: "PC1",
    x_axis_value2: "PC1",
    y_axis_value: "PC2",
    y_axis_value2: "PC2",
    is_xy_same: false,
    grid_enabled: false,
    border_enabled: true,
    center_line_enabled: false,
    auxiliary_line_enabled: true,

    metabolites: [
      "mate1",
      "mate2",
      "mate3",
      "mate4",
      "mate5",
      "mate6",
      "mate7"
    ],
    metabolites_count: 3,
    metabolites_label_type: "id",
    metabolites_text_color: "#fa1616",
    metabolites_text_size: 12,
    metabolites_text_font: "Arial",

    main_title: "",
    main_title_color: "#000000",
    main_title_size: 16,
    main_title_font: "Arial",

    x_title: "PC1",
    x_title_color: "#000000",
    x_title_size: 14,
    x_title_font: "Arial",
    x_text_color: "#000000",
    x_text_size: 9,
    x_text_font: "Arial",
    x_text_rotate: -45,

    y_title: "PC2",
    y_title_color: "#000000",
    y_title_size: 14,
    y_title_font: "Arial",
    y_text_color: "#000000",
    y_text_size: 12,
    y_text_font: "Arial"
  };
效果图:
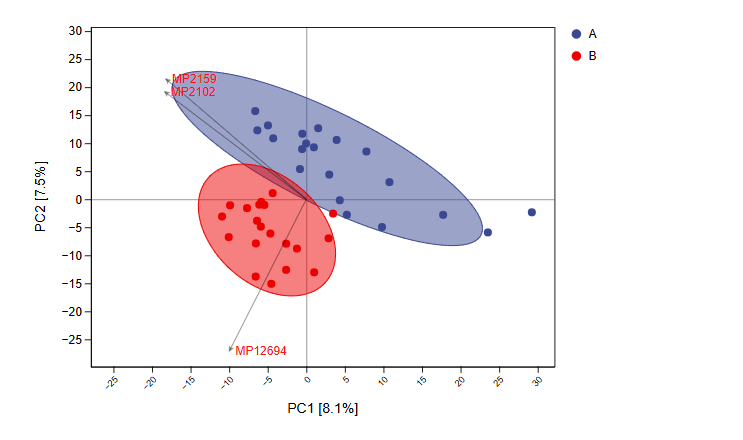
今天的工作和生活都不高兴。