Zabbix
Zabbix 概述
产品简介
Zabbix 是由 Alexei Vladishev 创建、Zabbix SIA 维护的企业级开源分布式监控解决方案,可监控网络参数、服务器、虚拟机、应用程序、数据库等 IT 资源的健康状态和完整性。支持灵活告警机制、数据报表与可视化功能,适用于各类规模组织,基于 GNU GPL v2 协议开源免费。
核心架构组件
-
Zabbix Server:核心组件,接收 Agent 上报数据,存储配置与运行数据。
-
数据库存储:存储所有配置信息和监控数据。
-
Web 界面:基于 Web 的管理界面,与 Server 协同,支持跨平台访问。
-
Zabbix Proxy:可选组件,分担 Server 负载,代理收集监控数据。
-
Zabbix Agent:部署在监控目标端,分 Agent(C 语言,轻量)和 Agent2(Go 语言,可扩展),主动收集本地资源数据并上报。
环境准备与 LNMP 架构搭建
部署规划
| 主机名 | IP 地址 | 功能 | 操作系统 |
|---|---|---|---|
| zabbix-server | <192.168.108.50> | 部署 Zabbix Server、LNMP 环境 | CentOS 7 |
| mysql001 | <192.168.108.51> | 被监控端,部署 Zabbix Agent2 | CentOS 7 |
安装 Nginx
Bash
# 创建yum源
[root@zabbix-server ~]# vim /etc/yum.repos.d/nginx.repo
[root@zabbix-server ~]# cat /etc/yum.repos.d/nginx.repo
[nginx]
name=nginx repo
baseurl=http://nginx.org/packages/centos/7/$basearch/
enabled=1
gpgcheck=0
# 安装nginx
[root@zabbix-server ~]# yum install nginx -y
# 开启服务
[root@zabbix-server ~]# systemctl enable nginx --now
Created symlink from /etc/systemd/system/multi-user.target.wants/nginx.service to /usr/lib/systemd/system/nginx.service.
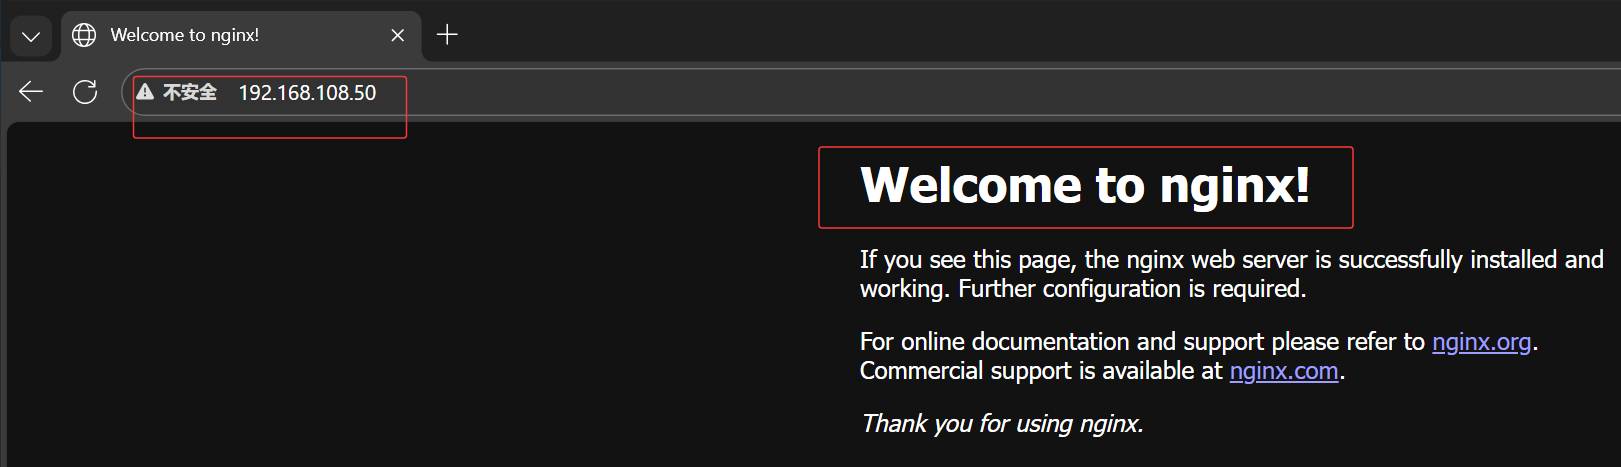
# 防火墙添加通过http
[root@zabbix-server ~]# firewall-cmd --add-service=http --zone=public
success
[root@zabbix-server ~]# firewall-cmd --add-service=http --zone=public --permanent
success
[root@zabbix-server ~]# firewall-cmd --reload
success访问 http://192.168.108.50
安装 MariaDB
Bash
# 配置yum源
[root@zabbix-server ~]# vim /etc/yum.repos.d/mariadb.repo
[root@zabbix-server ~]# cat /etc/yum.repos.d/mariadb.repo
[maruadb]
name = MariaDB
baseurl = https://mirrors.aliyun.com/mariadb/yum/10.6/centos7-amd64/
enabled = 1
gpgcheck = 0

# 下载mariadb
[root@zabbix-server ~]# yum install -y mariadb-server mariadb

# 开启服务
[root@zabbix-server ~]# systemctl enable mariadb --now
Created symlink from /etc/systemd/system/multi-user.target.wants/mariadb.service to /usr/lib/systemd/system/mariadb.service.

# 设置root密码
[root@zabbix-server ~]# mysql

MariaDB [(none)]> delete from mysql.user where User='';
Query OK, 2 rows affected (0.002 sec)

MariaDB [(none)]> alter user root@localhost identified by 'xiaomi';
Query OK, 0 rows affected (0.001 sec)

# 连接数据库测试
[root@zabbix-server ~]# mysql -uroot -pxiaomi
Welcome to the MariaDB monitor.  Commands end with ; or \g.
Your MariaDB connection id is 4
Server version: 10.6.19-MariaDB MariaDB Server

Copyright (c) 2000, 2018, Oracle, MariaDB Corporation Ab and others.

Type 'help;' or '\h' for help. Type '\c' to clear the current input statement.

MariaDB [(none)]>
安装 PHP
Bash
# 安装并配置依赖源
[root@zabbix-server ~]# yum install -y epel-release
[root@zabbix-server ~]# sed -i "s/#baseurl/baseurl/g" /etc/yum.repos.d/epel.repo
[root@zabbix-server ~]# sed -i "s/metalink/#metalink/g" /etc/yum.repos.d/epel.repo
[root@zabbix-server ~]# sed -i "s@https\?://download.[a-z]*\.\?[a-z]*/pub@https://repo.huaweicloud.com@g" /etc/yum.repos.d/epel.repo

[root@zabbix-server ~]# rpm -Uvh https://mirror.webtatic.com/yum/el7/webtatic-release.rpm
获取https://mirror.webtatic.com/yum/el7/webtatic-release.rpm
警告:/var/tmp/rpm-tmp.9mJqtl: 头V4 RSA/SHA1 Signature, 密钥 ID 62e74ca5: NOKEY
准备中...                          ################################# [100%]
正在升级/安装...
   1:webtatic-release-7-3             ################################# [100%]

[root@zabbix-server ~]# yum -y install php72w php72w-cli php72w-common php72w-devel php72w-embedded php72w-gd php72w-mbstring php72w-pdo php72w-xml php72w-fpm php72w-mysqlnd php72w-opcache php72w-ldap php72w-bcmath
Bash
配置nginx支持php

# 修改php-fpm配置文件,把apache改为nginx
[root@zabbix-server ~]# vim /etc/php-fpm.d/www.conf
8 user = nginx
10 group = nginx

# 配置location,在index中添加index.php。以支持index.php的首页
[root@zabbix-server ~]# vim /etc/nginx/conf.d/default.conf
9 index index.php index.html index.htm;

# 配置php请求被传送到后端的php-fpm模块,默认情况下php配置块是被注释的,此时去掉注释并修改
# 把fastcgi_param中的/scripts改为$document_root。root是配置php程序放置的根目录
29     location ~ \.php$ {
30        root           /usr/share/nginx/html;
31        fastcgi_pass   127.0.0.1:9000;
32        fastcgi_index  index.php;
33        fastcgi_param  SCRIPT_FILENAME  $document_root$fastcgi_scrip    t_name;
34         include        fastcgi_params;
35     }
bash
配置php
# 修改PHP配置文件
[root@zabbix-server ~]# vim /etc/php.ini
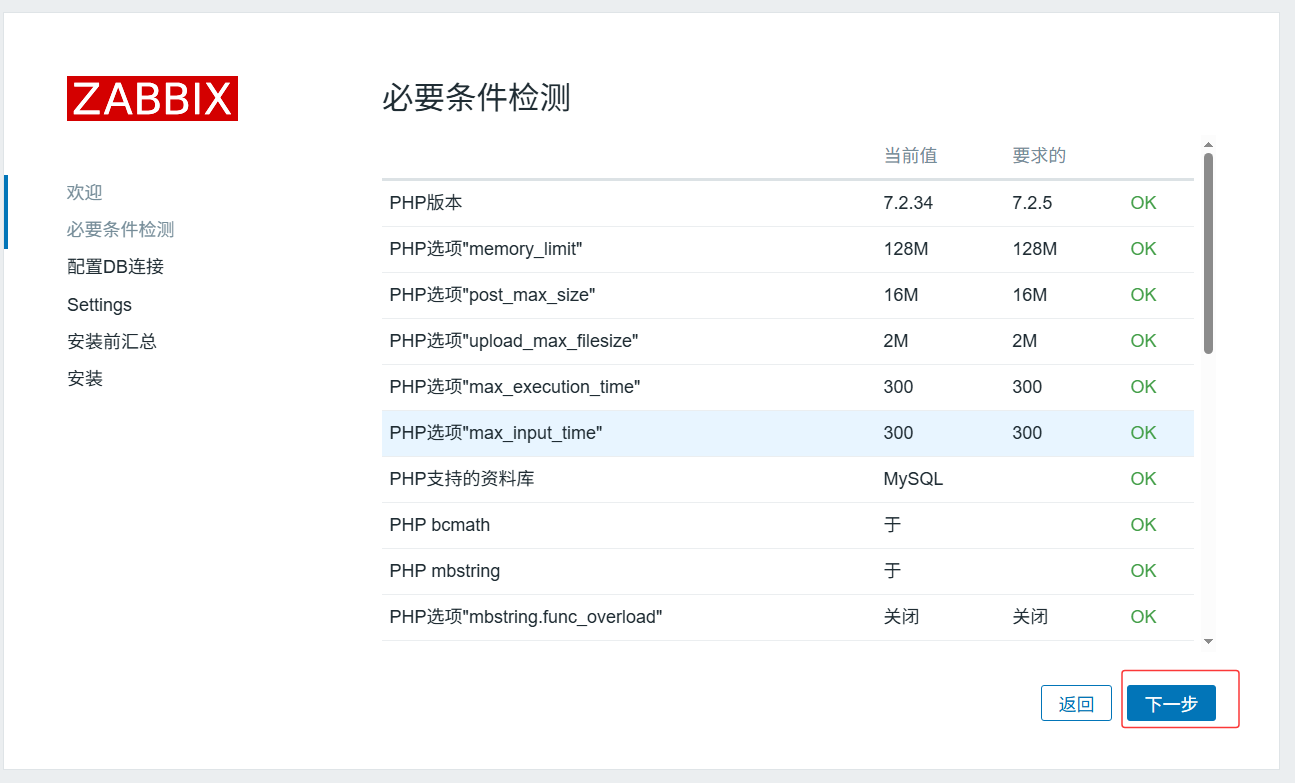
202 short_open_tag = On
359 expose_php = Off
# 以下为zabbix优化配置要求
368 max_execution_time = 300
378 max_input_time = 300
389 memory_limit = 128M
656 post_max_size = 16M
799 upload_max_filesize = 2M
800 always_populate_raw_post_data = -1
877 ;date.timezone = Asia/Shanghai
# 启动php-fpm服务
[root@zabbix-server ~]# systemctl enable php-fpm --now
Created symlink from /etc/systemd/system/multi-user.target.wants/php-fpm.service to /usr/lib/systemd/system/php-fpm.service.
# 重启nginx
[root@zabbix-server ~]# systemctl restart nginx测试
bash
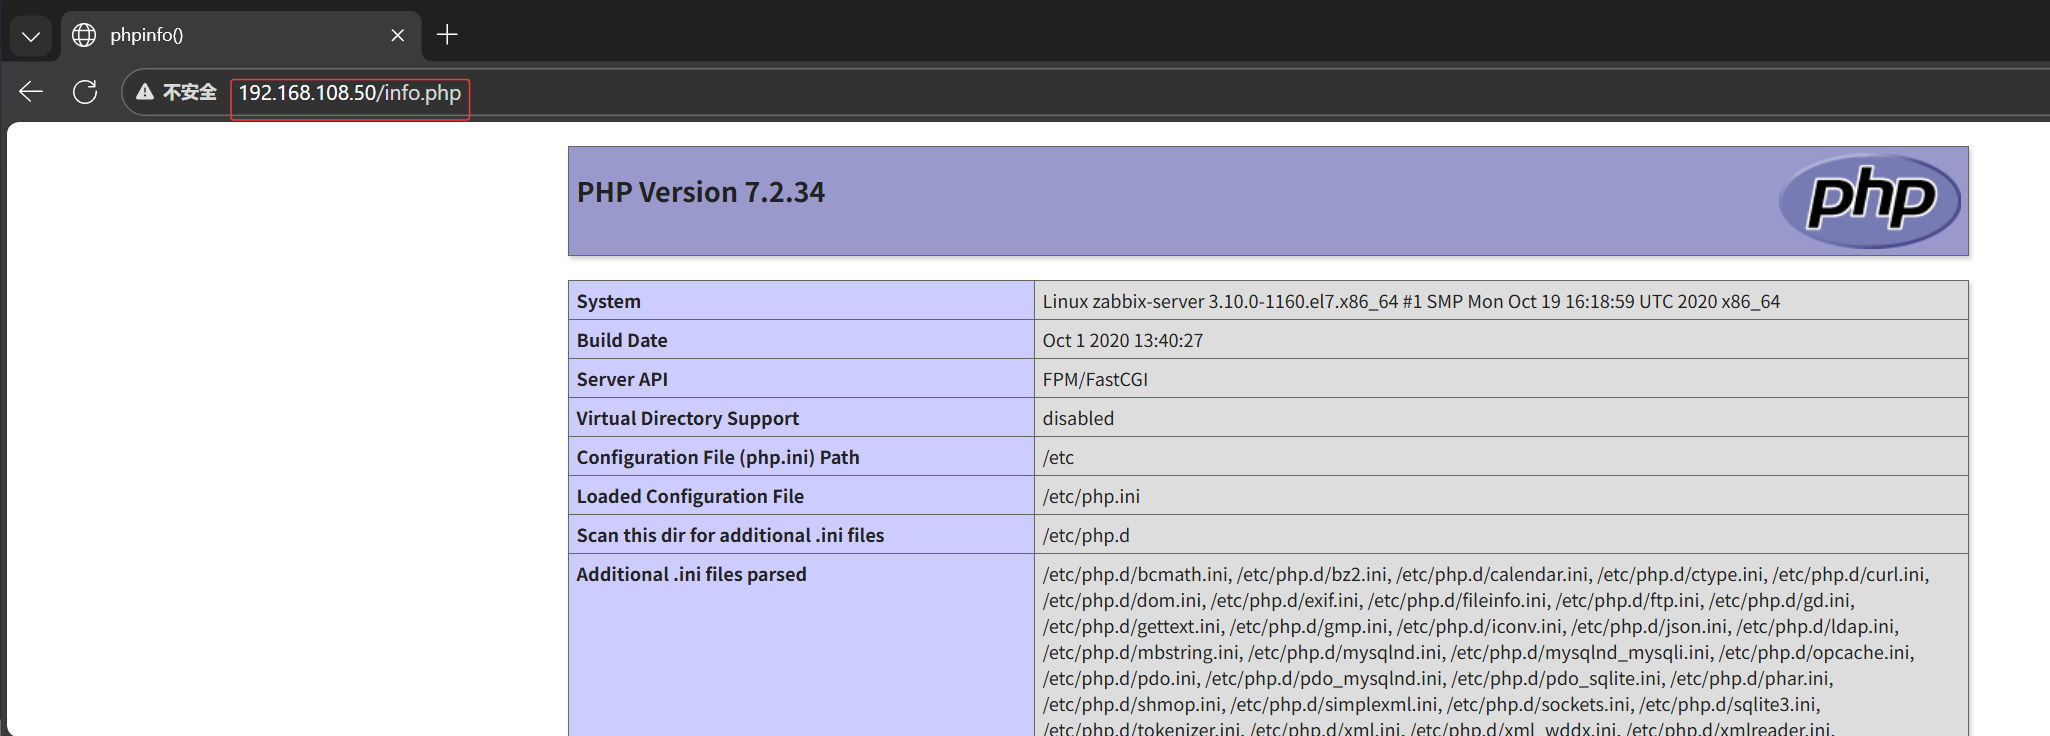
# 测试php首页
[root@zabbix-server ~]# vim /usr/share/nginx/html/info.php
[root@zabbix-server ~]# cat /usr/share/nginx/html/info.php
<?php
 phpinfo();
?>
bash
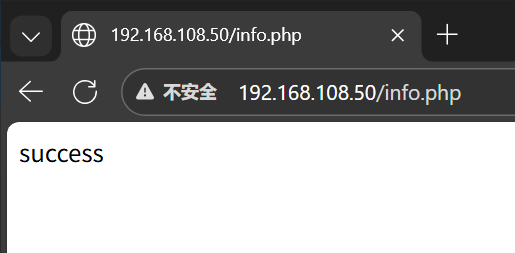
# 测试连接数据库
[root@zabbix-server ~]# vim /usr/share/nginx/html/info.php
[root@zabbix-server ~]# cat /usr/share/nginx/html/info.php
<?php
 $link=mysqli_connect('127.0.0.1','root','xiaomi');
 if ($link) echo "success";
 else echo "fail";
?>
bash
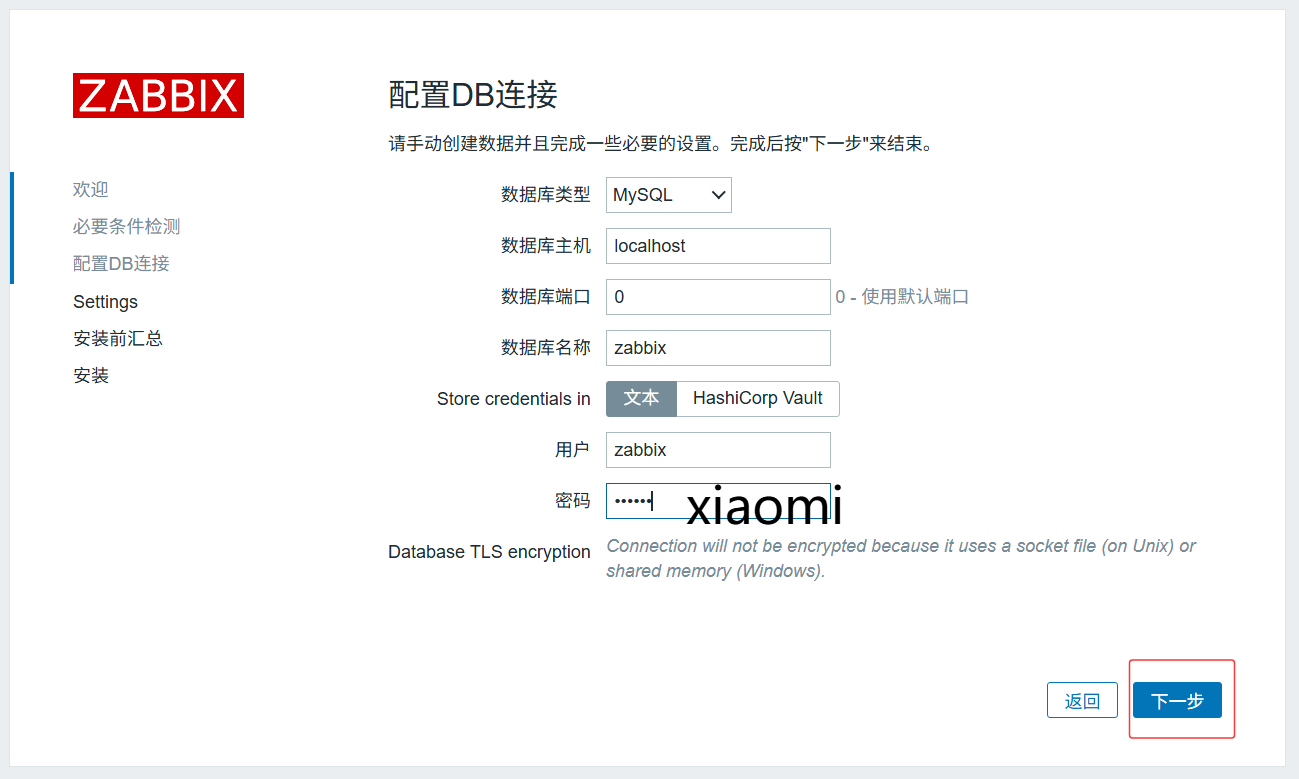
# 创建zabbix用的数据库及账号
[root@zabbix-server ~]# mysql -uroot -pxiaomi
MariaDB [(none)]> CREATE DATABASE zabbix character set utf8 collate utf8_bin;
Query OK, 1 row affected (0.000 sec)
MariaDB [(none)]> GRANT all privileges ON *.* TO 'zabbix'@'%' IDENTIFIED BY 'xiaomi';
Query OK, 0 rows affected (0.001 sec)
MariaDB [(none)]> GRANT all privileges ON *.* TO 'zabbix'@'localhost' IDENTIFIED BY 'xiaomi';
Query OK, 0 rows affected (0.001 sec)
MariaDB [(none)]> flush privileges;
Query OK, 0 rows affected (0.001 sec)
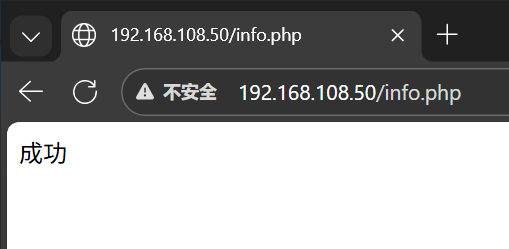
# 测试连接zaabix数据库
[root@zabbix-server ~]# vim /usr/share/nginx/html/info.php
[root@zabbix-server ~]# cat /usr/share/nginx/html/info.php
<?php
$link=mysqli_connect('127.0.0.1','zabbix','xiaomi');
if ($link) echo "成功";
else echo "失败";
?>
Zabbix Server
导入数据库
Bash
# 解压
[root@zabbix-server ~]# tar zxvf zabbix-6.0.6.tar.gz

# 导入数据库
[root@zabbix-server ~]# cd /root/zabbix-6.0.6/database/mysql/
[root@zabbix-server mysql]# ls
data.sql    history_pk_prepare.sql  Makefile.am  schema.sql
double.sql  images.sql              Makefile.in
[root@zabbix-server mysql]# mysql -uroot -pxiaomi zabbix < schema.sql
[root@zabbix-server mysql]# mysql -uroot -pxiaomi zabbix < images.sql
[root@zabbix-server mysql]# mysql -uroot -pxiaomi zabbix < data.sql
[root@zabbix-server mysql]# mysql -uroot -pxiaomi zabbix < double.sql
[root@zabbix-server mysql]# mysql -uroot -pxiaomi zabbix < history_pk_prepare.sql

# 进入zabbix数据库查看
[root@zabbix-server mysql]# mysql -uroot -pxiaomi

MariaDB [(none)]> use zabbix;
Reading table information for completion of table and column names
You can turn off this feature to get a quicker startup with -A

Database changed
MariaDB [zabbix]> show tables;
+----------------------------+
| Tables_in_zabbix           |
+----------------------------+
| acknowledges               |
| actions                    |
| alerts                     |
...
安装软件包
Bash
# 安装zabbix环境包
[root@zabbix-server mysql]# yum install -y mysql-devel pcre-devel openssl-devel zlib-devel libxml2-devel net-snmp-devel net-snmp libssh2-devel OpenIPMI-devel libevent-devel openldap-devel libcurl-devel fping gcc gcc-c++ make

# 创建zabbix用户
[root@zabbix-server mysql]# useradd -s /sbin/nologin -M zabbix

# 使得编译器在编译 C 代码时使用 GNU C99 标准
[root@zabbix-server mysql]# export CFLAGS="-std=gnu99"

# 执行configure脚本
[root@zabbix-server zabbix-6.0.6]# ./configure --sysconfdir=/etc/zabbix/ --enable-server --with-mysql --with-net-snmp --with-libxml2 --with-ssh2 --with-openipmi --with-zlib --with-libpthread --with-libevent --with-openssl --with-ldap --with-libcurl --with-libpcre

# 安装
[root@zabbix-server zabbix-6.0.6]# make install

#检查版本
[root@zabbix-server zabbix-6.0.6]# zabbix_server --version
zabbix_server (Zabbix) 6.0.6
Revision 3f7597e3ea3 27 June 2022, compilation time: Dec 23 2025 19:35:23

Copyright (C) 2022 Zabbix SIA
License GPLv2+: GNU GPL version 2 or later <http://gnu.org/licenses/gpl.html>.
This is free software: you are free to change and redistribute it according to
the license. There is NO WARRANTY, to the extent permitted by law.

This product includes software developed by the OpenSSL Project
for use in the OpenSSL Toolkit (http://www.openssl.org/).

Compiled with OpenSSL 1.0.2k-fips  26 Jan 2017
Running with OpenSSL 1.0.2k-fips  26 Jan 2017
修改zabbix-server配置文件
Bash
[root@zabbix-server ~]# vim /etc/zabbix/zabbix_server.conf
38 LogFile=/var/log/zabbix_server.log
123 DBPassword=xiaomi

# 创建日志文件并修改属组和属主
[root@zabbix-server ~]# touch /var/log/zabbix_server.log
[root@zabbix-server ~]# chown zabbix.zabbix /var/log/zabbix_server.log

# 创建并添加systemctl服务管理zabbix-server
[root@zabbix-server ~]# vim /usr/lib/systemd/system/zabbix-server.service
[root@zabbix-server ~]# cat /usr/lib/systemd/system/zabbix-server.service
[Unit]
Description=Zabbix Server with MySQL DB
After=syslog.target network.target mysqld.service

[Service]
Type=simple
ExecStart=/usr/local/sbin/zabbix_server -f
User=zabbix

[Install]
WantedBy=multi-user.target

# 启动zabbix
[root@zabbix-server ~]# systemctl start zabbix-server
[root@zabbix-server ~]# netstat -ntap | grep 10051
tcp        0      0 0.0.0.0:10051           0.0.0.0:*               LISTEN      32061/zabbix_server
Bash
# 前端页面复制到站点
[root@zabbix-server ~]# cp -r /root/zabbix-6.0.6/ui/* /usr/share/nginx/html/
[root@zabbix-server ~]# chown -R nginx:nginx /usr/share/nginx/html/


ELK企业日志分析系统
概述
日志分析是运维和开发人员排查故障、监控系统状态的核心手段,涵盖系统日志、应用程序日志和安全日志。传统分散式日志管理效率低下,ELK平台作为开源集中化日志解决方案,可实现日志的收集、过滤、存储、检索与可视化,完美解决海量日志管理难题。
ELK由三大核心组件构成:
-
Elasticsearch:分布式搜索引擎,负责日志的存储、索引与快速检索。
-
Logstash:数据处理管道,实现日志的收集、过滤与格式化。
-
Kibana:可视化分析平台,提供日志的Web可视化界面与数据分析功能。
工作原理
核心数据流:日志/数据源 → Logstash(收集、处理) → Elasticsearch(存储、索引) → Kibana(可视化、分析)
具体流程:
-
日志集中化收集(可结合Beats轻量采集器);
-
Logstash对原始日志进行格式化处理;
-
Elasticsearch对处理后的数据建立索引并存储;
-
Kibana提供Web界面,支持日志查询、图表展示与仪表盘监控。
核心组件详解
Elasticsearch:分布式搜索与分析引擎
-
分布式存储:支持PB级数据,通过副本机制保障高可用;
-
实时搜索:数据写入后毫秒级可检索,适配实时监控场景;
-
全文搜索:基于Lucene,支持模糊搜索、同义词处理与相关性评分;
-
倒排索引:查询速度远超传统数据库逐行扫描;
-
RESTful API:支持数据读写、集群管理等所有操作;
-
聚合分析:支持复杂统计分析(如按应用分组统计错误数、计算访问延迟分位数)。
Logstash:服务器端数据处理管道
工作流程分为三阶段:
-
Input(输入):支持文件、Syslog、消息队列、数据库等多种数据源;
-
Filter(过滤):通过Grok解析非结构化日志、Mutate修改字段、Date处理时间戳、GeoIP解析IP地址等;
-
Output(输出):默认输出至Elasticsearch,也支持数据库、消息队列、文件等目的地。
Kibana:数据可视化与管理平台
-
数据探索:支持Lucene/KQL查询语法,可动态过滤数据;
-
可视化组件:提供柱状图、折线图、饼图、指标看板、地图等多种图表;
-
仪表盘:支持多图表组合,适配实时监控大屏;
-
集群管理:支持索引生命周期管理、用户权限控制等。
实验环境规划
主机配置
| 主机名 | IP地址 | 操作系统 | 核心软件 | 功能 |
|---|---|---|---|---|
| node1 | <192.168.108.41> | CentOS 7.9 | Elasticsearch、Kibana、elasticsearch-head | ES集群节点、可视化平台 |
| node2 | <192.168.108.42> | CentOS 7.9 | Elasticsearch、elasticsearch-head | ES集群节点 |
| apache | <192.168.108.43> | CentOS 7.9 | Logstash、Apache | 日志源、日志收集处理 |
Elasticsearch集群部署
环境准备
Bash
[root@node1 ~]# vim /etc/hosts
[root@node1 ~]# cat /etc/hosts
192.168.108.41 node1
192.168.108.42 node2
[root@node1 ~]# java -version
openjdk version "1.8.0_262"
OpenJDK Runtime Environment (build 1.8.0_262-b10)
OpenJDK 64-Bit Server VM (build 25.262-b10, mixed mode)


[root@node2 ~]# vim /etc/hosts
[root@node2 ~]# cat /etc/hosts
192.168.108.41 node1
192.168.108.42 node2
[root@node2 ~]# java -version
openjdk version "1.8.0_262"
OpenJDK Runtime Environment (build 1.8.0_262-b10)
OpenJDK 64-Bit Server VM (build 25.262-b10, mixed mode)
安装Elasticsearch
Bash
#安装elasticsearch rpm包,上传elasticsearch-5.5.0.rpm到/opt目录下
[root@node1 ~]# cd /opt/
[root@node1 opt]# rpm -ivh elasticsearch-5.5.0.rpm
警告:elasticsearch-5.5.0.rpm: 头V4 RSA/SHA512 Signature, 密钥 ID d88e42b4: NOKEY
准备中... ################################# [100%]
Creating elasticsearch group... OK
Creating elasticsearch user... OK
正在升级/安装...
1:elasticsearch-0:5.5.0-1 ################################# [100%]
#加载系统服务
[root@node1 opt]# systemctl daemon-reload
[root@node1 opt]# systemctl enable elasticsearch.service
Created symlink from /etc/systemd/system/multiuser.target.wants/elasticsearch.service to /usr/lib/systemd/system/elasticsearch.service.
# 更改elasticsearch主配置文件
[root@node1 ~]# cp /etc/elasticsearch/elasticsearch.yml /etc/elasticsearch/elasticsearch.yml.bak
[root@node1 ~]# vim /etc/elasticsearch/elasticsearch.yml
17 cluster.name: my-elk-cluster
23 node.name: node1
33 path.data: /data/elk_data
37 path.logs: /var/log/elasticsearch
43 bootstrap.memory_lock: false
55 network.host: 0.0.0.0
59 http.port: 9200
68 discovery.zen.ping.unicast.hosts: ["node1", "node2"]:
#创建数据存放路径并授权
[root@node1 ~]# mkdir -p /data/elk_data
[root@node1 ~]# chown elasticsearch:elasticsearch /data/elk_data/
#启动elasticsearch是否成功开启
[root@node1 ~]# systemctl start elasticsearch
[root@node1 ~]# netstat -antp |grep 9200
tcp6 0 0 :::9200 :::* LISTEN 16774/java
#安装elasticsearch rpm包,上传elasticsearch-5.5.0.rpm到/opt目录下
[root@node2 ~]# cd /opt/
[root@node2 opt]# rpm -ivh elasticsearch-5.5.0.rpm
#加载系统服务
[root@node2 opt]# systemctl daemon-reload
[root@node2 opt]# systemctl enable elasticsearch.service
Created symlink from /etc/systemd/system/multiuser.target.wants/elasticsearch.service to /usr/lib/systemd/system/elasticsearch.service.
# 更改elasticsearch主配置文件
[root@node2 opt]# cp /etc/elasticsearch/elasticsearch.yml /etc/elasticsearch/elasticsearch.yml.bak
[root@node2 opt]# vim /etc/elasticsearch/elasticsearch.yml
17 cluster.name: my-elk-cluster
23 node.name: node2
33 path.data: /data/elk_data
37 path.logs: /var/log/elasticsearch
43 bootstrap.memory_lock: false
55 network.host: 0.0.0.0
59 http.port: 9200
68 discovery.zen.ping.unicast.hosts: ["node1", "node2"]:
#创建数据存放路径并授权
[root@node2 ~]# mkdir -p /data/elk_data
[root@node2 ~]# chown elasticsearch:elasticsearch /data/elk_data/
#启动elasticsearch是否成功开启
[root@node2 ~]# systemctl start elasticsearch
[root@node2 ~]# netstat -antp |grep 9200
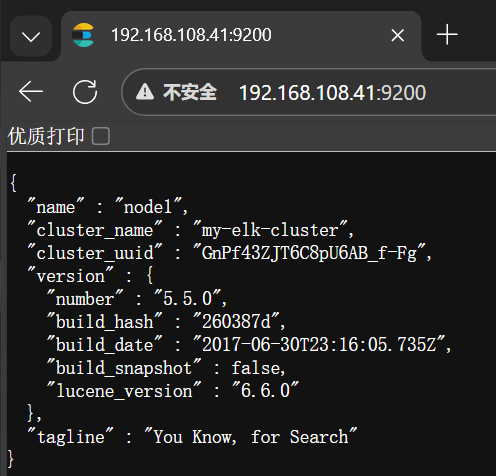
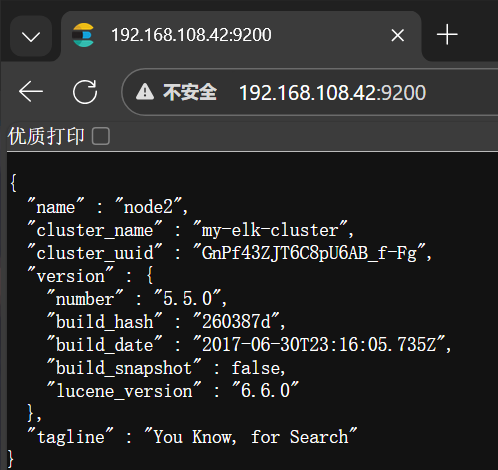
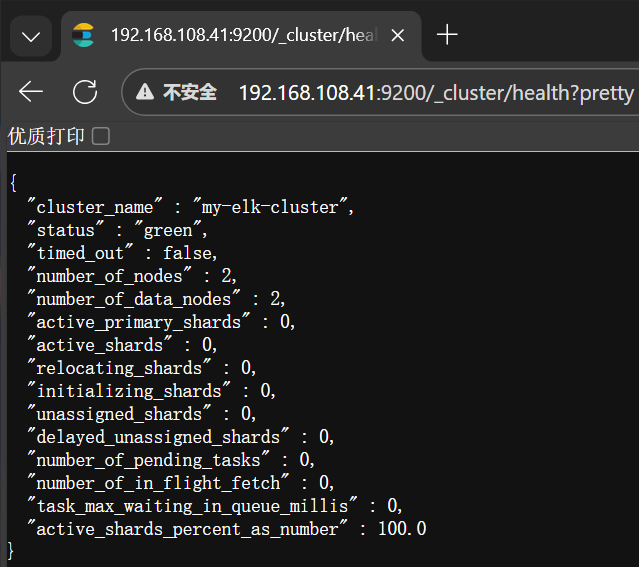
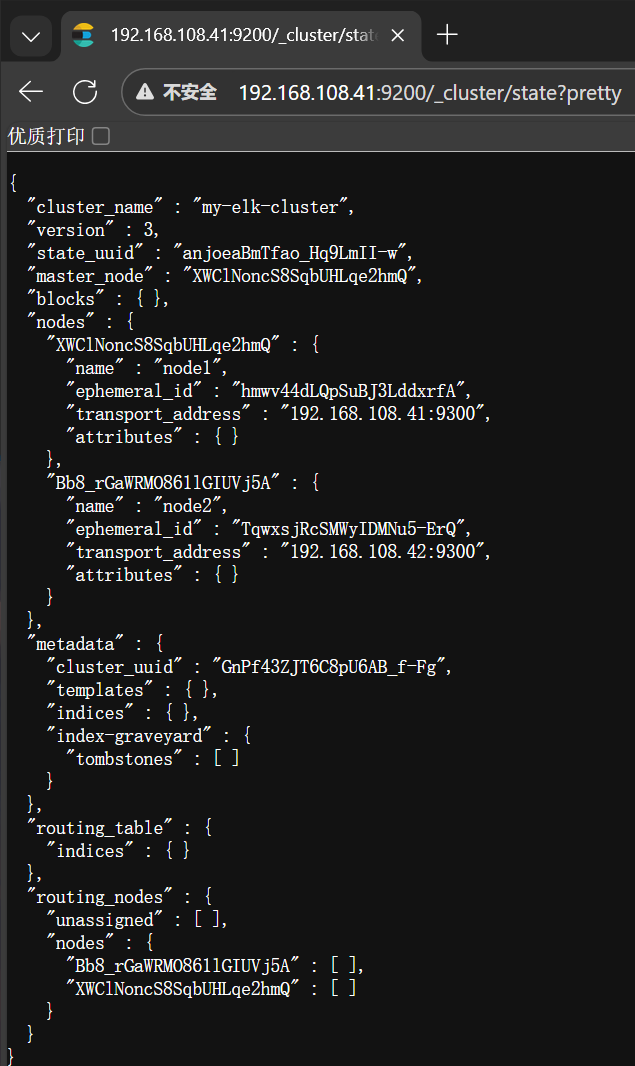
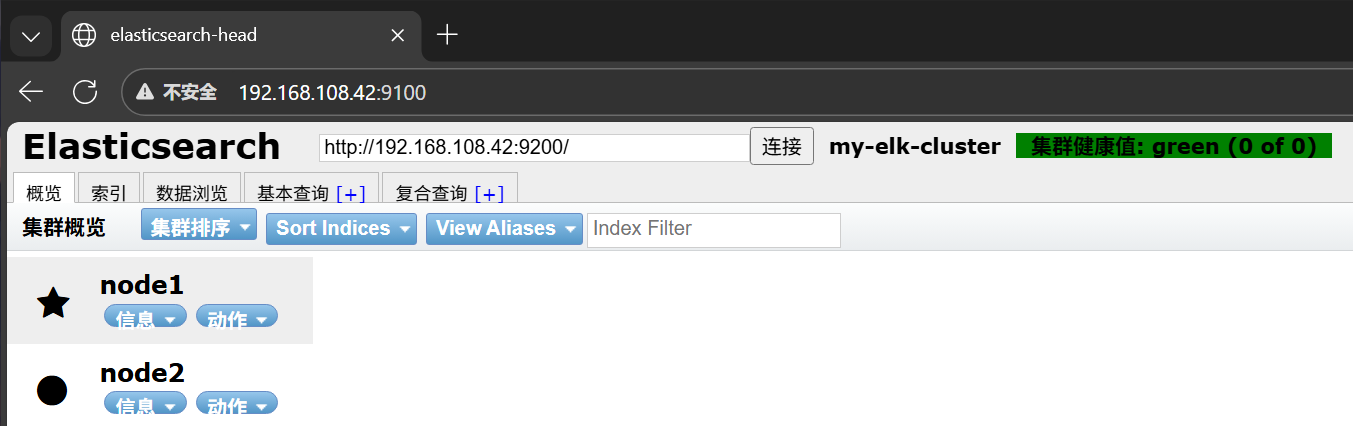
tcp6 0 0 :::9200 :::* LISTEN 32337/java 查看节点信息
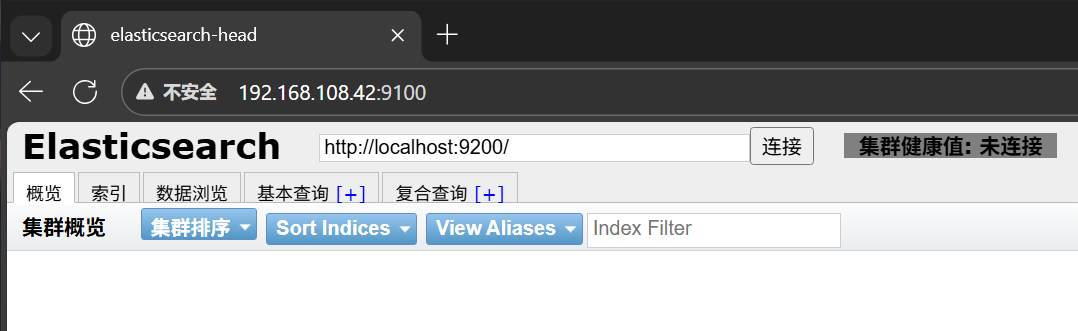
安装elasticsearch-head插件
Bash
#上传node-v8.2.1.tar.gz到/opt
[root@node1 ~]# yum install gcc gcc-c++ make -y
[root@node1 ~]# cd /opt/
[root@node1 opt]# tar xzvf node-v8.2.1.tar.gz
[root@node1 opt]# cd node-v8.2.1/
[root@node1 node-v8.2.1]# ./configure
[root@node1 node-v8.2.1]# make -j4
[root@node1 node-v8.2.1]# make install


#上传node-v8.2.1.tar.gz到/opt
[root@node2 ~]# yum install gcc gcc-c++ make -y
[root@node2 ~]# cd /opt/
[root@node2 opt]# tar xzvf node-v8.2.1.tar.gz
[root@node2 opt]# cd node-v8.2.1/
[root@node2 node-v8.2.1]# ./configure
[root@node2 node-v8.2.1]# make -j4
[root@node2 node-v8.2.1]# make install
安装phantomjs端框架
bash
#上传软件包到/usr/local/src/
[root@node1 ~]# cd /usr/local/src/
[root@node1 src]# tar xjvf phantomjs-2.1.1-linux-x86_64.tar.bz2
[root@node1 src]# cd phantomjs-2.1.1-linux-x86_64/bin
[root@node1 bin]# cp phantomjs /usr/local/bin


#上传软件包到/usr/local/src/
[root@node2 ~]# cd /usr/local/src/
[root@node2 src]# tar xjvf phantomjs-2.1.1-linux-x86_64.tar.bz2
[root@node2 src]# cd phantomjs-2.1.1-linux-x86_64/bin
[root@node2 bin]# cp phantomjs /usr/local/bin
安装elasticsearch-head数据可视化工具
bash
[root@node1 bin]# cd /usr/local/src/
[root@node1 src]# tar xzvf elasticsearch-head.tar.gz
[root@node1 src]# cd elasticsearch-head/
[root@node1 elasticsearch-head]# npm install

#修改主配置文件
[root@node1 ~]# vim /etc/elasticsearch/elasticsearch.yml
http.cors.enabled: true
http.cors.allow-origin: "*"
[root@node1 ~]# systemctl restart elasticsearch

#启动elasticsearch-head  启动服务器
[root@node1 ~]# cd /usr/local/src/elasticsearch-head/
[root@node1 elasticsearch-head]# npm run start &
[1] 106099

[root@node1 ~]# netstat -lnupt |grep 9100
tcp        0      0 0.0.0.0:9100            0.0.0.0:*               LISTEN      106109/grunt
[root@node1 ~]# netstat -lnupt |grep 9200
tcp6       0      0 :::9200                 :::*                    LISTEN      104777/java


[root@node2 bin]# cd /usr/local/src/
[root@node2 src]# tar xzvf elasticsearch-head.tar.gz
[root@node2 src]# cd elasticsearch-head/
[root@node2 elasticsearch-head]# npm install

#修改主配置文件
[root@node2 ~]# vim /etc/elasticsearch/elasticsearch.yml
http.cors.enabled: true
http.cors.allow-origin: "*"
[root@node2 ~]# systemctl restart elasticsearch

#启动elasticsearch-head  启动服务器
[root@node2 ~]# cd /usr/local/src/elasticsearch-head/
[root@node2 elasticsearch-head]# npm run start &
[1] 106099

[root@node2 ~]# netstat -lnupt |grep 9100
tcp        0      0 0.0.0.0:9100            0.0.0.0:*               LISTEN      108994/grunt
[root@node2 ~]# netstat -lnupt |grep 9200
tcp6       0      0 :::9200                 :::*                    LISTEN      108691/java
验证结果


安装Logstash
安装Apahce服务
Bash
[root@apache ~]# yum -y install httpd
[root@apache ~]# systemctl start httpd

#访问下日志
[root@apache ~]# cd /var/log/httpd/
[root@apache httpd]# ls
access_log  error_log
安装Java环境
bash
[root@apache httpd]# java -version
openjdk version "1.8.0_262"
OpenJDK Runtime Environment (build 1.8.0_262-b10)
OpenJDK 64-Bit Server VM (build 25.262-b10, mixed mode)
安装logstash
bash
[root@apache ~]# cd /opt/
[root@apache opt]# rpm -ivh logstash-5.5.1.rpm
警告:logstash-5.5.1.rpm: 头V4 RSA/SHA512 Signature, 密钥 ID d88e42b4: NOKEY
准备中...                          ################################# [100%]
正在升级/安装...
   1:logstash-1:5.5.1-1               ################################# [100%]
Using provided startup.options file: /etc/logstash/startup.options
Successfully created system startup script for Logstash
[root@apache opt]# systemctl start logstash.service
[root@apache opt]# systemctl enable logstash.service
Created symlink from /etc/systemd/system/multi-user.target.wants/logstash.service to /etc/systemd/system/logstash.service.
#建立logstash软连接
[root@apache opt]# ln -s /usr/share/logstash/bin/logstash /usr/local/bin/
logstash(apache节点)与elasticsearch(node节点)做对接测试
bash
#这条命令是 Logstash 的最简测试指令,核心作用是:启动 Logstash 并配置一个 "从标准输入读取数据,再输出到标准输出" 的管道,用于快速验证 Logstash 是否能正常运行。
[root@apache ~]# logstash -e 'input { stdin{} } output { stdout{} }'
#输入www.baidu.com
www.baidu.com
2025-12-24T09:16:01.517Z apache www.baidu.com
#输入www.sina.com.cn
www.sina.com.cn
2025-12-24T09:16:18.867Z apache www.sina.com.cn
^C17:16:25.997 [SIGINT handler] WARN  logstash.runner - SIGINT received. Shutting down the agent.
17:16:26.013 [LogStash::Runner] WARN  logstash.agent - stopping pipeline {:id=>"main"}

[root@apache ~]# logstash -e 'input { stdin{} } output { stdout{ codec=>rubydebug} }'
ERROR StatusLogger No log4j2 configuration file found. Using default configuration: logging only errors to the console.
WARNING: Could not find logstash.yml which is typically located in $LS_HOME/config or /etc/logstash. You can specify the path using --path.settings. Continuing using the defaults
Could not find log4j2 configuration at path //usr/share/logstash/config/log4j2.properties. Using default config which logs to console
17:24:29.702 [[main]-pipeline-manager] INFO  logstash.pipeline - Starting pipeline {"id"=>"main", "pipeline.workers"=>4, "pipeline.batch.size"=>125, "pipeline.batch.delay"=>5, "pipeline.max_inflight"=>500}
The stdin plugin is now waiting for input:
17:24:29.741 [[main]-pipeline-manager] INFO  logstash.pipeline - Pipeline main started
17:24:29.832 [Api Webserver] INFO  logstash.agent - Successfully started Logstash API endpoint {:port=>9600}
#输入下面的地址
www.baidu.com
{
    "@timestamp" => 2025-12-24T09:24:37.282Z,
      "@version" => "1",
          "host" => "apache",
       "message" => "www.baidu.com"
}
^C17:24:40.435 [SIGINT handler] WARN  logstash.runner - SIGINT received. Shutting down the agent.
17:24:40.447 [LogStash::Runner] WARN  logstash.agent - stopping pipeline {:id=>"main"}

[root@apache ~]# logstash -e 'input { stdin{} } output { elasticsearch { hosts=>["192.168.108.41:9200"] } }'
ERROR StatusLogger No log4j2 configuration file found. Using default configuration: logging only errors to the console.
WARNING: Could not find logstash.yml which is typically located in $LS_HOME/config or /etc/logstash. You can specify the path using --path.settings. Continuing using the defaults
Could not find log4j2 configuration at path //usr/share/logstash/config/log4j2.properties. Using default config which logs to console
17:24:59.089 [[main]-pipeline-manager] INFO  logstash.outputs.elasticsearch - Elasticsearch pool URLs updated {:changes=>{:removed=>[], :added=>[http://192.168.108.41:9200/]}}
17:24:59.090 [[main]-pipeline-manager] INFO  logstash.outputs.elasticsearch - Running health check to see if an Elasticsearch connection is working {:healthcheck_url=>http://192.168.108.41:9200/, :path=>"/"}
17:24:59.185 [[main]-pipeline-manager] WARN  logstash.outputs.elasticsearch - Restored connection to ES instance {:url=>#<Java::JavaNet::URI:0x2a61472e>}
17:24:59.186 [[main]-pipeline-manager] INFO  logstash.outputs.elasticsearch - Using mapping template from {:path=>nil}
17:24:59.307 [[main]-pipeline-manager] INFO  logstash.outputs.elasticsearch - Attempting to install template {:manage_template=>{"template"=>"logstash-*", "version"=>50001, "settings"=>{"index.refresh_interval"=>"5s"}, "mappings"=>{"_default_"=>{"_all"=>{"enabled"=>true, "norms"=>false}, "dynamic_templates"=>[{"message_field"=>{"path_match"=>"message", "match_mapping_type"=>"string", "mapping"=>{"type"=>"text", "norms"=>false}}}, {"string_fields"=>{"match"=>"*", "match_mapping_type"=>"string", "mapping"=>{"type"=>"text", "norms"=>false, "fields"=>{"keyword"=>{"type"=>"keyword", "ignore_above"=>256}}}}}], "properties"=>{"@timestamp"=>{"type"=>"date", "include_in_all"=>false}, "@version"=>{"type"=>"keyword", "include_in_all"=>false}, "geoip"=>{"dynamic"=>true, "properties"=>{"ip"=>{"type"=>"ip"}, "location"=>{"type"=>"geo_point"}, "latitude"=>{"type"=>"half_float"}, "longitude"=>{"type"=>"half_float"}}}}}}}}
17:24:59.314 [[main]-pipeline-manager] INFO  logstash.outputs.elasticsearch - Installing elasticsearch template to _template/logstash
17:24:59.459 [[main]-pipeline-manager] INFO  logstash.outputs.elasticsearch - New Elasticsearch output {:class=>"LogStash::Outputs::ElasticSearch", :hosts=>[#<Java::JavaNet::URI:0x787eb578>]}
17:24:59.461 [[main]-pipeline-manager] INFO  logstash.pipeline - Starting pipeline {"id"=>"main", "pipeline.workers"=>4, "pipeline.batch.size"=>125, "pipeline.batch.delay"=>5, "pipeline.max_inflight"=>500}
17:24:59.485 [[main]-pipeline-manager] INFO  logstash.pipeline - Pipeline main started
The stdin plugin is now waiting for input:
17:24:59.652 [Api Webserver] INFO  logstash.agent - Successfully started Logstash API endpoint {:port=>9600}
#输入下面三个地址
www.baidu.com
www.360.cn
www.qq.com
^C17:25:45.945 [SIGINT handler] WARN  logstash.runner - SIGINT received. Shutting down the agent.
17:25:45.949 [LogStash::Runner] WARN  logstash.agent - stopping pipeline {:id=>"main"}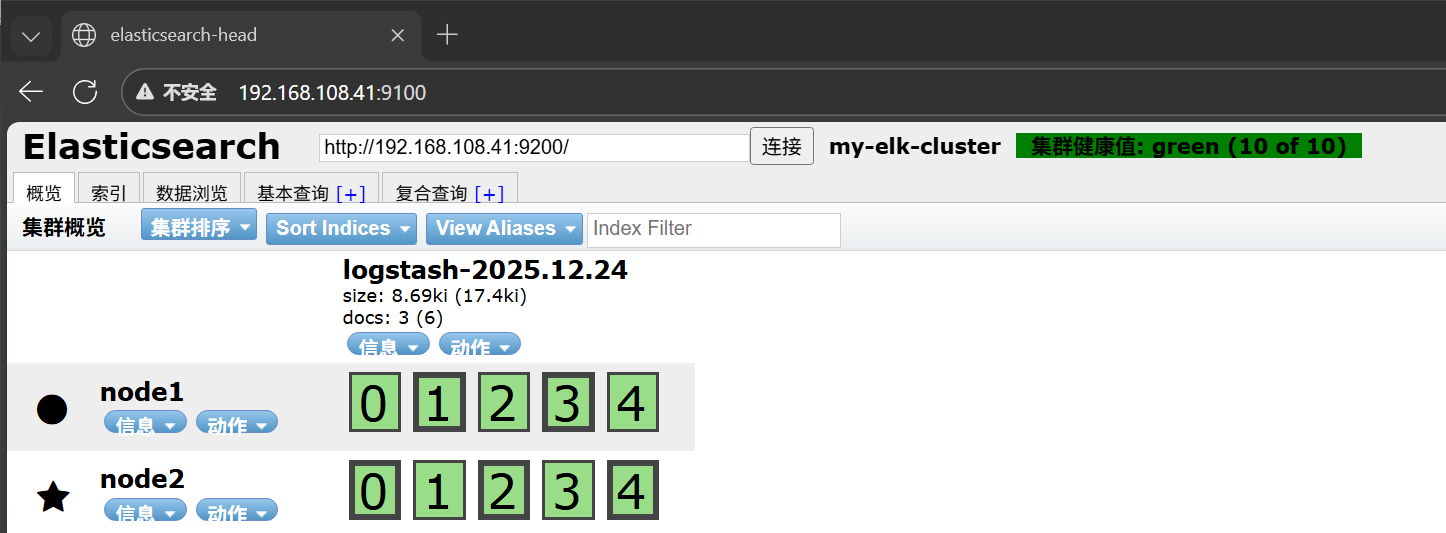
安装Kibana
Bash
#上传kibana-5.5.1-x86_64.rpm 到/usr/local/src目录
[root@node1 ~]# cd /usr/local/src/
[root@node1 src]# rpm -ivh kibana-5.5.1-x86_64.rpm
警告:kibana-5.5.1-x86_64.rpm: 头V4 RSA/SHA512 Signature, 密钥 ID d88e42b4: NOKEY
准备中...                          ################################# [100%]
正在升级/安装...
   1:kibana-5.5.1-1                   ################################# [100%]
[root@node1 src]# cd /etc/kibana/
[root@node1 kibana]# cp kibana.yml kibana.yml.bak
[root@node1 kibana]# vim kibana.yml
2 server.port: 5601
7 server.host: "0.0.0.0"
21 elasticsearch.url: "http://192.168.108.41:9200"
30 kibana.index: ".kibana"
[root@node1 kibana]# systemctl start kibana.service
[root@node1 kibana]# systemctl enable kibana.service
Created symlink from /etc/systemd/system/multi-user.target.wants/kibana.service to /etc/systemd/system/kibana.service.