一、环境介绍和准备工作
1.主机清单
| 职责 | ip地址 | 备注 |
|---|---|---|
| Prometheus服务器 | 192.168.92.11 | docker-compose模式的prometheus |
| 待监控springboot2+vue3+redis项目 | 192.168.92.13 | 待准备组件:docker+compose+node exporter |
Prometheus监控栈:Prometheus+Grafana+Alertmanager
2.准备工作
Docker Compose 部署 Prometheus + Alertmanager + Grafana,静态ip设置为192.168.92.11
Docker Compose部署SpringBoot2+Vue3+redis项目(Rockylinux9.6),静态ip设置为192.168.92.13
Prometheus服务器的树形包结构:
[root@localhost data]# tree
.
└── docker-prometheus
    ├── alertmanager
    │   └── config.yml
    ├── docker-compose.yaml
    ├── grafana
    │   ├── config.monitoring
    │   └── provisioning
    ├── grafana_plugins.txt
    └── prometheus
        ├── alert.yml
        └── prometheus.yml

5 directories, 6 files
创建备份prometheus.yml,原文件保持不变,因为我用Prometheus服务器监控过别的,现在重置一下
# 创建备份,原文件保持不变
cp prometheus.yml prometheus.yml.bak

#vi prometheus.yml(重置一下prometheus.yml)
# 全局配置
global:
  scrape_interval: 60s      # 将抓取间隔设置为每60秒一次。默认是每1分钟一次
  evaluation_interval: 60s  # 每60秒评估一次规则。默认是每1分钟一次

# Alertmanager 配置,告诉 Prometheus 把触发的告警发送到哪里
alerting:
  alertmanagers:
    - static_configs:
        - targets: ['alertmanager:9093']

# 告警规则文件配置
rule_files:
  - "alert.yml"

# 抓取配置(一共创建四个Prometheus监控项)
scrape_configs:
  # 1. Prometheus 自身监控,确保监控系统本身正常工作
  - job_name: 'prometheus'
    scrape_interval: 60s    # 覆盖全局默认值,每60秒从该作业中抓取一次目标
    static_configs:
      - targets: ['localhost:9090']

  # 2. Alertmanager 监控,alertmanager 是Docker容器名,需要在同一Docker网络
  - job_name: 'alertmanager'
    scrape_interval: 60s
    static_configs:
      - targets: ['alertmanager:9093']

  # 3. cAdvisor 容器监控,Google开发的容器监控工具
  - job_name: 'cadvisor'
    scrape_interval: 60s
    static_configs:
      - targets: ['cadvisor:8080']
        labels:
          instance: 'Prometheus服务器'

  # 4. Node Exporter 主机监控,监控Linux主机指标的工具
  - job_name: 'node-exporter'
    scrape_interval: 15s
    static_configs:
      - targets: ['node-exporter:9100']
        labels:
          instance: 'Prometheus服务器'
热加载一下:
curl -X POST http://localhost:9090/-/reload这样Prometheus服务器就设置好了
待监控springboot2+vue3+redis项目的树形包结构:
[root@localhost data]# tree
.
├── docker-compose
│   ├── backend
│   │   ├── Dockerfile
│   │   └── Springbootdemo-0.0.1-SNAPSHOT.jar
│   ├── docker-compose.yml
│   └── nginx
│       ├── dist
│       │   ├── assets
│       │   │   ├── 1-DxVeaUtM.jpg
│       │   │   ├── 2-U6Qjex4J.jpg
│       │   │   ├── chichi03-DW8jof7n.jpg
│       │   │   ├── index-CYqzScuv.js
│       │   │   └── index-Cp89o39-.css
│       │   ├── favicon.ico
│       │   └── index.html
│       └── nginx.conf
├── mysql
│   ├── data
│   └── init
│       └── init.sql
└── redis
    └── data

10 directories, 14 files
待监控springboot2+vue3+redis项目不用改
二、部署redis监控
1.监控redis,待监控Linux服务器(192.168.92.13)安装redis_exporter
二进制安装或者docker安装(或者docker-compose安装),此处选用docker-compose安装修改docker-compose.yaml文件
cd /data/docker-compose
vi docker-compose.yml
yaml文件增加redis_exporter组件
version: '3.3'

services:
  redis_exporter:
    image: oliver006/redis_exporter  # 使用最新版
    container_name: redis_exporter
    restart: always
    environment:
      - REDIS_ADDR=redis:6379  # 连接本地的Redis容器
      - REDIS_PASSWORD=  # 无密码
    ports:
      - "9121:9121"
    networks:
      - app-network  # 确保在同一个网络
    depends_on:
      - redis  # 确保redis先启动,如果 Redis 没启动,Redis Exporter 会启动失败或报连接错误
启动docker-compose.yml
docker-compose up -d访问redis_exporter
http://192.168.92.13:9121/metrics
2.prometheus服务器(192.168.92.11)添加redis_exporter的地址
192.168.92.11的prometheus上,修改prometheus的配置文件
#进入docker-prometheus目录
cd /data/docker-prometheus
#修改prometheus.yml
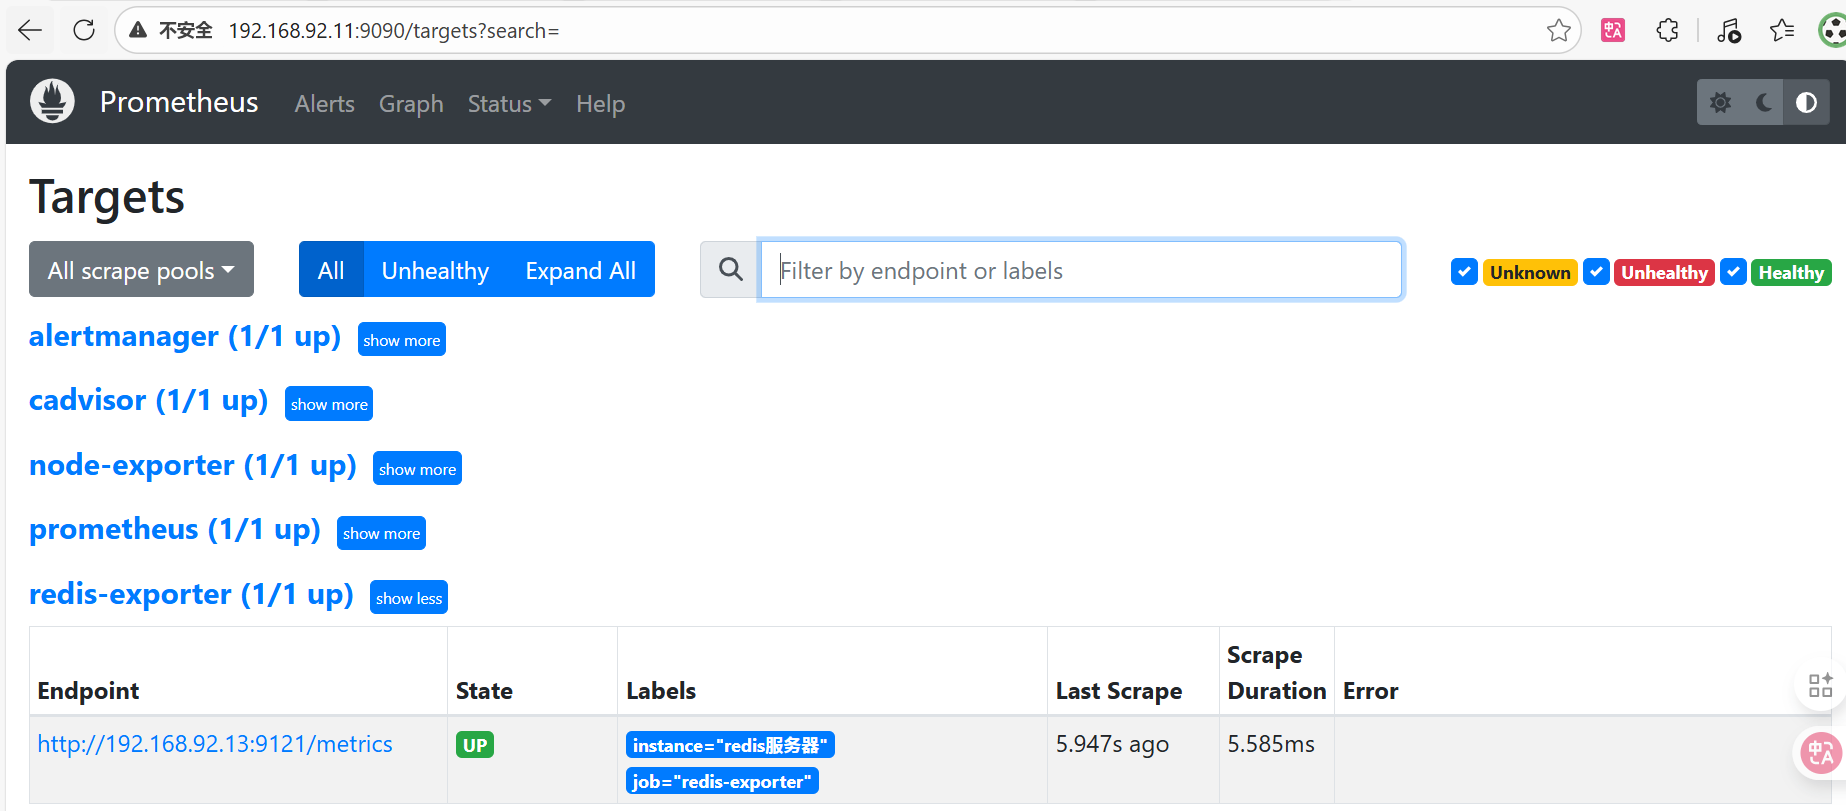
vi prometheus/prometheus.yml添加待监控的redis_exporter
- job_name: 'redis-exporter'
    static_configs:
      - targets: ['192.168.92.13:9121']
        labels:
          instance: 'redis服务器'
prometheus的热加载:
#在prometheus中执行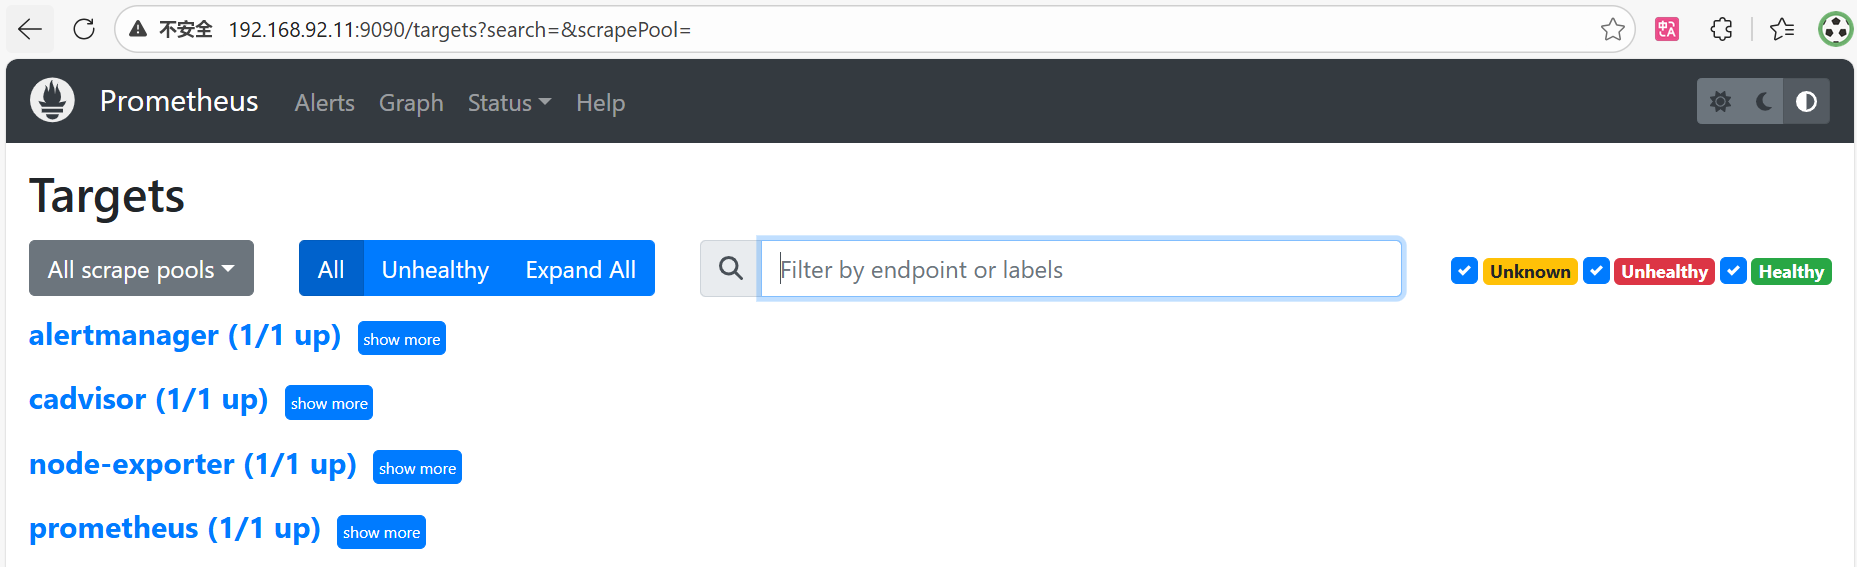
curl -X POST http://localhost:9090/-/reload刷新访问http://192.168.92.11:9090/targets?search=,确认新监控的redis服务器是否生效
3.redis服务器指标查询
redis_up 服务是否在线
redis_uptime_in_seconds 运行时长,单位s
rate(redis_cpu_sys_seconds_total[1m])+rate(redis_cpu_user_seconds_total[1m]) CPU使用时间
redis_memory_used_bytes 占用内存量
redis_memory_max_bytes 限制的最大内存
delta(redis_net_input_bytes_total[1m]) 网络接收的bytes
delta(redis_net_output_bytes_total[1m]) 网络发送的bytes
redis_connected_clients 客户端连接数
redis_connected_clients/redis_config_maxclients 连接数使用率
redis_rejected_connections_total 拒绝的客户端连接数
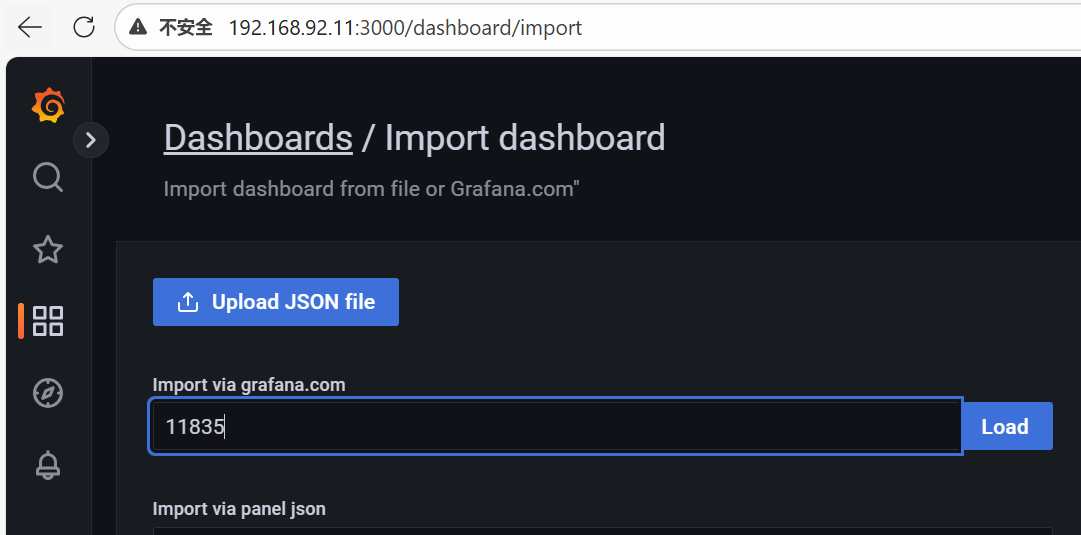
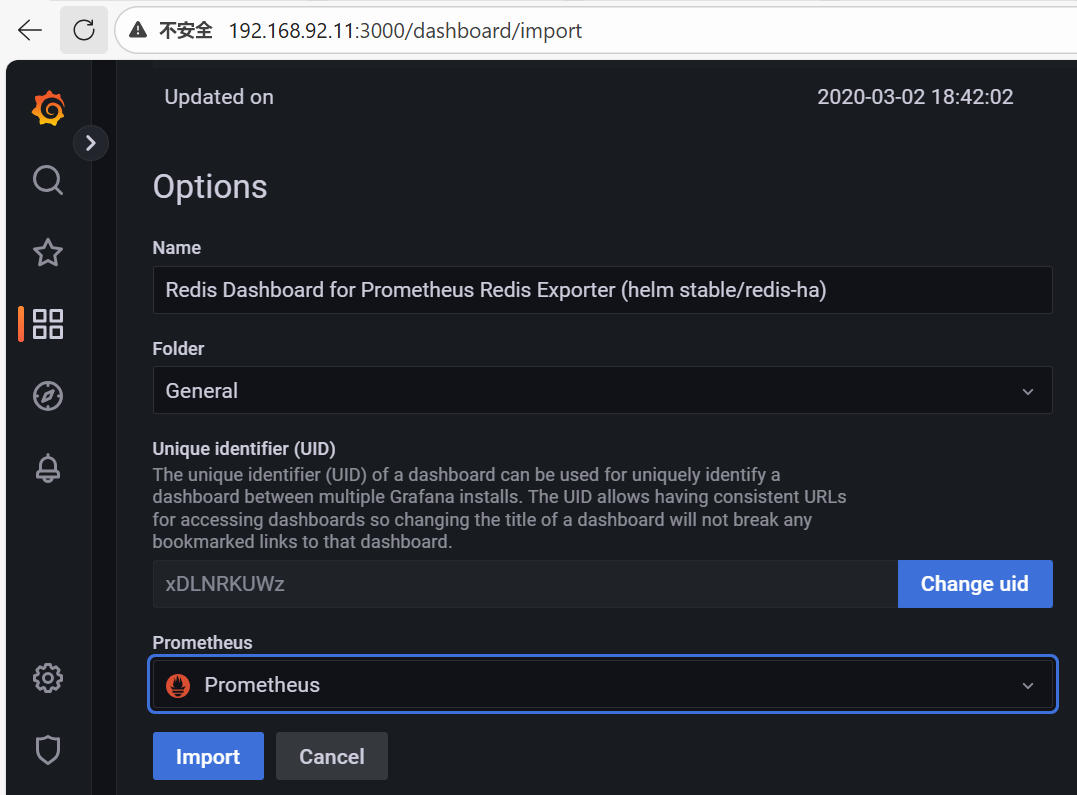
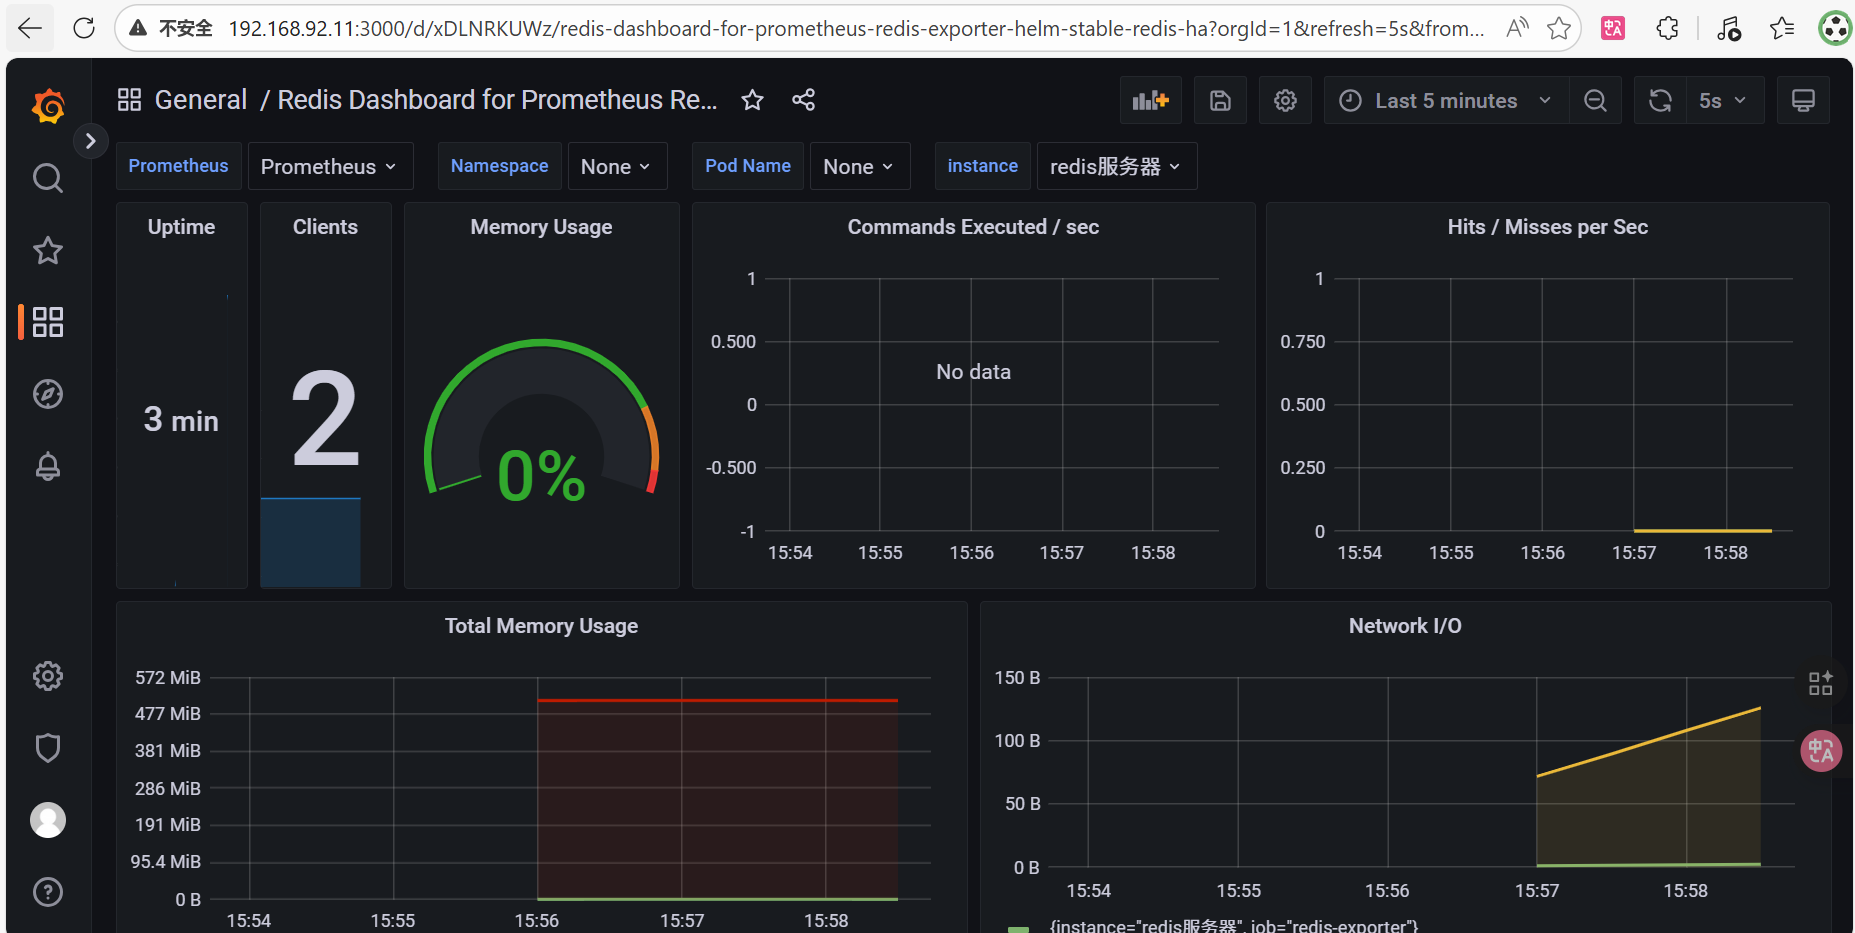
redis_connected_slaves slave连接数4.grafana中对redis进行监控
copy id to clipboard->grafana的dashboards中lmport dashboard
选一个redis的面板,复制id,我是用的id为11835的面板
grafana里导入这个面板,输入面板id导入
三、部署mysql监控
1.待监控Linux安装mysqld_exporter前准备工作,创建exporter账户
192.168.92.13机器
#进入mysql容器
docker exec -it mysql mysql -uroot -p123456

#创建exporter用户
CREATE USER 'exporter'@'%' IDENTIFIED BY '123456' WITH MAX_USER_CONNECTIONS 3;
GRANT PROCESS, REPLICATION CLIENT, SELECT ON *.* TO 'exporter'@'%';
#刷新权限
flush privileges;
#退出mysql容器
exit
#测试登录
docker exec -it mysql mysql -uexporter -p123456;
2.安装mysqld_exporter(基于mysql服务器的监控器)
二进制安装或者docker安装(或者docker-compose安装),此处选用docker-compose安装
192.168.92.13机器上,修改docker-compose.yaml文件
cd /data/docker-compose
vi docker-compose.yml
yaml文件增加mysqld_exporter组件
version: '3.3'  #Docker Compose 文件格式版本

services:
  mysqld-exporter:
    image: prom/mysqld-exporter:v0.12.1  #官方 Prometheus MySQL Exporter 镜像
    container_name: mysqld_exporter  #容器名称(便于管理)
    restart: always  #容器异常退出时自动重启
    command:
      - '--collect.info_schema.processlist'  # 收集活动连接和查询
      - '--collect.info_schema.innodb_metrics'  # InnoDB 引擎性能指标
      - '--collect.info_schema.tablestats'  # 表访问统计
      - '--collect.info_schema.tables'  #表大小/行数等元数据
      - '--collect.info_schema.userstats'  # 用户连接统计
      - '--collect.engine_innodb_status' # InnoDB 详细状态信息
    environment:
      DATA_SOURCE_NAME: 'exporter:123456@tcp(192.168.92.13:3306)/'
    networks:
      - app-network
    depends_on:
      - mysql
    ports:
      - "9104:9104"
启动docker-compose.yml
docker-compose up -d访问mysqld_exporter
http://192.168.92.13:9104/metrics
3.prometheus服务器添加mysqld_exporter的地址
192.168.92.11的prometheus上,修改prometheus的配置文件
#进入docker-prametheus目录
cd /data/docker-prometheus

#修改prometheus.yml
vi prometheus/prometheus.yml
添加待监控的mysqld_exporter
- job_name: 'mysqld-exporter'
  static_configs:
    - targets: ['192.168.92.13:9104']
      labels:
        instance: 'mysqld服务器'
保存配置后,让配置生效
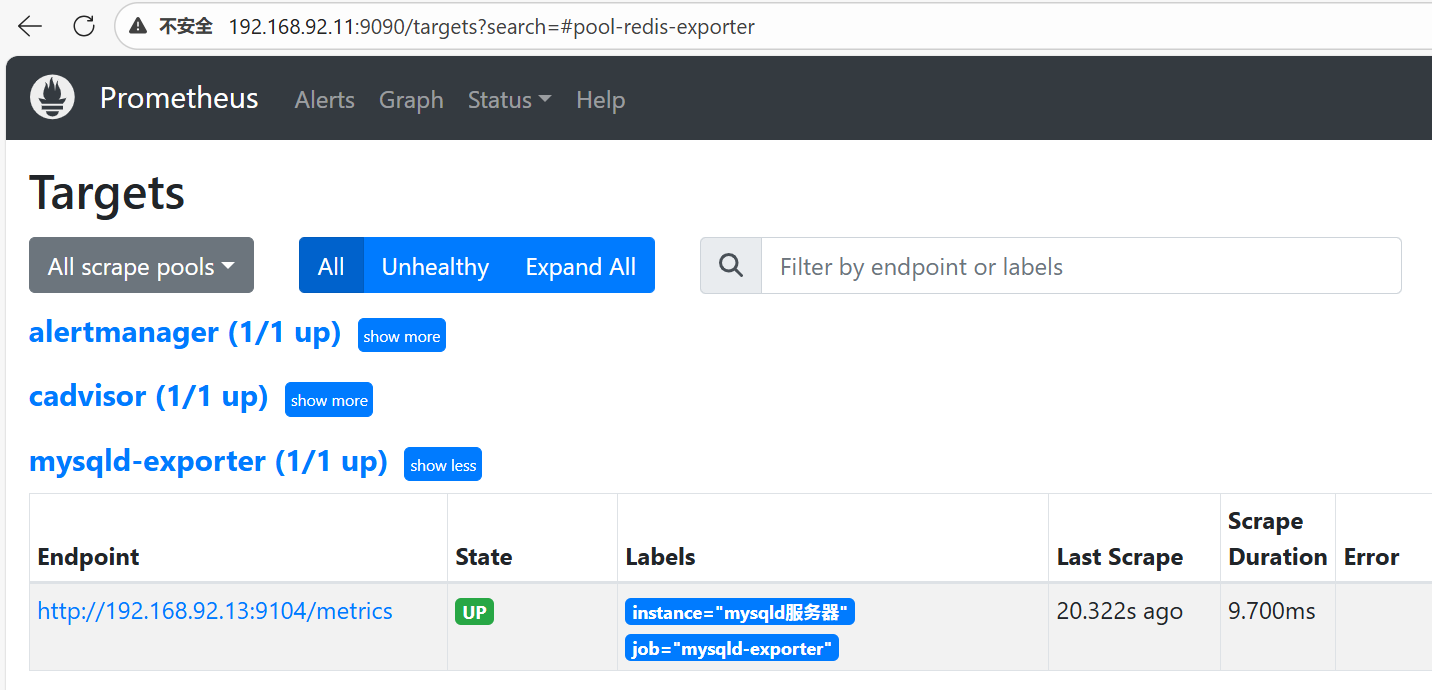
curl -X POST http://localhost:9090/-/reload刷新访问http://192.168.92.11:9090/targets?search=,确认新监控的mysqld服务器是否生效
4.mysql服务器指标查询
基础状态与连接
mysql_up: 服务是否在线(1为在线,0为离线)
mysql_global_status_uptime: 运行时长,单位秒(s)
mysql_global_status_threads_connected: 当前客户端建立连接数
mysql_global_variables_max_connections: 允许的最大连接数
mysql_global_status_threads_running: 正在运行命令的客户端数
网络流量
delta(mysql_global_status_bytes_received[1m]): 每分钟网络接收的字节数(bytes)
delta(mysql_global_status_bytes_sent[1m]): 每分钟网络发送的字节数(bytes)
客户端连接异常
delta(mysql_global_status_aborted_connects[1m]): 每分钟客户端建立连接失败的数量
delta(mysql_global_status_aborted_clients[1m]): 每分钟客户端未正常断开连接的数量
查询和命令处理
delta(mysql_global_status_commands_total{command="xx"}[1m]) > 0: 每分钟执行特定命令(将"xx"替换为具体命令)的次数
delta(mysql_global_status_handlers_total{handler="xx"}[1m]) > 0: 每分钟执行特定处理器操作(将"xx"替换为具体处理器)的次数
delta(mysql_global_status_table_locks_waited[1m]): 每分钟请求获取锁、但需要等待的次数
delta(mysql_global_status_handlers_total{handler="commit"}[1m]) > 0: 每分钟执行提交操作的次数
delta(mysql_global_status_table_locks_immediate[1m]): 每分钟请求获取锁并立即获得的次数
delta(mysql_global_status_queries[1m]): 每分钟查询数
delta(mysql_global_status_slow_queries[1m]): 每分钟慢查询数
InnoDB存储引擎相关
mysql_global_status_innodb_page_size: InnoDB数据页的大小
mysql_global_variables_innodb_buffer_pool_size: InnoDB缓冲池大小
mysql_global_status_buffer_pool_pages{state="data"}: 缓冲池中包含数据的页数
mysql_global_status_buffer_pool_dirty_pages: 缓冲池中的脏页数
InnoDB行锁指标
mysql_global_status_innodb_row_lock_current_waits: 当前正在等待的InnoDB行锁数量
mysql_global_status_innodb_row_lock_time: 从服务器启动以来的总InnoDB行锁等待时间(毫秒)
mysql_global_status_innodb_row_lock_time_avg: 每次等待InnoDB行锁的平均时间(毫秒)
mysql_global_status_innodb_row_lock_time_max: 单次等待InnoDB行锁的最长时间(毫秒)
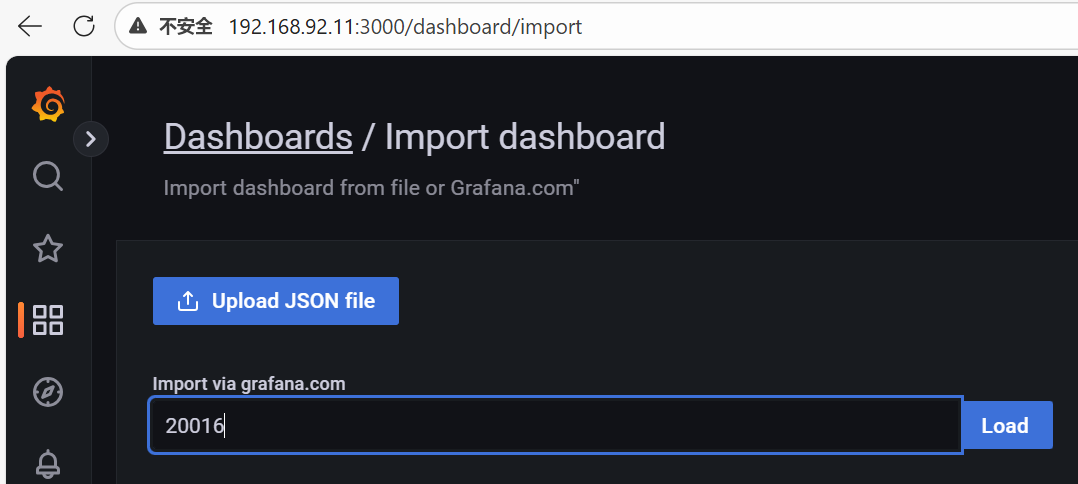
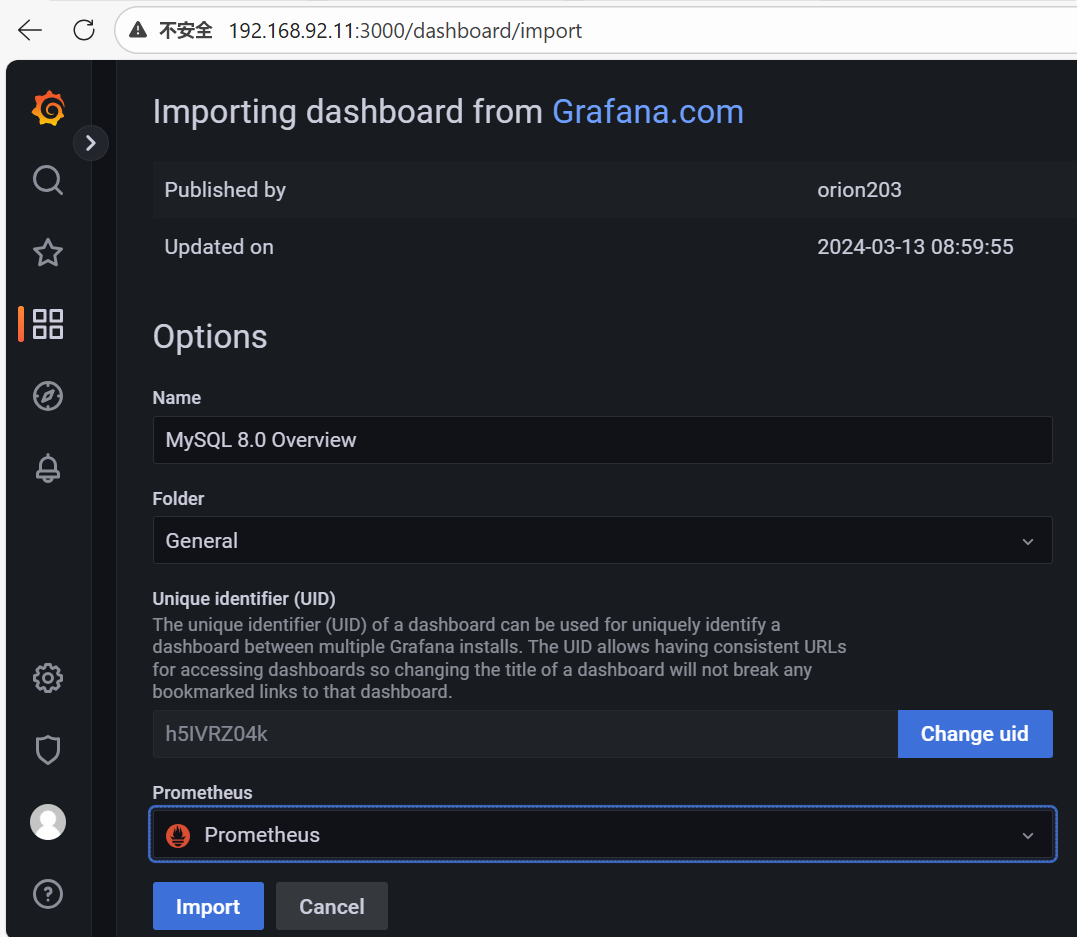
mysql_global_status_innodb_row_lock_waits: 从服务器启动以来的总InnoDB行锁等待次数5.grafana中对mysql进行监控
copy id to clipboard->grafana的dashboards中Import dashboard
https://grafana.com/grafana/dashboards/20016-mysql-8-0/
选一个mysql的面板,复制id,我是用的id为20016的面板
grafana里导入这个面板,输入面板id导入
四、部署springboot监控
1.让springboot程序抛出监控数据
我们会在spring boot 工程中引入micrometer-registry-prometheus、spring-boot starter.actuator来实现指标的暴露,下面对这两个组件进行一个介绍
micrometer-registry-prometheus Micrometer它是lava生态中一个组件,可以把它理解为metric界的SLF4j。
Micrometer 为 lava 平台上的性能数据收集提供了一个诵用的 AP!,它提供了多种度量指标 类型(Timers、Guauges、Counters等),同时支持接入不同的监控系统,例如 Influxdb、Graphite、Prometheus等。这里我们使用micrometer-registry-prometheus针 对prometheus的实现
spring-boot-starter-actuator Spring Boot Actuator是Spring Boot提供用于对应用系统进行自省和监控的功能模块,基于此开发人员可以方便地对应用系统某些监控指标进行查看、统计、审计、标收集等。Actuator提供了基于Http端点或JMX来管理和监视应用程序。
。添加pom.xml依赖
<dependency>
    <groupId>org.springframework.boot</groupId>
    <artifactId>spring-boot-starter-actuator</artifactId>
</dependency>
<dependency>
    <groupId>io.micrometer</groupId>
    <artifactId>micrometer-registry-prometheus</artifactId>
</dependency>
。修改application.yaml
增加监控端点
server:
  address: 0.0.0.0  # 允许所有IP访问
  port: 8080  # 建议明确指定端口
  # 开启tomcat指标
  tomcat:
    mbeanregistry:
      enabled: true

spring:
  application:
    name: springboot
  datasource:
    driver-class-name: com.mysql.cj.jdbc.Driver
    password: 123456
    url: jdbc:mysql://mysql:3306/big_event
    username: root
  data:
    redis:
      host: redis    # 改为服务器IP
      port: 6379

# 暴露actuator端点数据
management:
  endpoints:
    web:
      exposure:
        include: '*'
  metrics:
    tags:
      application: ${spring.application.name}

#开启驼峰命名和下划线命名的自动转化
mybatis:
  configuration:
    map-underscore-to-camel-case: true
。maven reload看有否工程maven加载报错
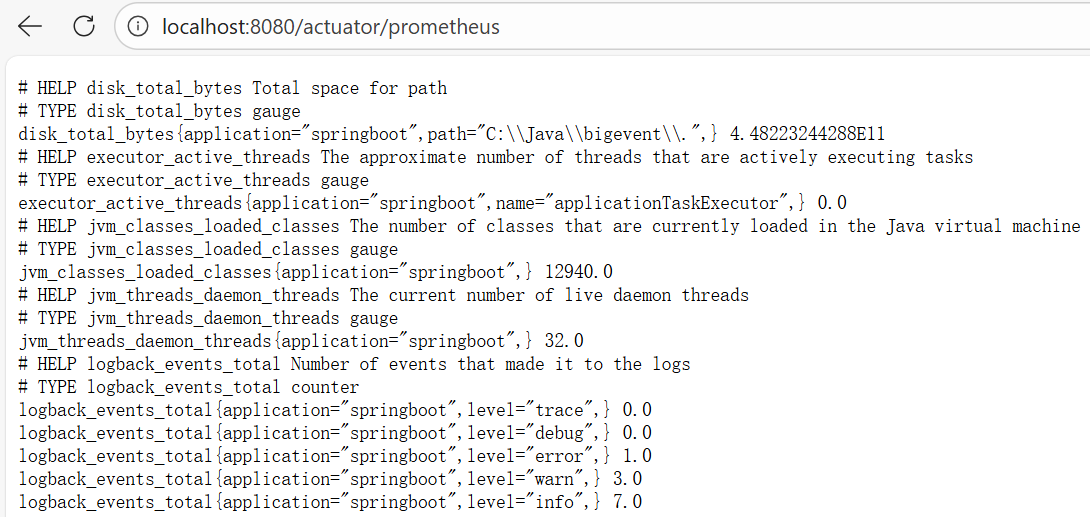
。本机运行springboot程序,访问端点数据
访问http://localhost:8080/actuator/prometheus接口,是否能获取相关指标
2.在individual_project虚拟机中部署springboot程序
部署openjdk-17
individual_project中,运行以下命令yum,需要安装openjdk(取决于本机编译用的是什么jdk版本如果本机用idk8,linux服务器也要装jdk8,以此类推)
# 安装Java 17(需要root权限)
sudo yum install -y java-17-openjdk.x86_64

#如果要装其他的版本,可以运行以下命令,从yum源中找到合适的jdk版本进行安装
yum search java|grep jdk

# 查看java版本(验证安装)
java -version
3. 运行springboot的jar包
修改后端拦截器
package com.chichi.config;

import com.chichi.interceptors.LoginInterceptor;
import org.springframework.beans.factory.annotation.Autowired;
import org.springframework.context.annotation.Configuration;
import org.springframework.web.servlet.config.annotation.InterceptorRegistry;
import org.springframework.web.servlet.config.annotation.WebMvcConfigurer;

@Configuration
public class WebConfig implements WebMvcConfigurer {
    @Autowired
    private LoginInterceptor loginInterceptor;

    @Override
    public void addInterceptors(InterceptorRegistry registry) {
        //拦截器,除了请求和和登录路径不拦截
        registry.addInterceptor(loginInterceptor).excludePathPatterns("/user/login", "/user/register","/actuator/**","/error");
    }
}
maven package打包,资源管理器中生成一个Springbootdemo-0.0.1-SNAPSHOT.jar文件
上传这个jar文件到individual_project虚拟机的/data/docker-compose/backend目录
修改nginx.conf,增加对/actuator的代理
[root@localhost nginx]# cat nginx.conf
worker_processes  1;

events {
    worker_connections  1024;
}

http {
    include       mime.types;
    default_type  application/octet-stream;
    sendfile        on;
    keepalive_timeout  65;

    # 可选:配置日志格式和路径,方便排查
    log_format  main  '$remote_addr - $remote_user [$time_local] "$request" '
                      '$status $body_bytes_sent "$http_referer" '
                      '"$http_user_agent" "$http_x_forwarded_for"';
    access_log  /var/log/nginx/access.log  main;

    server {
        listen  80; #监听 80 端口(HTTP)。
        server_name  192.168.92.13; #匹配的域名或IP。你填写的 192.168.92.13 是宿主机IP,确保你能通过该IP访问。容器内通信不依赖此。

        # 【规则一:静态文件服务】- 处理前端文件 (html, css, js, images等)
        # 根目录设置为前端 dist 文件夹
        root   /usr/share/nginx/html; #静态文件的根目录。必须与 docker-compose.yml 中 Nginx 的挂载卷 - ./nginx/dist:/usr/share/nginx/html:ro 完全对应。

        # 默认首页文件
        index  index.html index.htm; #当访问 http://192.168.92.13/ 时,会自动寻找并返回 index.html。

        # 【关键指令】用于支持前端路由(如 Vue Router 的 history 模式)
        # 当请求的文件或目录不存在时,将请求重写到 index.html,由前端框架处理路由
        try_files $uri $uri/ /index.html;

        # 【规则二:API 代理】- 将以 /api 开头的请求转发到后端
        location /api/ {
            # 跨域处理(考虑到你可能直接调试后端接口,保留此配置)
            add_header 'Access-Control-Allow-Origin' '$http_origin' always; # 动态匹配来源,更安全
            add_header 'Access-Control-Allow-Methods' 'GET, POST, OPTIONS, PUT, DELETE, PATCH' always;
            add_header 'Access-Control-Allow-Headers' 'DNT,User-Agent,X-Requested-With,If-Modified-Since,Cache-Control,Content-Type,Range,Authorization' always;
            add_header 'Access-Control-Allow-Credentials' 'true' always; # 如需携带Cookie

            # 处理 OPTIONS 预检请求
            if ($request_method = 'OPTIONS') {
                add_header 'Access-Control-Max-Age' 1728000;
                add_header 'Content-Type' 'text/plain; charset=utf-8';
                add_header 'Content-Length' 0;
                return 204;
            }

            # 核心代理设置
            proxy_pass http://springboot:8080/; #springboot是你的 Spring Boot 服务在 Docker Compose 网络中的服务名。
            proxy_set_header Host $host;
            proxy_set_header X-Real-IP $remote_addr;
            proxy_set_header X-Forwarded-For $proxy_add_x_forwarded_for;
            proxy_set_header X-Forwarded-Proto $scheme;

            # 可选:超时设置
            proxy_connect_timeout 75s;
            proxy_read_timeout 300s;
        }

        # 【规则二:Actuator 端点代理】
        location /actuator/ {
            # 核心代理设置
            proxy_pass http://springboot:8080/actuator/;
            proxy_set_header Host $host;
            proxy_set_header X-Real-IP $remote_addr;
            proxy_set_header X-Forwarded-For $proxy_add_x_forwarded_for;
            proxy_set_header X-Forwarded-Proto $scheme;

            # 超时设置
            proxy_connect_timeout 75s;
            proxy_read_timeout 300s;
        }

        # 【可选规则:代理其他路径】如果你还有其他后端服务,可以继续添加
        # location /other-service/ {
        #     proxy_pass http://other-service:8081;
        #     ... 类似配置 ...
        # }
        # 错误页面
        error_page   500 502 503 504  /50x.html;
        location = /50x.html {
            root   html;
        }
    }
}
[root@localhost nginx]#
启动docker-compose
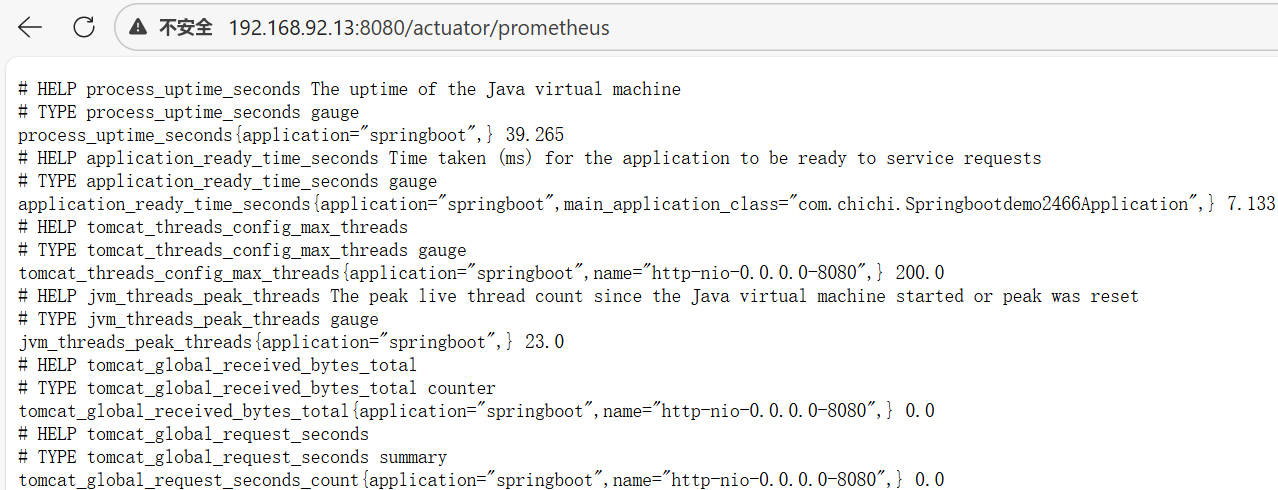
docker-compose up -d浏览器中访问http://192.168.92.13:8080/actuator/prometheus,确认可以采集到数据
4.prometheus中配置springboot的监控节点
增加监控节点
在prometheus.yml文件中进行配置业务系统采集点,5s拉取一次指标,由于Prometheus server部要在docker 中,所以访问主机IP 用individual_project的ip
192.168.92.11的prometheus上,修改prometheus的配置文件
#进入docker-prometheus日录
cd /data/docker-prometheus

#修改prometheus.yml
vi prometheus/prometheus.yml
添加待监控的springboot监控
- job_name: 'springBoot'  #监控任务名称,自定义标识
  scrape_interval: 5s  #采集间隔,每5秒采集一次指标
  metrics_path: '/actuator/prometheus'  #指标路径,Spring Boot Actuator的Prometheus端点
  static_configs:
    - targets: ['192.168.92.13:8080']  #要监控的目标地址和端口
      labels:
        instance: 'springboot服务器'  #为这个目标添加标签,便于识别
保存配置后,让配置生效
批prometheus中执行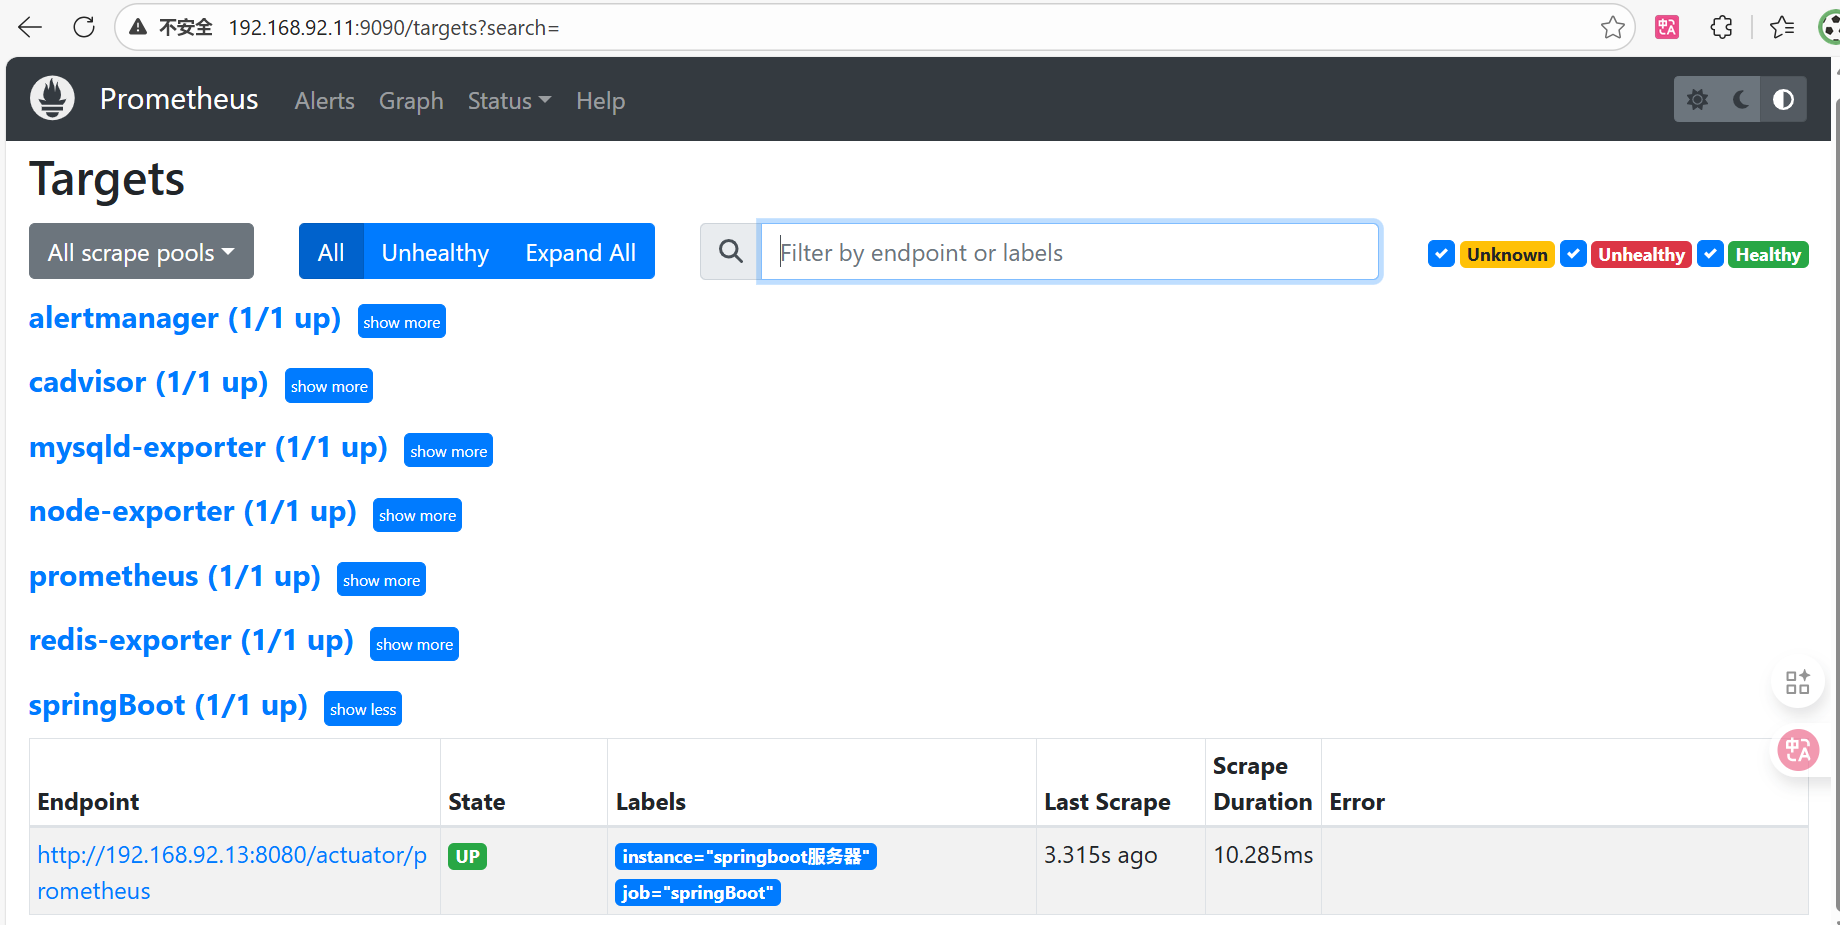
curl -X POST http://localhost:9090/-/reload刷新访问http://192.168.92.11:9090/targets?search=、确认新监控的springboot服务器是否生效
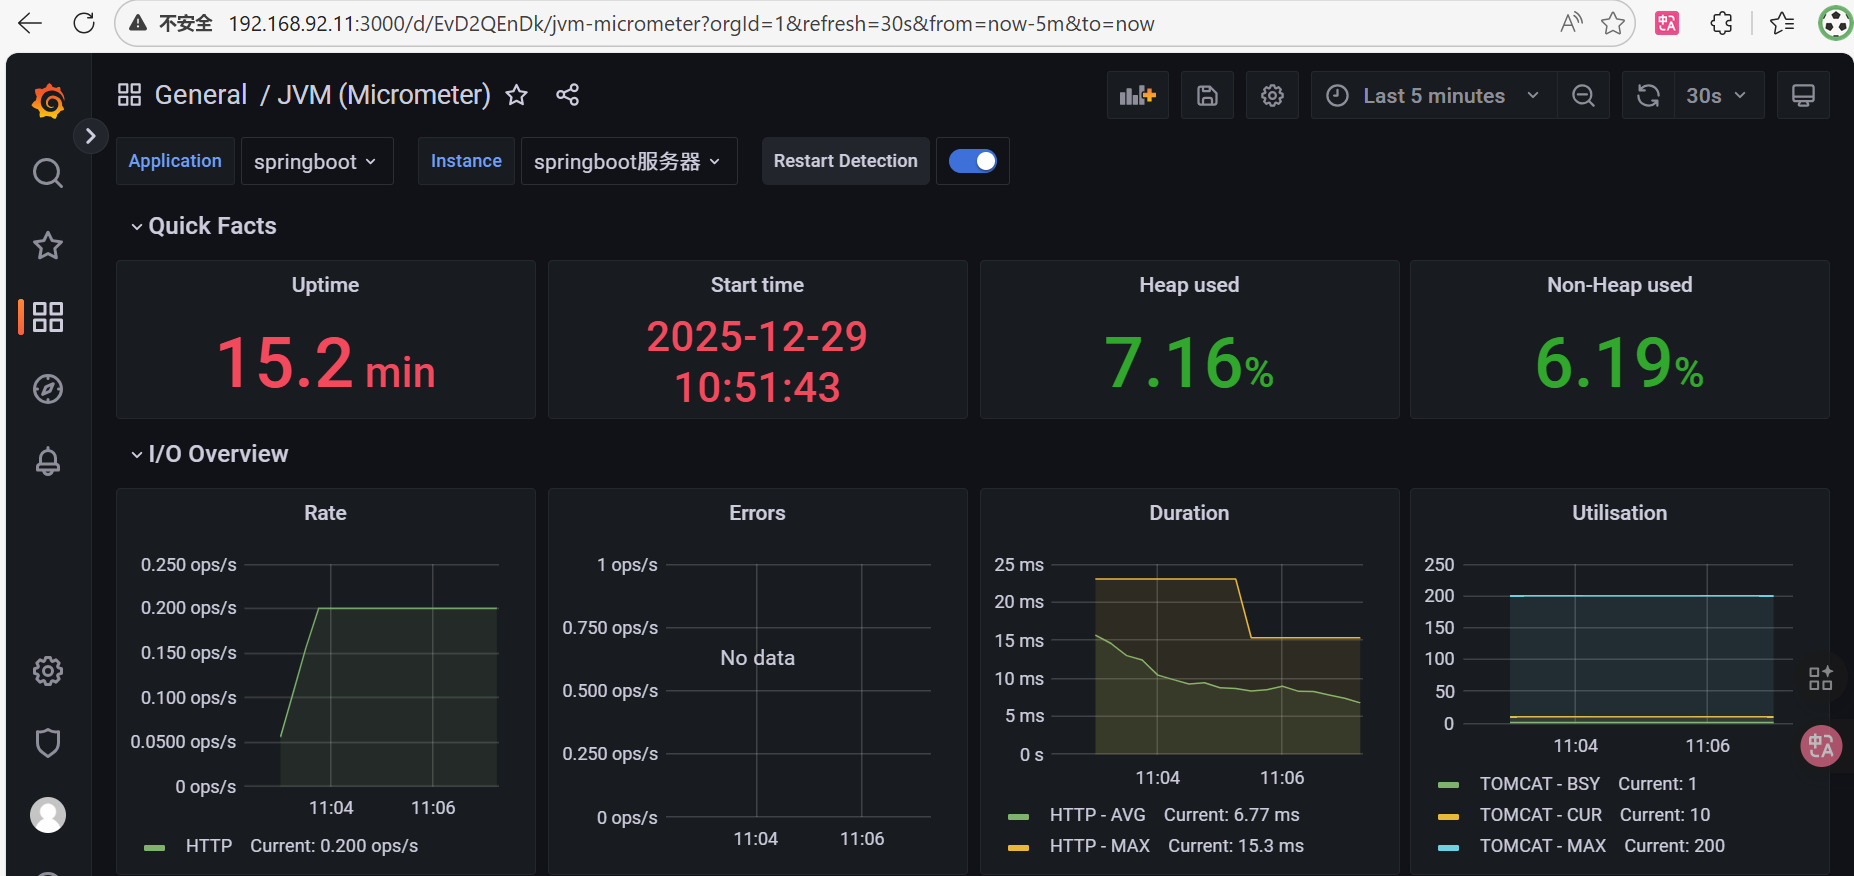
5.springboot监控指标查询
HTTP请求
http_server_requests_seconds_count: 请求次数统计
http_server_requests_seconds_max: 单次HTTP请求耗时峰值(秒)
http_server_requests_seconds_sum: 所有HTTP请求累计耗时(秒)
JVM缓冲区
jvm_buffer_count_buffers: 缓冲区数量
jvm_buffer_memory_used_bytes: 缓冲区内存使用大小(字节)
jvm_buffer_total_capacity_bytes: 缓冲区总容量大小(字节)
类信息
jvm_classes_loaded_classes: 当前已加载类的数量
jvm_classes_unloaded_classes_total: 已卸载类的总数
内存信息
jvm_memory_committed_bytes: JVM已提交内存大小(字节)
jvm_memory_max_bytes: JVM最大可用内存大小(字节)
jvm_memory_used_bytes: JVM当前已使用内存大小(字节)
GC信息
jvm_gc_live_data_size_bytes: GC后存活数据大小(字节)
jvm_gc_max_data_size_bytes: GC处理的最大数据量(字节)
jvm_gc_memory_allocated_bytes_total: GC期间分配的内存总量(字节)
jvm_gc_memory_promoted_bytes_total: 晋升到老年代的内存总量(字节)
jvm_gc_pause_seconds: GC暂停时间总计(秒)
jvm_gc_pause_seconds_max: 最大GC暂停时间(秒)
线程信息
jvm_threads_daemon_threads: 守护线程数
jvm_threads_live_threads: 存活线程数
jvm_threads_peak_threads: 峰值线程数
jvm_threads_states_threads{state="RUNNABLE"}: 不同状态下的线程数(如RUNNABLE状态)
Tomcat信息
tomcat_threads_busy_threads: 忙碌的线程数
tomcat_threads_config_max_threads: 配置的最大线程数
tomcat_threads_current_threads: 当前线程数
tomcat_global_error_total: 总体报错数
tomcat_global_received_bytes_total: 接收的字节总数
tomcat_global_sent_bytes_total: 发出的字节总数
tomcat_global_request_max_seconds: 每秒最大请求数
tomcat_global_request_seconds: 每秒请求数
tomcat_sessions_active_current_sessions: 当前活跃会话数
tomcat_sessions_active_max_sessions: 活跃会话的最大数量
tomcat_sessions_alive_max_seconds: 会话活跃的最长时间(秒)
tomcat_sessions_created_sessions_total: 累计创建的会话数
tomcat_sessions_expired_sessions_total: 累计失效的会话数
tomcat_sessions_rejected_sessions_total: 累计拒绝的会话数
进程信息
process_cpu_usage: CPU使用率
process_files_max_files: 可用的最大文件描述符数
process_files_open_files: 当前打开的文件描述符数
process_start_time_seconds: 进程启动时刻(自纪元以来的秒数)
process_uptime_seconds: 进程运行时间(秒)
系统信息
system_cpu_count: CPU核心数
system_cpu_usage: 系统CPU使用情况
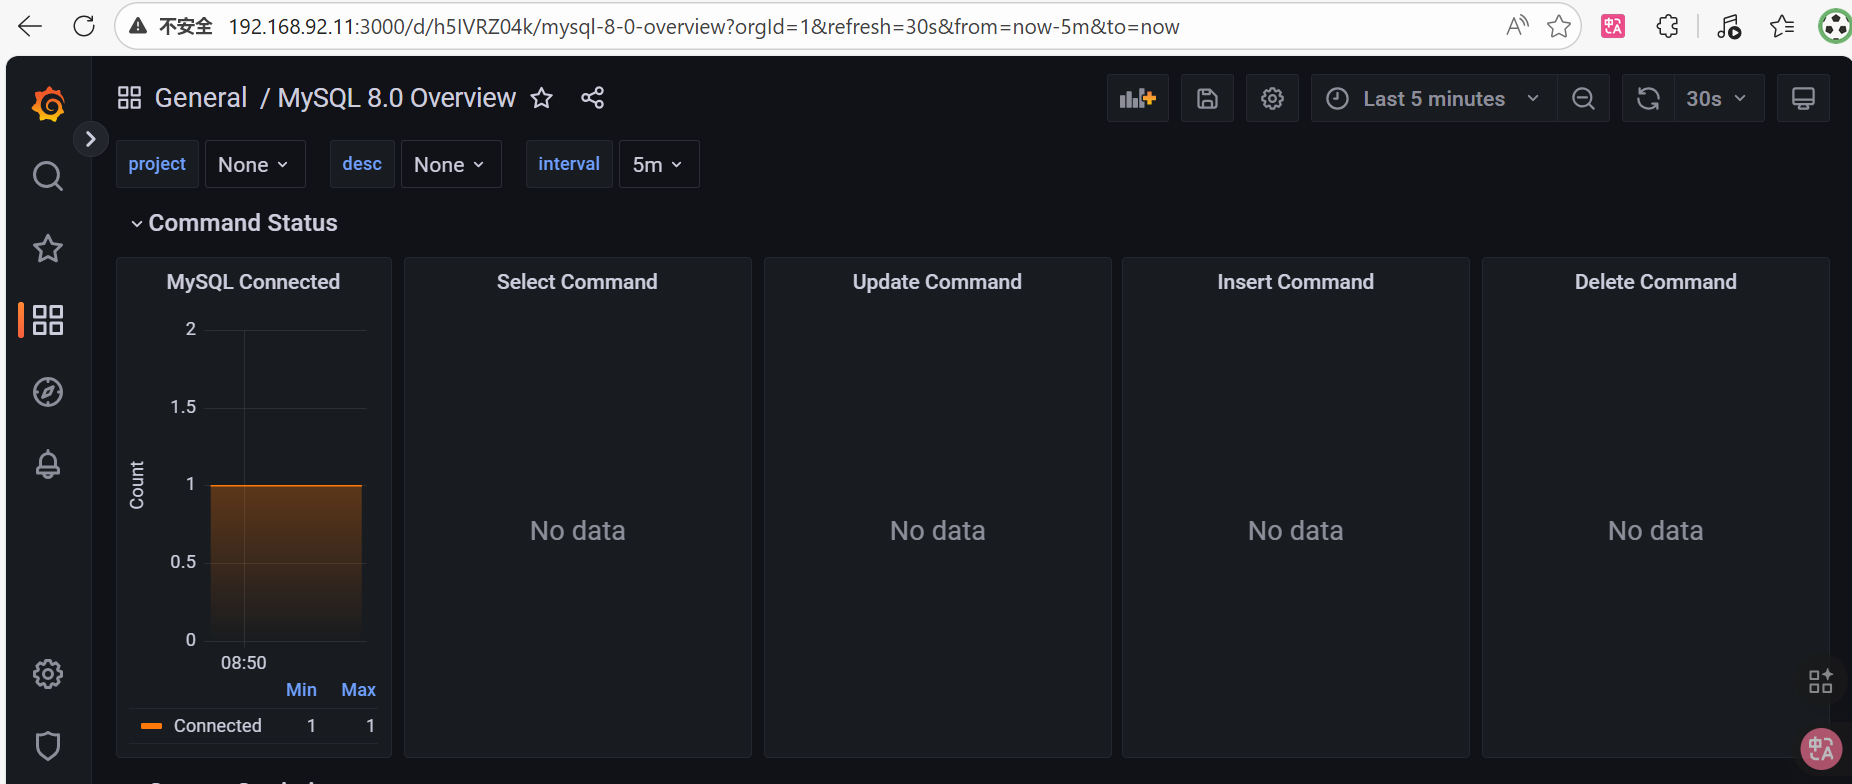
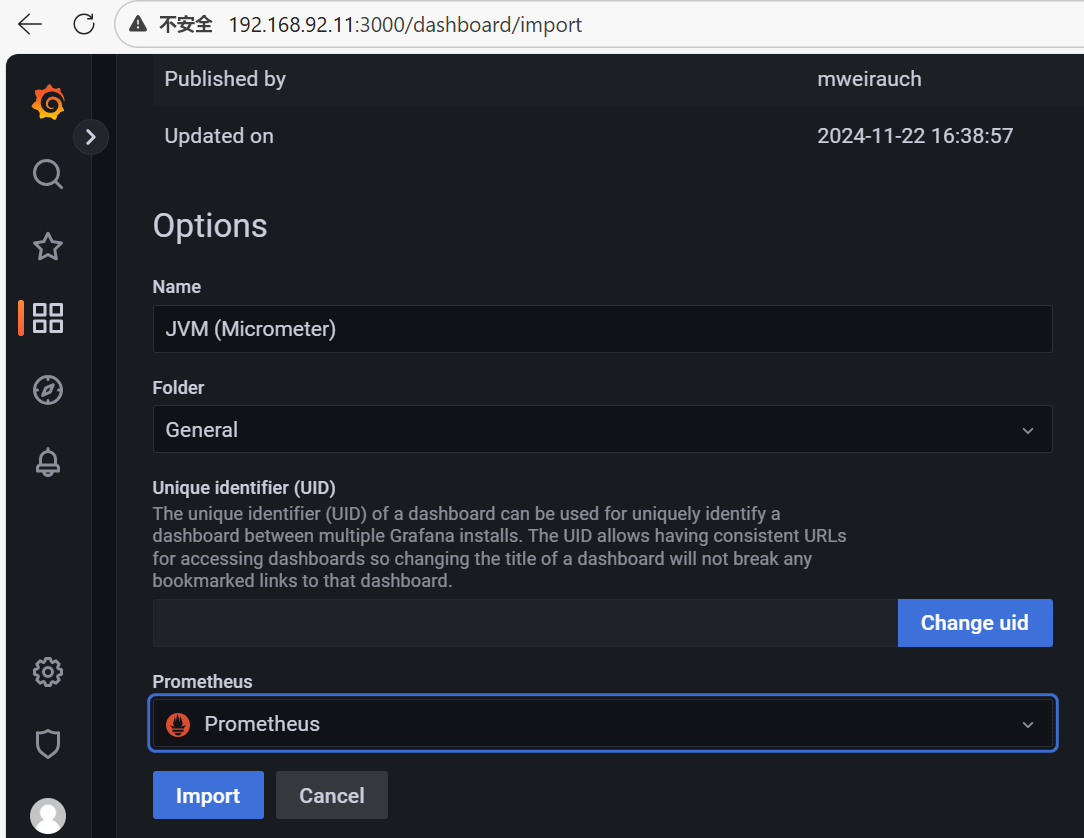
system_load_average_1m: 系统平均负载(过去1分钟)6.grafana中添加springboot的监控模板
copy id to clipboard->grafana的dashboards中Import dashboard
https://grafana.com/grafana/dashboards/4701-jvm-micrometer/
选一个springboot的面板,复制id,我是用的id为4701的面板
grafana里导入这个面板,输入面板id导入

五、部署nginx监控
1.nginx开启监控
检查是否有开启stub_status模块
#尝试在名为 nginx 的 Docker 容器中执行命令以获取 Nginx 的版本信息。
#进入容器
docker exec -it nginx nginx -V 2>&1 |grep -o with-http_stub_status_module
开启stub_status
vi /data/docker-compose/nginx/nginx.conf
[root@localhost nginx]# cat nginx.conf
worker_processes  1;

events {
    worker_connections  1024;
}

http {
    include       mime.types;
    default_type  application/octet-stream;
    sendfile        on;
    keepalive_timeout  65;

    # 可选:配置日志格式和路径,方便排查
    log_format  main  '$remote_addr - $remote_user [$time_local] "$request" '
                      '$status $body_bytes_sent "$http_referer" '
                      '"$http_user_agent" "$http_x_forwarded_for"';
    access_log  /var/log/nginx/access.log  main;

    server {
        listen  80; #监听 80 端口(HTTP)。
        server_name  192.168.92.13 localhost; #匹配的域名或IP。你填写的 192.168.92.13 是宿主机IP,确保你能通过该IP访问。容器内通信不依赖此。

        # 【关键修改】:将前端路由配置放在 location / 块内
        # 这样其他 location 块(如 /api, /actuator, /stub_status)不会被前端路由干扰
        location / {
            root   /usr/share/nginx/html;
            index  index.html index.htm;
            # 只有访问前端页面时,找不到文件才重写到 index.html
            try_files $uri $uri/ /index.html;
        }

        location /api/ {
            # 跨域处理(考虑到你可能直接调试后端接口,保留此配置)
            add_header 'Access-Control-Allow-Origin' '$http_origin' always; # 动态匹配来源,更安全
            add_header 'Access-Control-Allow-Methods' 'GET, POST, OPTIONS, PUT, DELETE, PATCH' always;
            add_header 'Access-Control-Allow-Headers' 'DNT,User-Agent,X-Requested-With,If-Modified-Since,Cache-Control,Content-Type,Range,Authorization' always;
            add_header 'Access-Control-Allow-Credentials' 'true' always; # 如需携带Cookie

            # 处理 OPTIONS 预检请求
            if ($request_method = 'OPTIONS') {
                add_header 'Access-Control-Max-Age' 1728000;
                add_header 'Content-Type' 'text/plain; charset=utf-8';
                add_header 'Content-Length' 0;
                return 204;
            }

            # 核心代理设置
            proxy_pass http://springboot:8080/; #springboot是你的 Spring Boot 服务在 Docker Compose 网络中的服务名。
            proxy_set_header Host $host;
            proxy_set_header X-Real-IP $remote_addr;
            proxy_set_header X-Forwarded-For $proxy_add_x_forwarded_for;
            proxy_set_header X-Forwarded-Proto $scheme;

            # 可选:超时设置
            proxy_connect_timeout 75s;
            proxy_read_timeout 300s;
        }

        # 【规则二:Actuator 端点代理】
        location /actuator/ {
            # 核心代理设置
            proxy_pass http://springboot:8080/actuator/;
            proxy_set_header Host $host;
            proxy_set_header X-Real-IP $remote_addr;
            proxy_set_header X-Forwarded-For $proxy_add_x_forwarded_for;
            proxy_set_header X-Forwarded-Proto $scheme;

            # 超时设置
            proxy_connect_timeout 75s;
            proxy_read_timeout 300s;
        }

       # 新增以下配置
       location = /stub_status {  #/stub_status 是监控端点路径,使用精确匹配(=),提高优先级
           stub_status on; #启用 Nginx 基础状态监控
           access_log off; #关闭访问日志,监控端点通常被高频访问(如Prometheus每15秒采集一次),关闭日志可以提高性能
       # allow nginx exporter的ip;
           allow all;
           # 设置响应类型为纯文本
           default_type text/plain;
           charset utf-8;

           # 防止浏览器缓存
           add_header Cache-Control "no-store, no-cache, must-revalidate";
           add_header Pragma "no-cache";
           add_header Expires "0";

           # 添加安全头,可能阻止某些前端路由行为
           add_header X-Content-Type-Options "nosniff";
           add_header X-Frame-Options "DENY";
           add_header X-XSS-Protection "1; mode=block";
           add_header Content-Security-Policy "default-src 'self'; script-src 'none'";
        }
        # 【可选规则:代理其他路径】如果你还有其他后端服务,可以继续添加
        # location /other-service/ {
        #     proxy_pass http://other-service:8081;
        #     ... 类似配置 ...
        # }
        # 错误页面
        error_page   500 502 503 504  /50x.html;
        location = /50x.html {
            root   html;
        }
    }
}
[root@localhost nginx]#
重新加载nginx
docker restart nginx检查stub_status的暴露数据
http://192.168.92.13:80/stub_status

#参数解释
Active connections(活动连接数)
accepts(接收连接数)
handled(成功处理连接数)
requests(总请求数)
Reading(读操作连接数)
Writing(写操作连接数)
Waiting(等待连接数)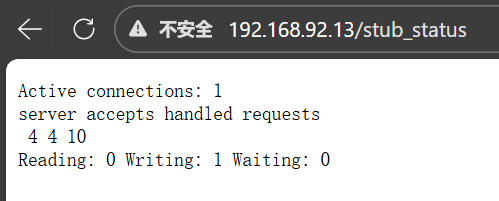
2.待监控Linux(individual_project服务器)安装nginx_exporter
二进制安装或者docker安装(或者docker-compose安装),此处选用docker-compose安装
individual_project机器上,修改docker-compose.yaml文件
cd /data/docker-compose
vi docker-compose.yml
yml文件增加nginx_exporter组件(nginx监控器)
version: '3.3'  #Docker-Compose 文件格式版本
services: #开始定义服务(容器)部分
  nginx-exporter: #定义一个名为 "nginx-exporter" 的服务
    image: nginx/nginx-prometheus-exporter:0.11 #使用的Docker镜像
    container_name: nginx-exporter #容器名称
    hostname: nginx_exporter #容器内部主机名
    command:
      - '-nginx.scrape-uri=http://192.168.92.13/stub_status' #作用:告诉 exporter 从哪里获取 Nginx 状态信息
    restart: always #确保服务在崩溃或服务器重启后自动恢复
    ports: #宿主机端口:容器内部端口
      - "9113:9113"
启动docker-compose.yml
docker-compose up -d访问nginx_exporter
http://192.168.92.13:9113/metrics3.prometheus服务器添加nginx_exporter的地址
192.168.92.11的prometheus上,修改prometheus的配置文件
#进入docker-prometheus目录
cd /data/docker-prometheus

#修改prometheus.yml
vi prometheus/prometheus.yml
添加待监控的nginx_exporter
- job_name: 'nginx-exporter' #定义监控任务的名称
  static_configs: #静态目标配置(固定IP/域名)
    - targets: ['192.168.92.13:9113']
      labels: #为目标添加自定义标签
        instance: 'nginx服务器'
保存配置后,让配置生效
#prometheus中执行
curl -X POST http://localhost:9090/-/reload刷新访问http://192.168.92.11:9090/targets?search=,确认新监控的nginx服务器是否生效
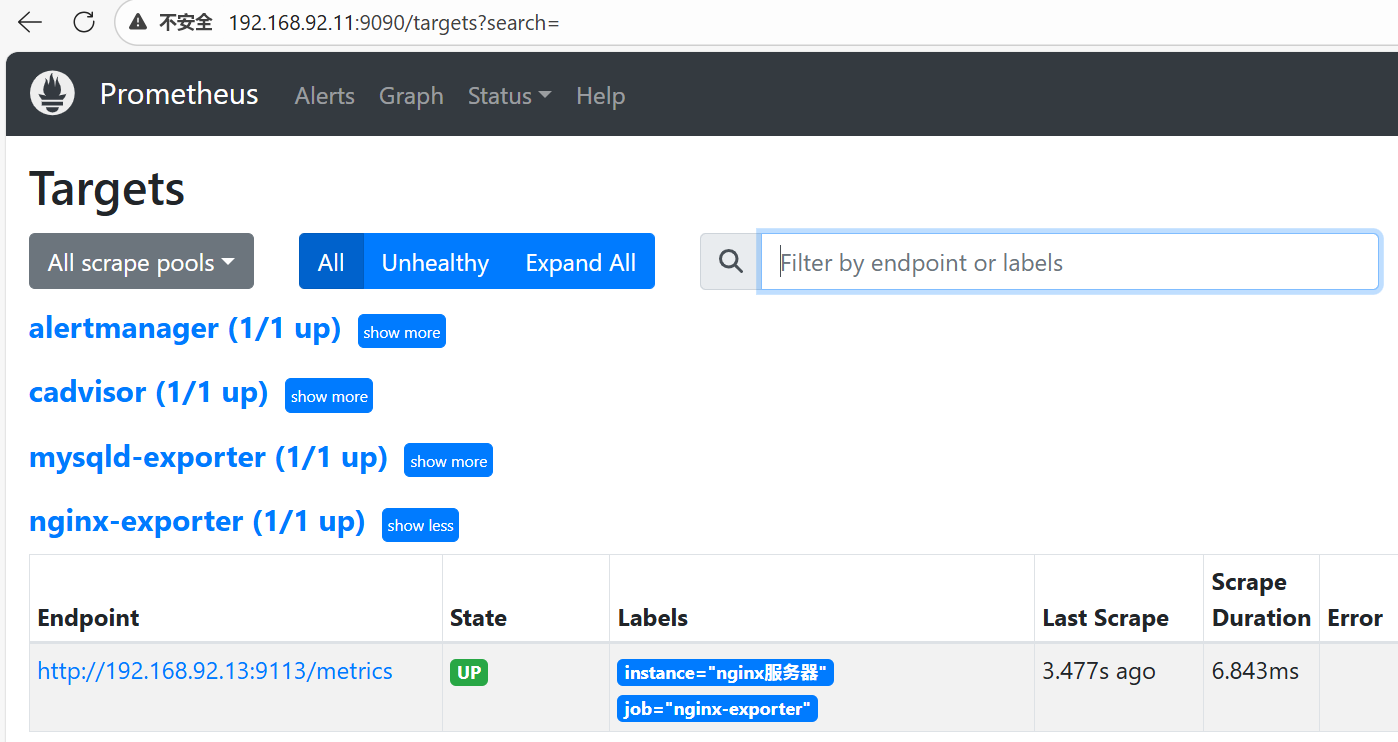
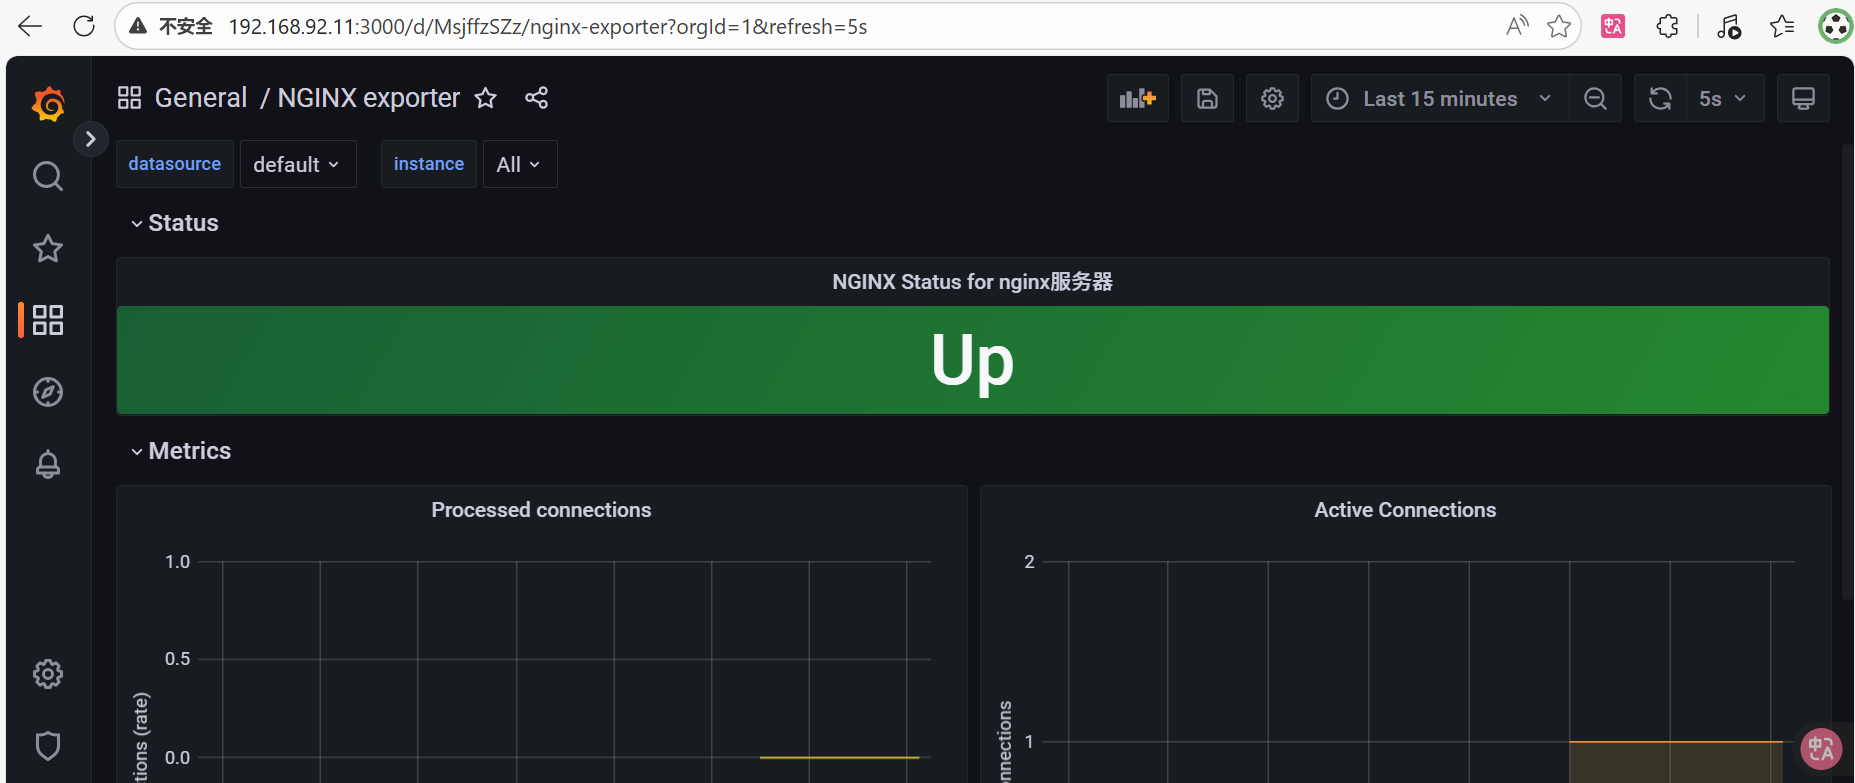
4.nginx监控指标
nginx_connections_accepted
接收的连接总数
(对应 stub_status 中的 accepts 指标)

nginx_connections_handled
成功处理的连接总数
(对应 stub_status 中的 handled 指标)

nginx_connections_active
当前活跃连接总数
(对应 stub_status 中的 Active connections)

nginx_connections_reading
正在进行读操作的连接数
(正在读取客户端请求的连接数量)

nginx_connections_writing
正在进行写操作的连接数
(正在向客户端返回响应的连接数量)

nginx_connections_waiting
正在等待的连接数
(处于 keep-alive 状态的空闲连接数)

nginx_connections_requests
总处理的请求数
(对应 stub_status 中的 requests 指标)
5.grafana中对nginx进行监控
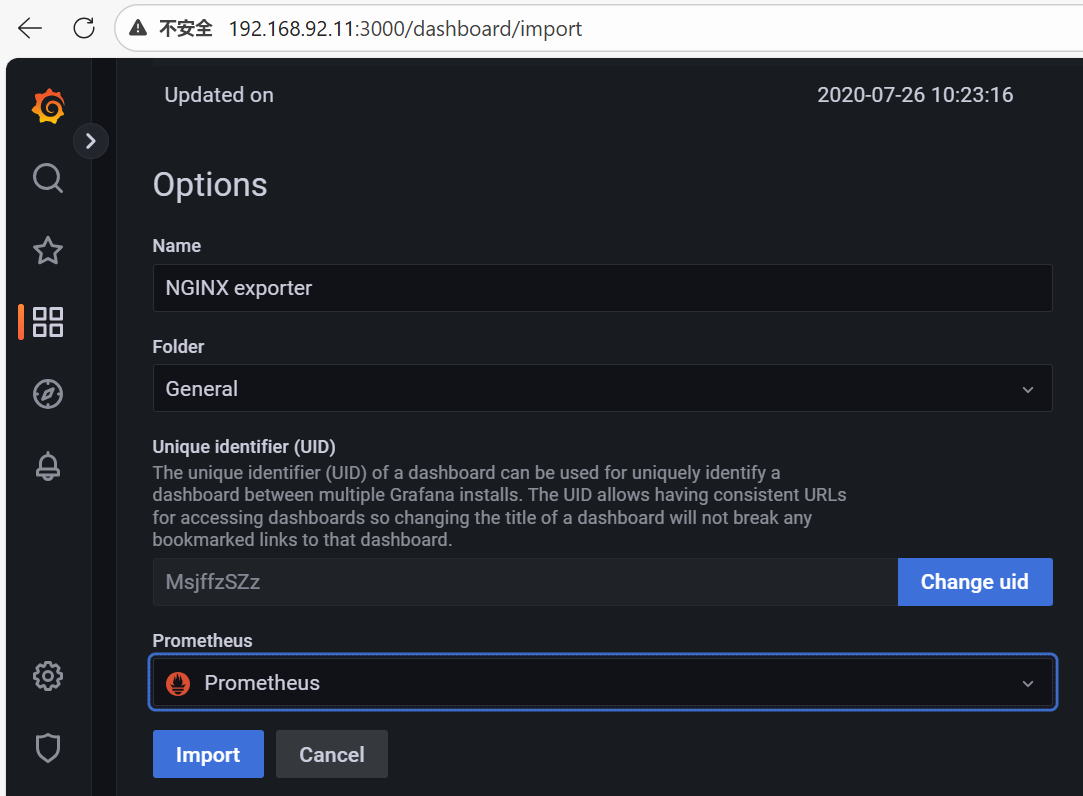
copy id to clipboard->grafana的dashboards中Import dashboard
https://grafana.com/grafana/dashboards/12708-nginx/
选一个nginx的面板,复制id,我是用的id为12708的面板
grafana里导入这个面板,输入面板id导入

Prometheus监控栈 监控Springboot2+vue3+redis项目完成。