37 布局与显示
词汇 (Vocabulary)
| 函数 | 说明 |
|---|---|
Framed[expr] |
添加边框 |
Labeled[expr, lab] |
添加标签 |
Callout[expr, lab] |
添加标注(带指向线) |
Tooltip[expr, lab] |
添加交互提示 |
Legended[expr, lab] |
添加图例 |
Row[{expr1, expr2, ...}] |
横向排列 |
Column[{expr1, expr2, ...}] |
纵向排列 |
GraphicsRow[{...}] |
可缩放的横向图形排列 |
GraphicsColumn[{...}] |
可缩放的纵向图形排列 |
GraphicsGrid[array] |
可缩放的网格排列 |
加边框
在嵌套函数一章中使用 Framed 为显示的内容添加边框。
生成一个数字并为其添加边框:
wl
In[]:=Framed[2^100]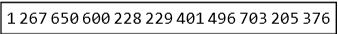
边框选项
可以给 Framed 指定选项。
指定背景颜色和边框样式:
wl
In[]:=Framed[2^100, Background -> LightYellow, FrameStyle -> LightGray]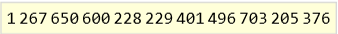
加标签
Labeled 可用于为对象添加标签。
为带边框的数字添加标签:
wl
In[]:=Labeled[Framed[2^100], "一个大数"]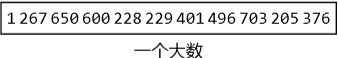
这会为带有黄色背景的数字添加标签:
wl
In[]:=Labeled[Style[2^100, Background -> Yellow], "一个大数"]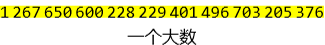
标签样式
为标签添加样式:
wl
In[]:=Labeled[Style[2^100, Background -> Yellow], Style["一个大数", Italic, Orange]]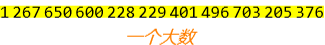
图形标签
Labeled 也可用于图形。
饼图
制作带有部分扇区标签的饼图:
wl
In[]:=PieChart[{Labeled[1, "one"], Labeled[2, "two"], Labeled[3, Red], Labeled[4, Orange], 2, 2}]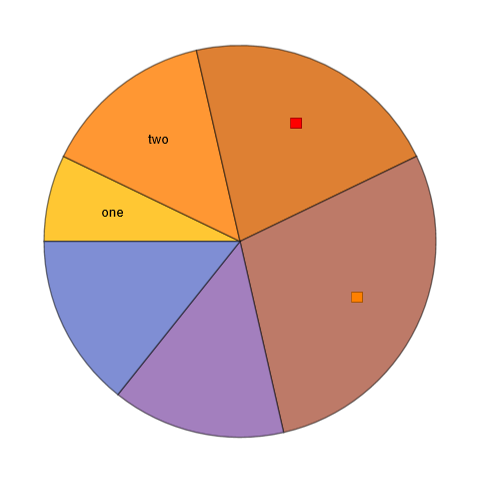
散点图
绘制带标签的点:
wl
In[]:=ListPlot[{Labeled[1, "one"], Labeled[2, "two"], Labeled[3, Pink],
  Labeled[4, Yellow], 5, 6, 7}]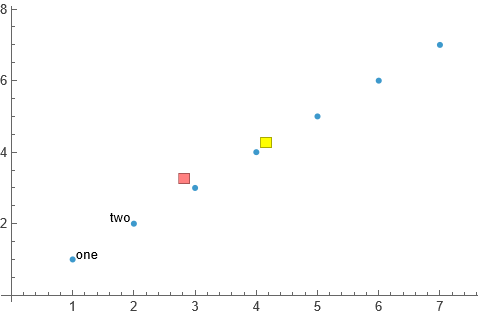
绘制标注其值的前几个素数:
wl
In[]:=ListPlot[Table[Labeled[Prime[n], Prime[n]], {n, 15}]]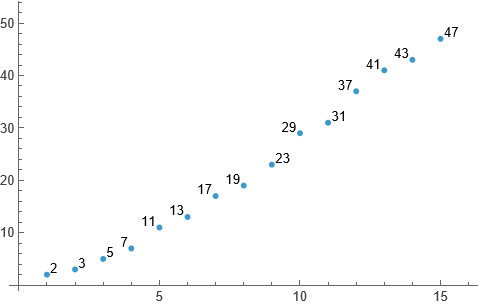
加标注
Labeled 是把标签放在对象旁边。
如果更喜欢带有小线指向目标的标注 ,可用 Callout 代替 Labeled。
Callout 创建带指向线的标注:
wl
In[]:=ListPlot[Table[Callout[Prime[n], Prime[n]], {n, 15}]]加提示
还有多种注释图形的方法。
Style 插入样式,Tooltip 生成鼠标悬停时显示的交互提示,
wl
In[]:=PieChart[{Style[3, Red], Style[2, Green], Style[1, Yellow], 1, 2}]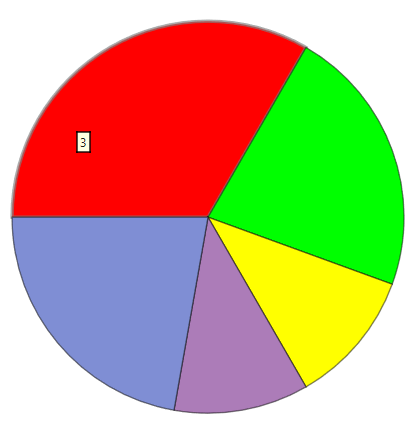
加图例
Legended 在旁边生成图例。
为前三个饼图扇区指定样式:
为扇区设置词语和颜色作为图例:
wl
In[]:=PieChart[{Legended[1, "one"], Legended[2, "two"], Legended[3, Pink], Legended[4, Yellow], 2, 2}]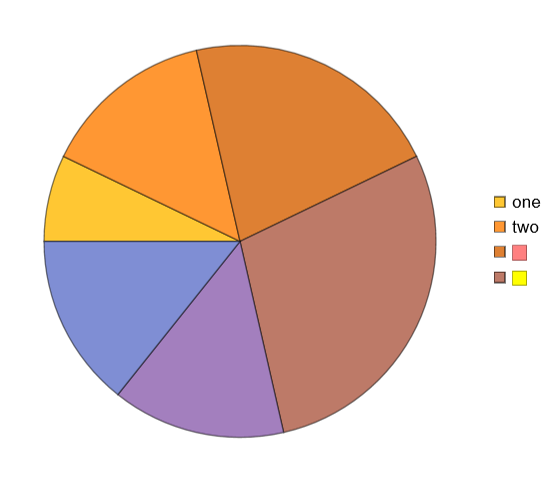
网页的默认绘图主题颜色更鲜明:
wl
In[]:=PieChart[{1, 2, 3, 4, 2, 2}, PlotTheme -> "Web"]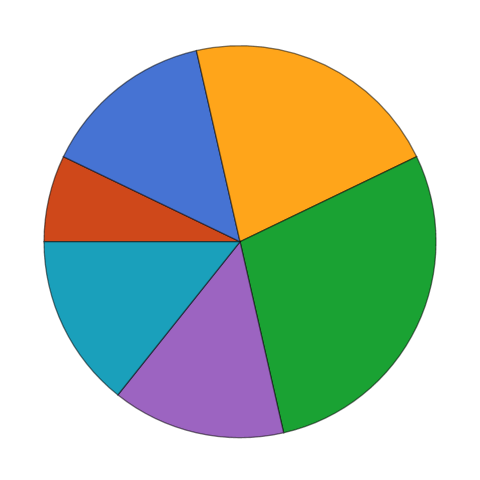
自动注释
如果你希望 Wolfram语言自动选择注释方式,只需用规则 (->)给出注释。
在 ListPlot 中,用规则指定的注释以 callouts 实现:
wl
In[]:=ListPlot[{1 -> "one", 2 -> "two", 3 -> Pink, 4 -> Yellow, 5, 6, 7}]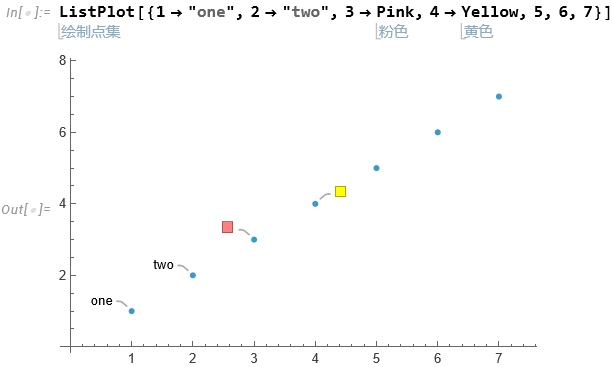
饼图
在 PieChart 中,字符串被视为标签,颜色被视为样式:
wl
In[]:=PieChart[{1 -> "one", 2 -> "two", 3 -> Blue, 4 -> Red}]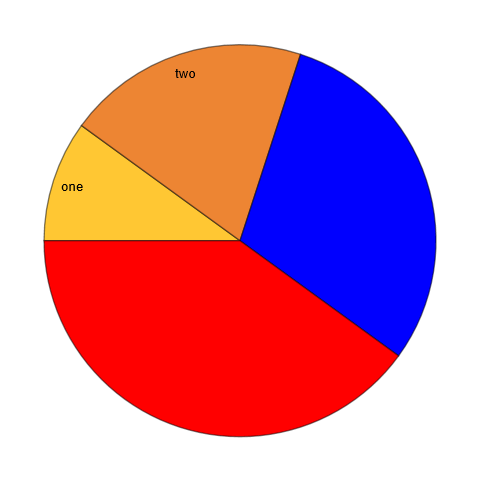
组合展示
将不同对象组合以便展示是常见需求。
行
Row、Column 和 Grid 是方便的排列方式。
在一行中显示对象列表:
wl
In[]:=Row[{Yellow, Pink, Cyan}]
列
在一列中显示对象:
wl
In[]:=Column[{Yellow, Pink, Cyan}]
图形组合
使用 GraphicsRow、GraphicsColumn 和 GraphicsGrid 可将图形按总体尺寸排列。
图形网格
生成一组随机饼图并调整大小以适配:
wl
In[]:=GraphicsGrid[Table[PieChart[RandomReal[10, 5]], 3, 6]]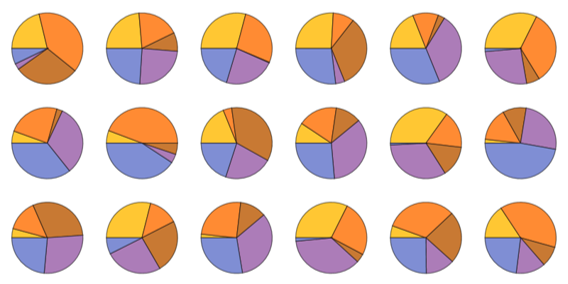
为所有图形添加外框:
wl
In[]:=GraphicsGrid[Table[PieChart[RandomReal[10, 5]], 3, 6], Frame -> All]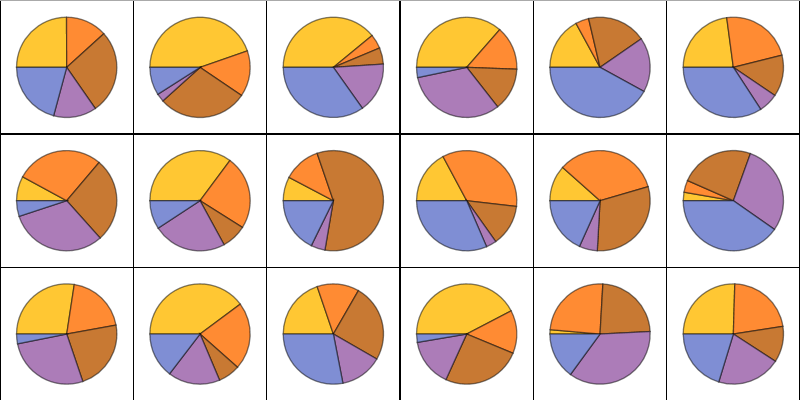
总结
Framed为显示结果添加边框。Labeled为数据添加标签;Callout为数据添加引线标注。Tooltip添加鼠标悬停提示;Legend添加数据图例。- 可以用规则方式书写数据,从而获得数据自动标注。
Row结果横向排列;Column纵向排列。GraphicsRow、GraphicsColumn和GraphicsGrid构成了可缩放的组合排列。