一、Goroutine 泄漏
goroutine 被永久阻塞(如无缓冲 channel 收 / 发无对应操作、锁未释放、无限循环无退出条件),导致 goroutine 无法销毁,持续占用内存。
goroutine 泄漏 - channel 阻塞
Go
// goroutine_leak.go
package main

import (
	"log"
	"net/http"
	_ "net/http/pprof" // 导入pprof的http服务,默认监听6060端口
	"time"
)

func leakGoroutine() {
	// 无缓冲channel:goroutine发送数据后无接收方,永久阻塞
	ch := make(chan int)
	// 启动goroutine,但数据无法发送(无接收),goroutine永远无法退出
	go func() {
		ch <- 1 // 阻塞点:无接收方,goroutine挂起
		log.Println("goroutine exit") // 永远执行不到
	}()
}

func main() {
	// 启动pprof http服务(用于采集数据)
	go func() {
		log.Println("pprof server start at :6060")
		log.Fatal(http.ListenAndServe(":6060", nil))
	}()

	// 每隔1秒创建一个泄漏的goroutine
	ticker := time.NewTicker(1 * time.Second)
	defer ticker.Stop()
	for range ticker.C {
		leakGoroutine()
		log.Println("create a leak goroutine")
	}
}
运行程序go run goroutine_leak.go
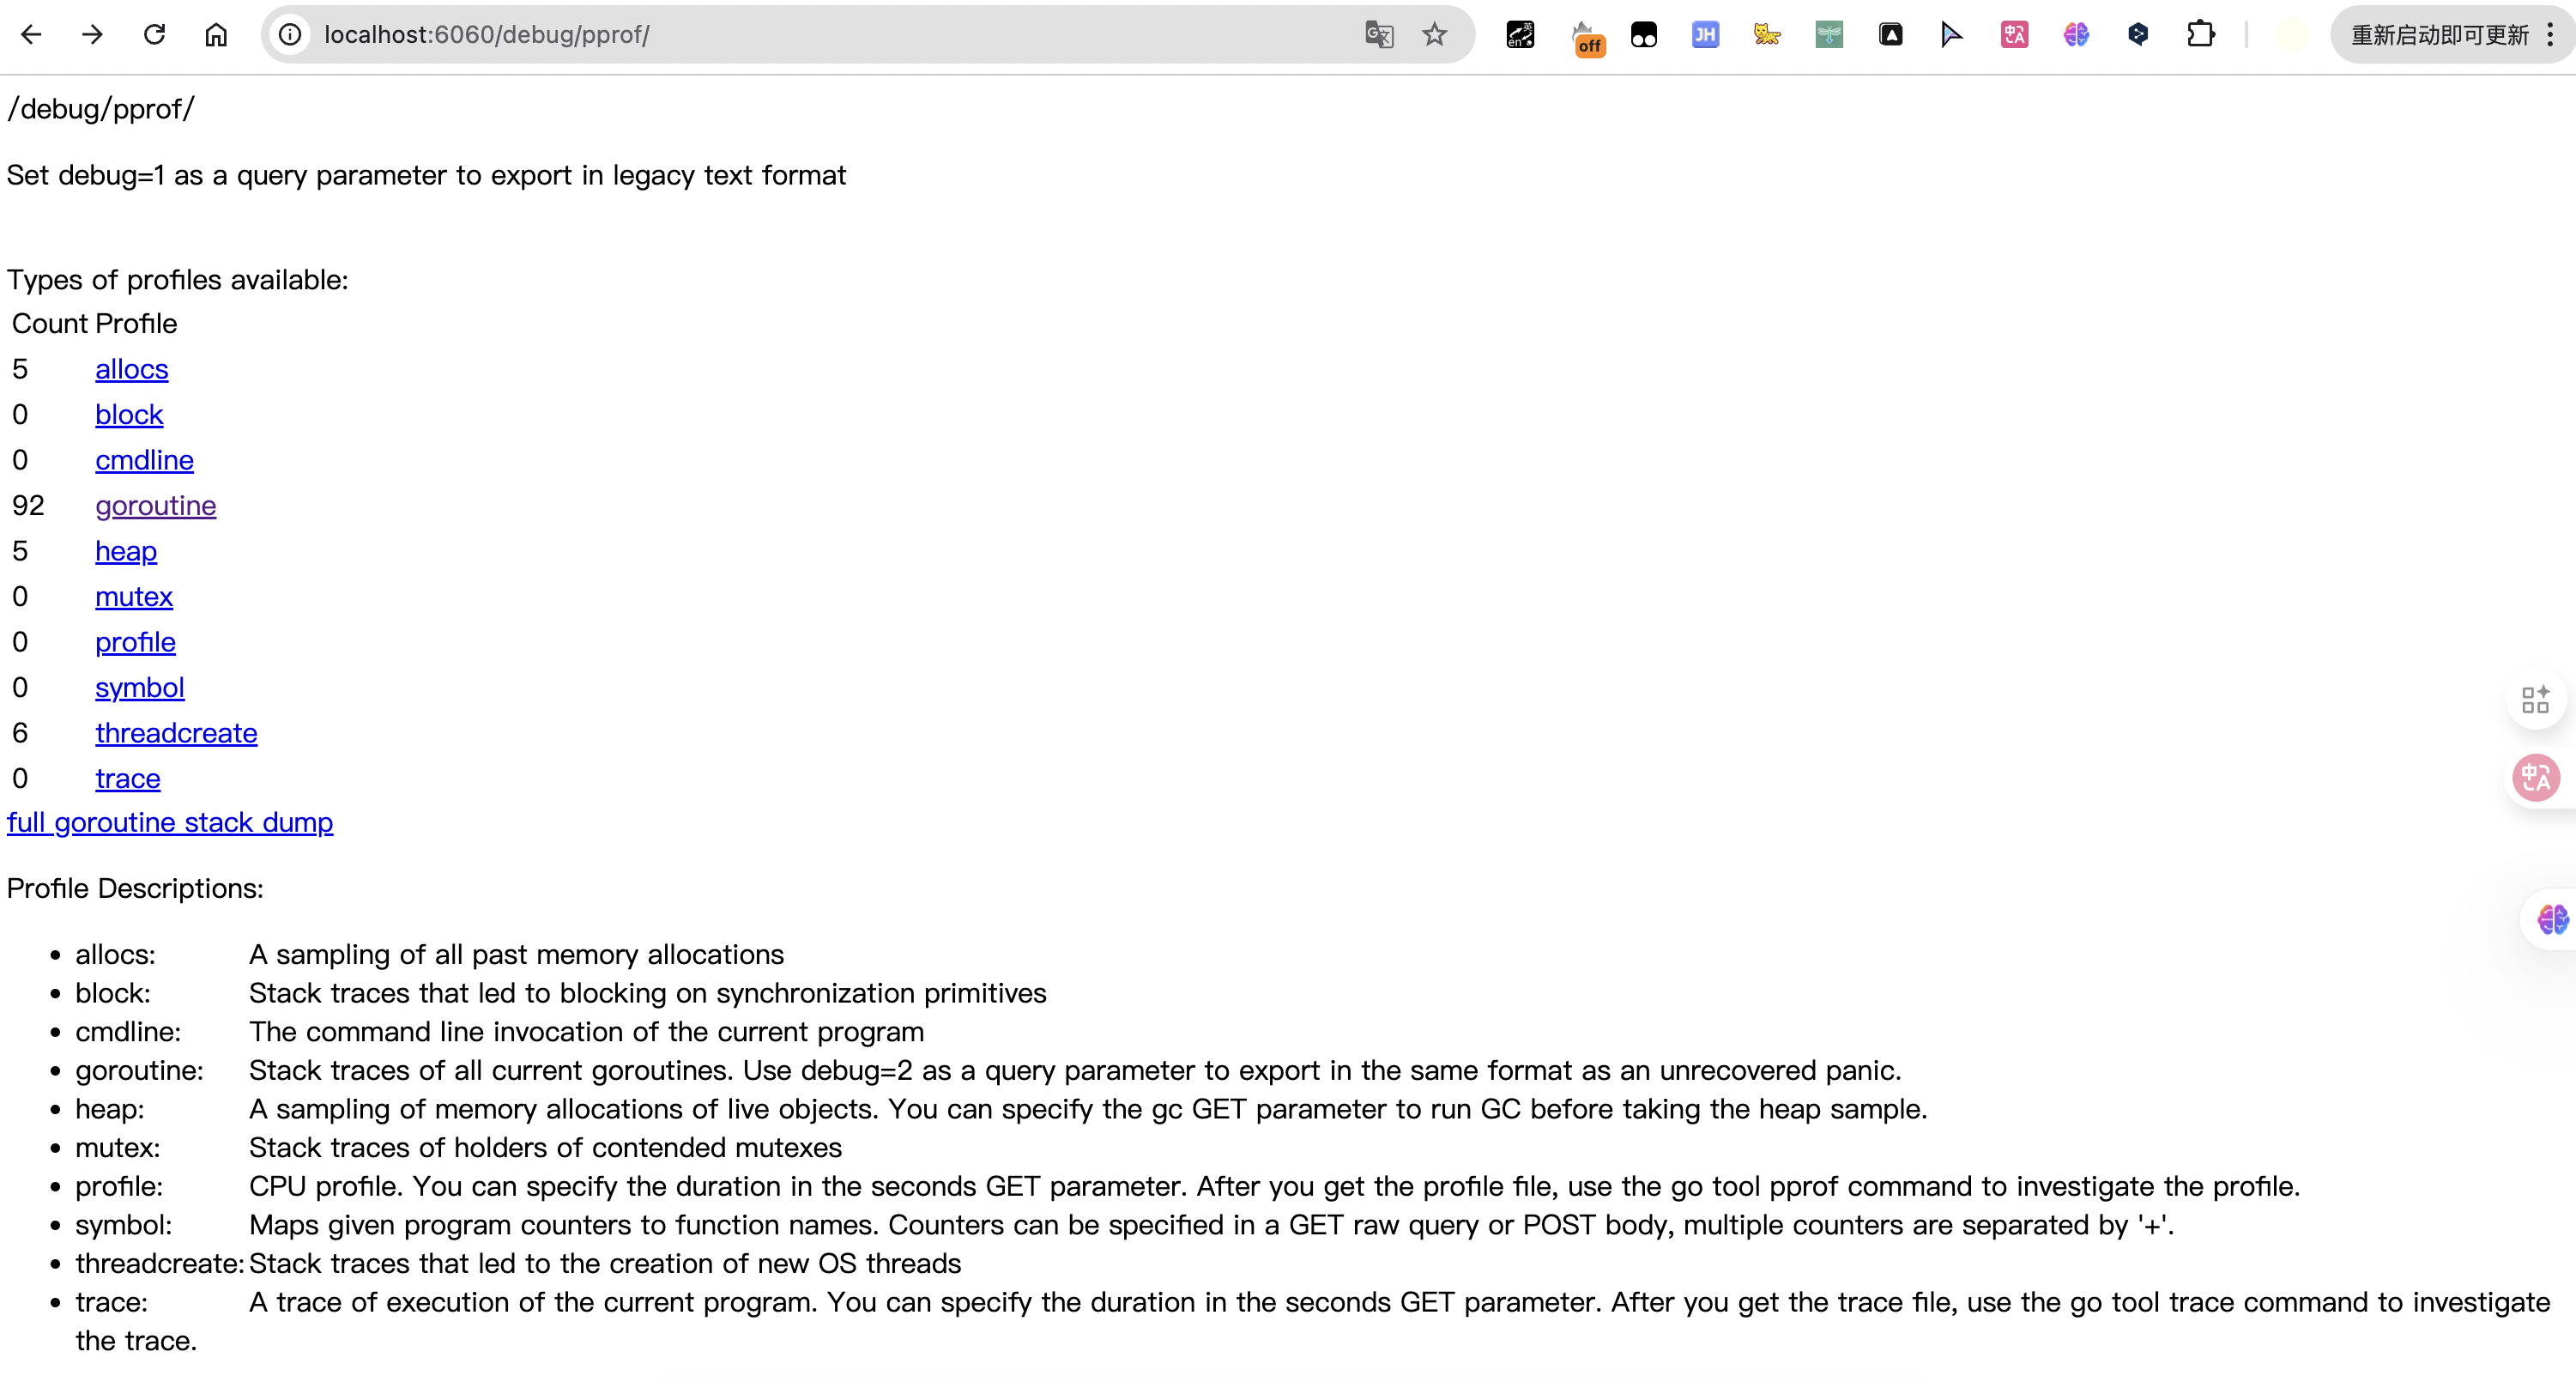
打开浏览器访问:http://localhost:6060/debug/pprof/
打开http://localhost:6060/debug/pprof/地址,不断刷新之后,会发现goroutine的数量会不断的增长。
用 trace 分析泄漏时序
Go
采集10秒的trace数据
curl http://localhost:6060/debug/pprof/trace?seconds=10 > goroutine_leak.trace

分析trace文件
go tool trace goroutine_leak.trace
# 自动打开浏览器,进入trace分析界面,点击「Goroutine Analysis」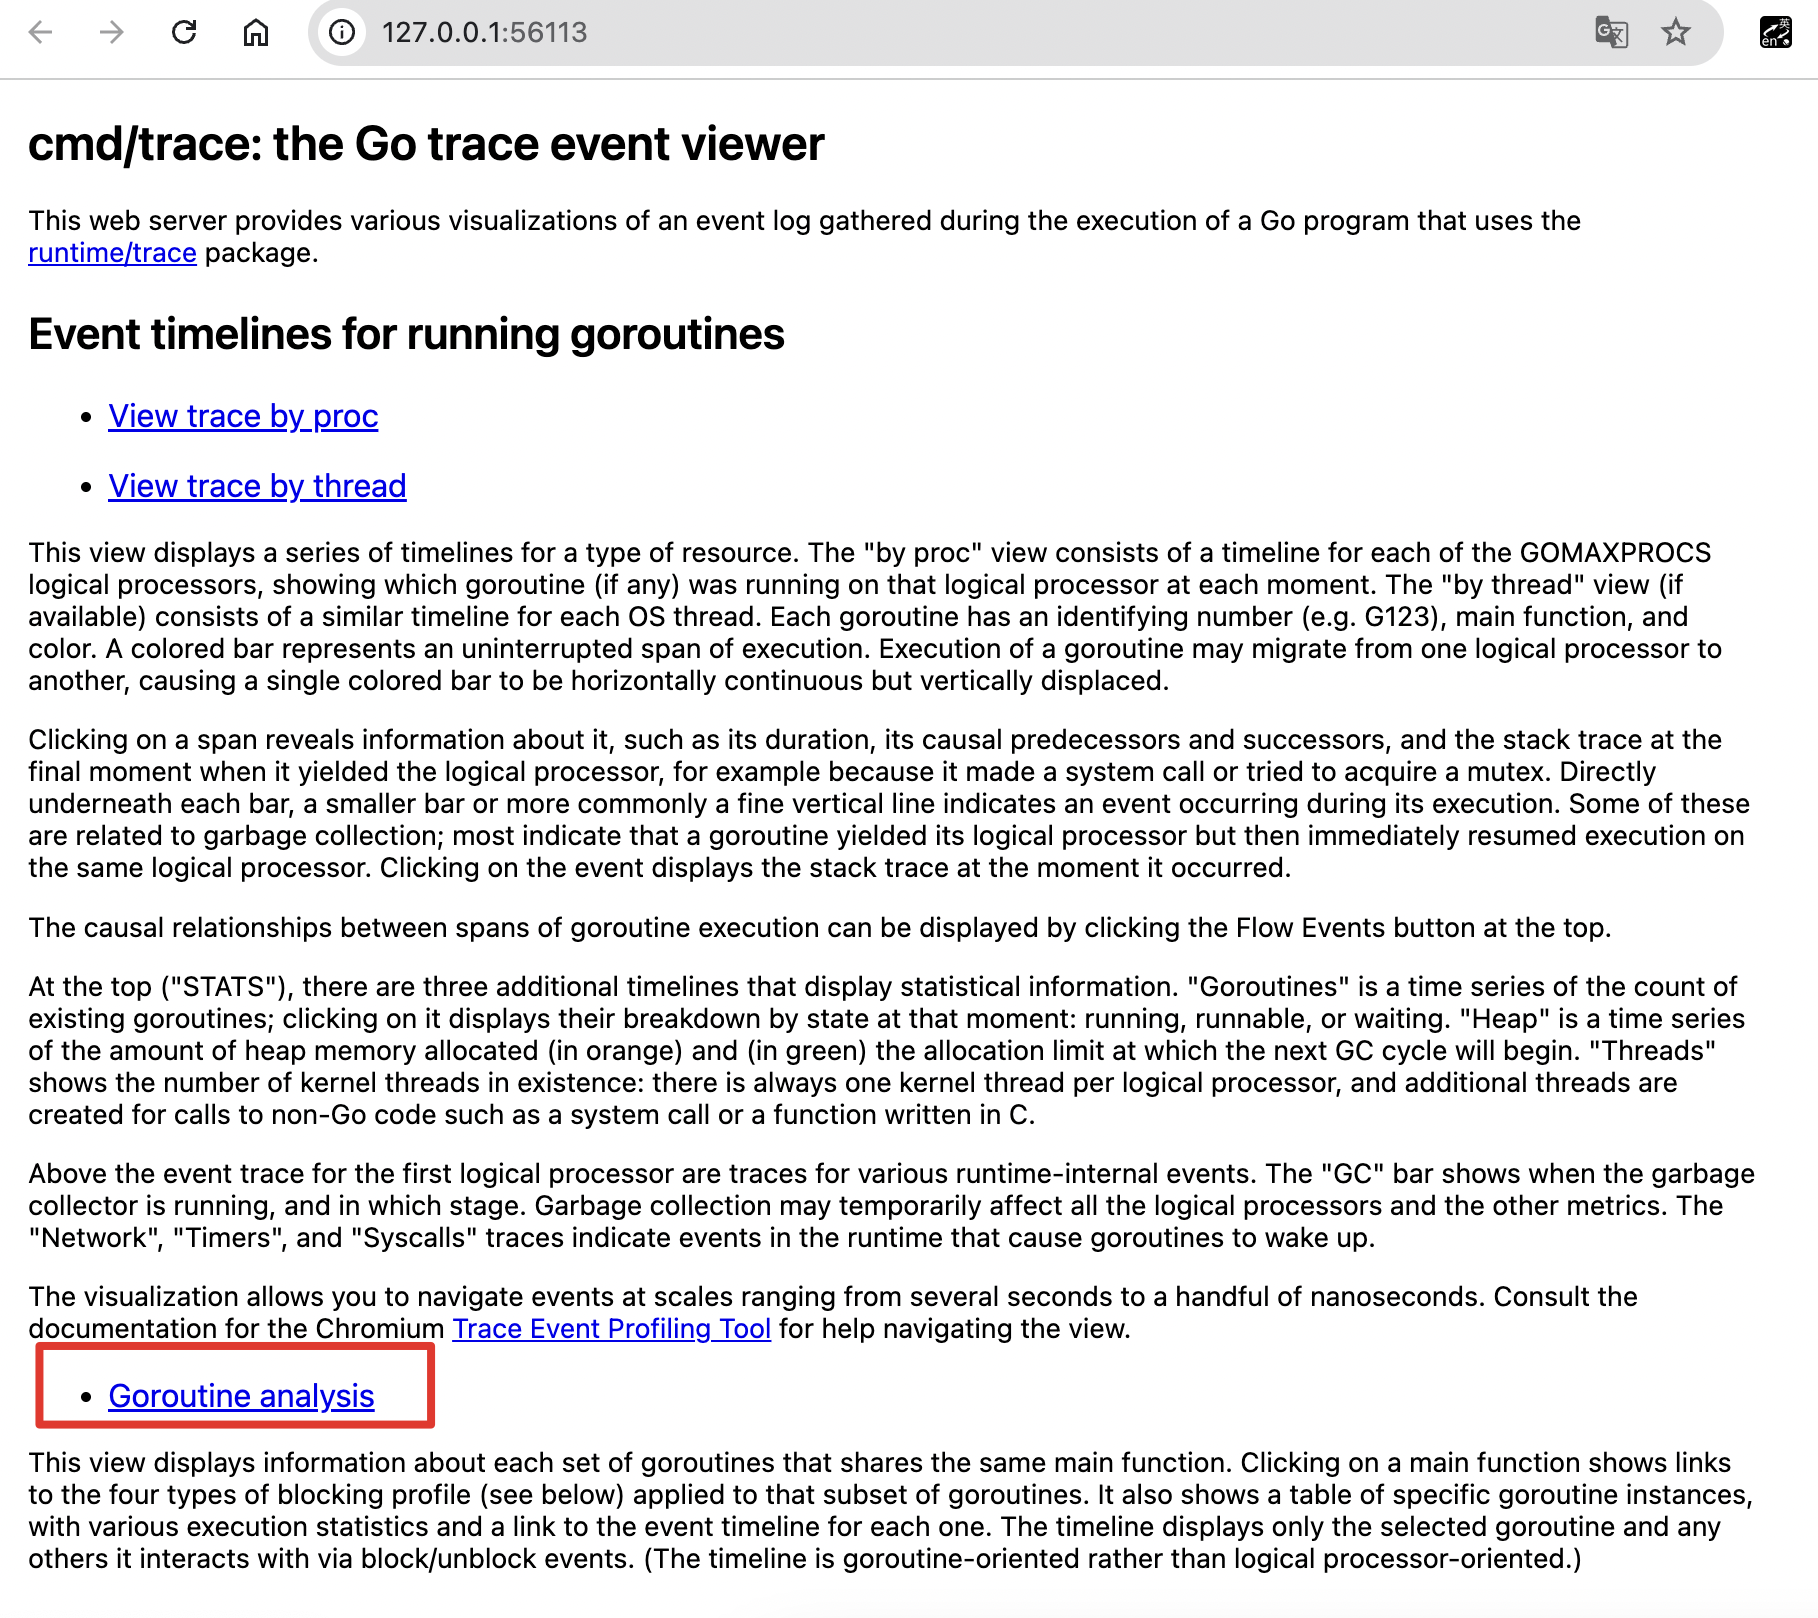
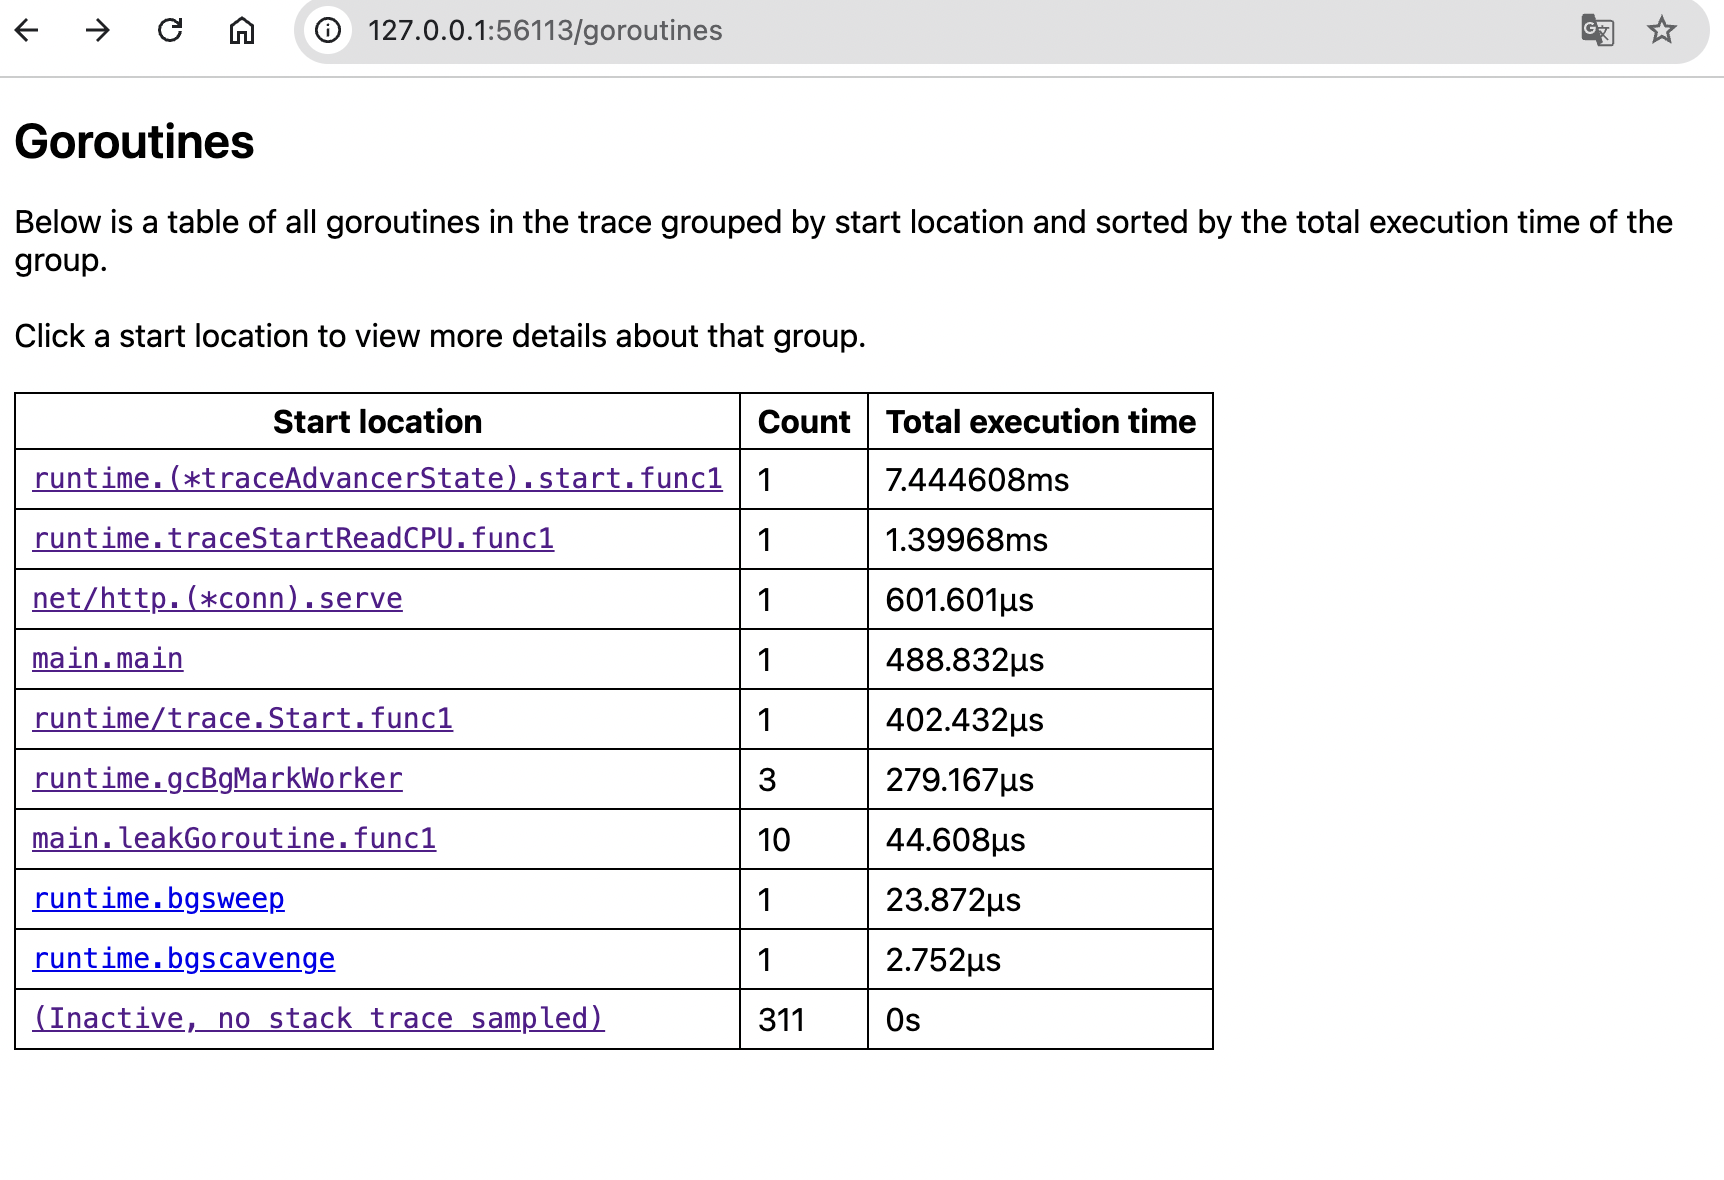
查看这一行:main.leakGoroutine.func1 10 44.608µs
Total execution time=44.608µs :这 10 个 goroutine 总执行时间极短,说明 goroutine 刚启动就被阻塞(卡在 ch <- 1),没有真正执行业务逻辑,也无法退出;
(Inactive, no stack trace sampled) 311 0s:系统闲置的 goroutine(如调度器、定时器等),属于 Go 运行时正常现象,无需处理。
点开main.leakGoroutine.func1链接显示如下:
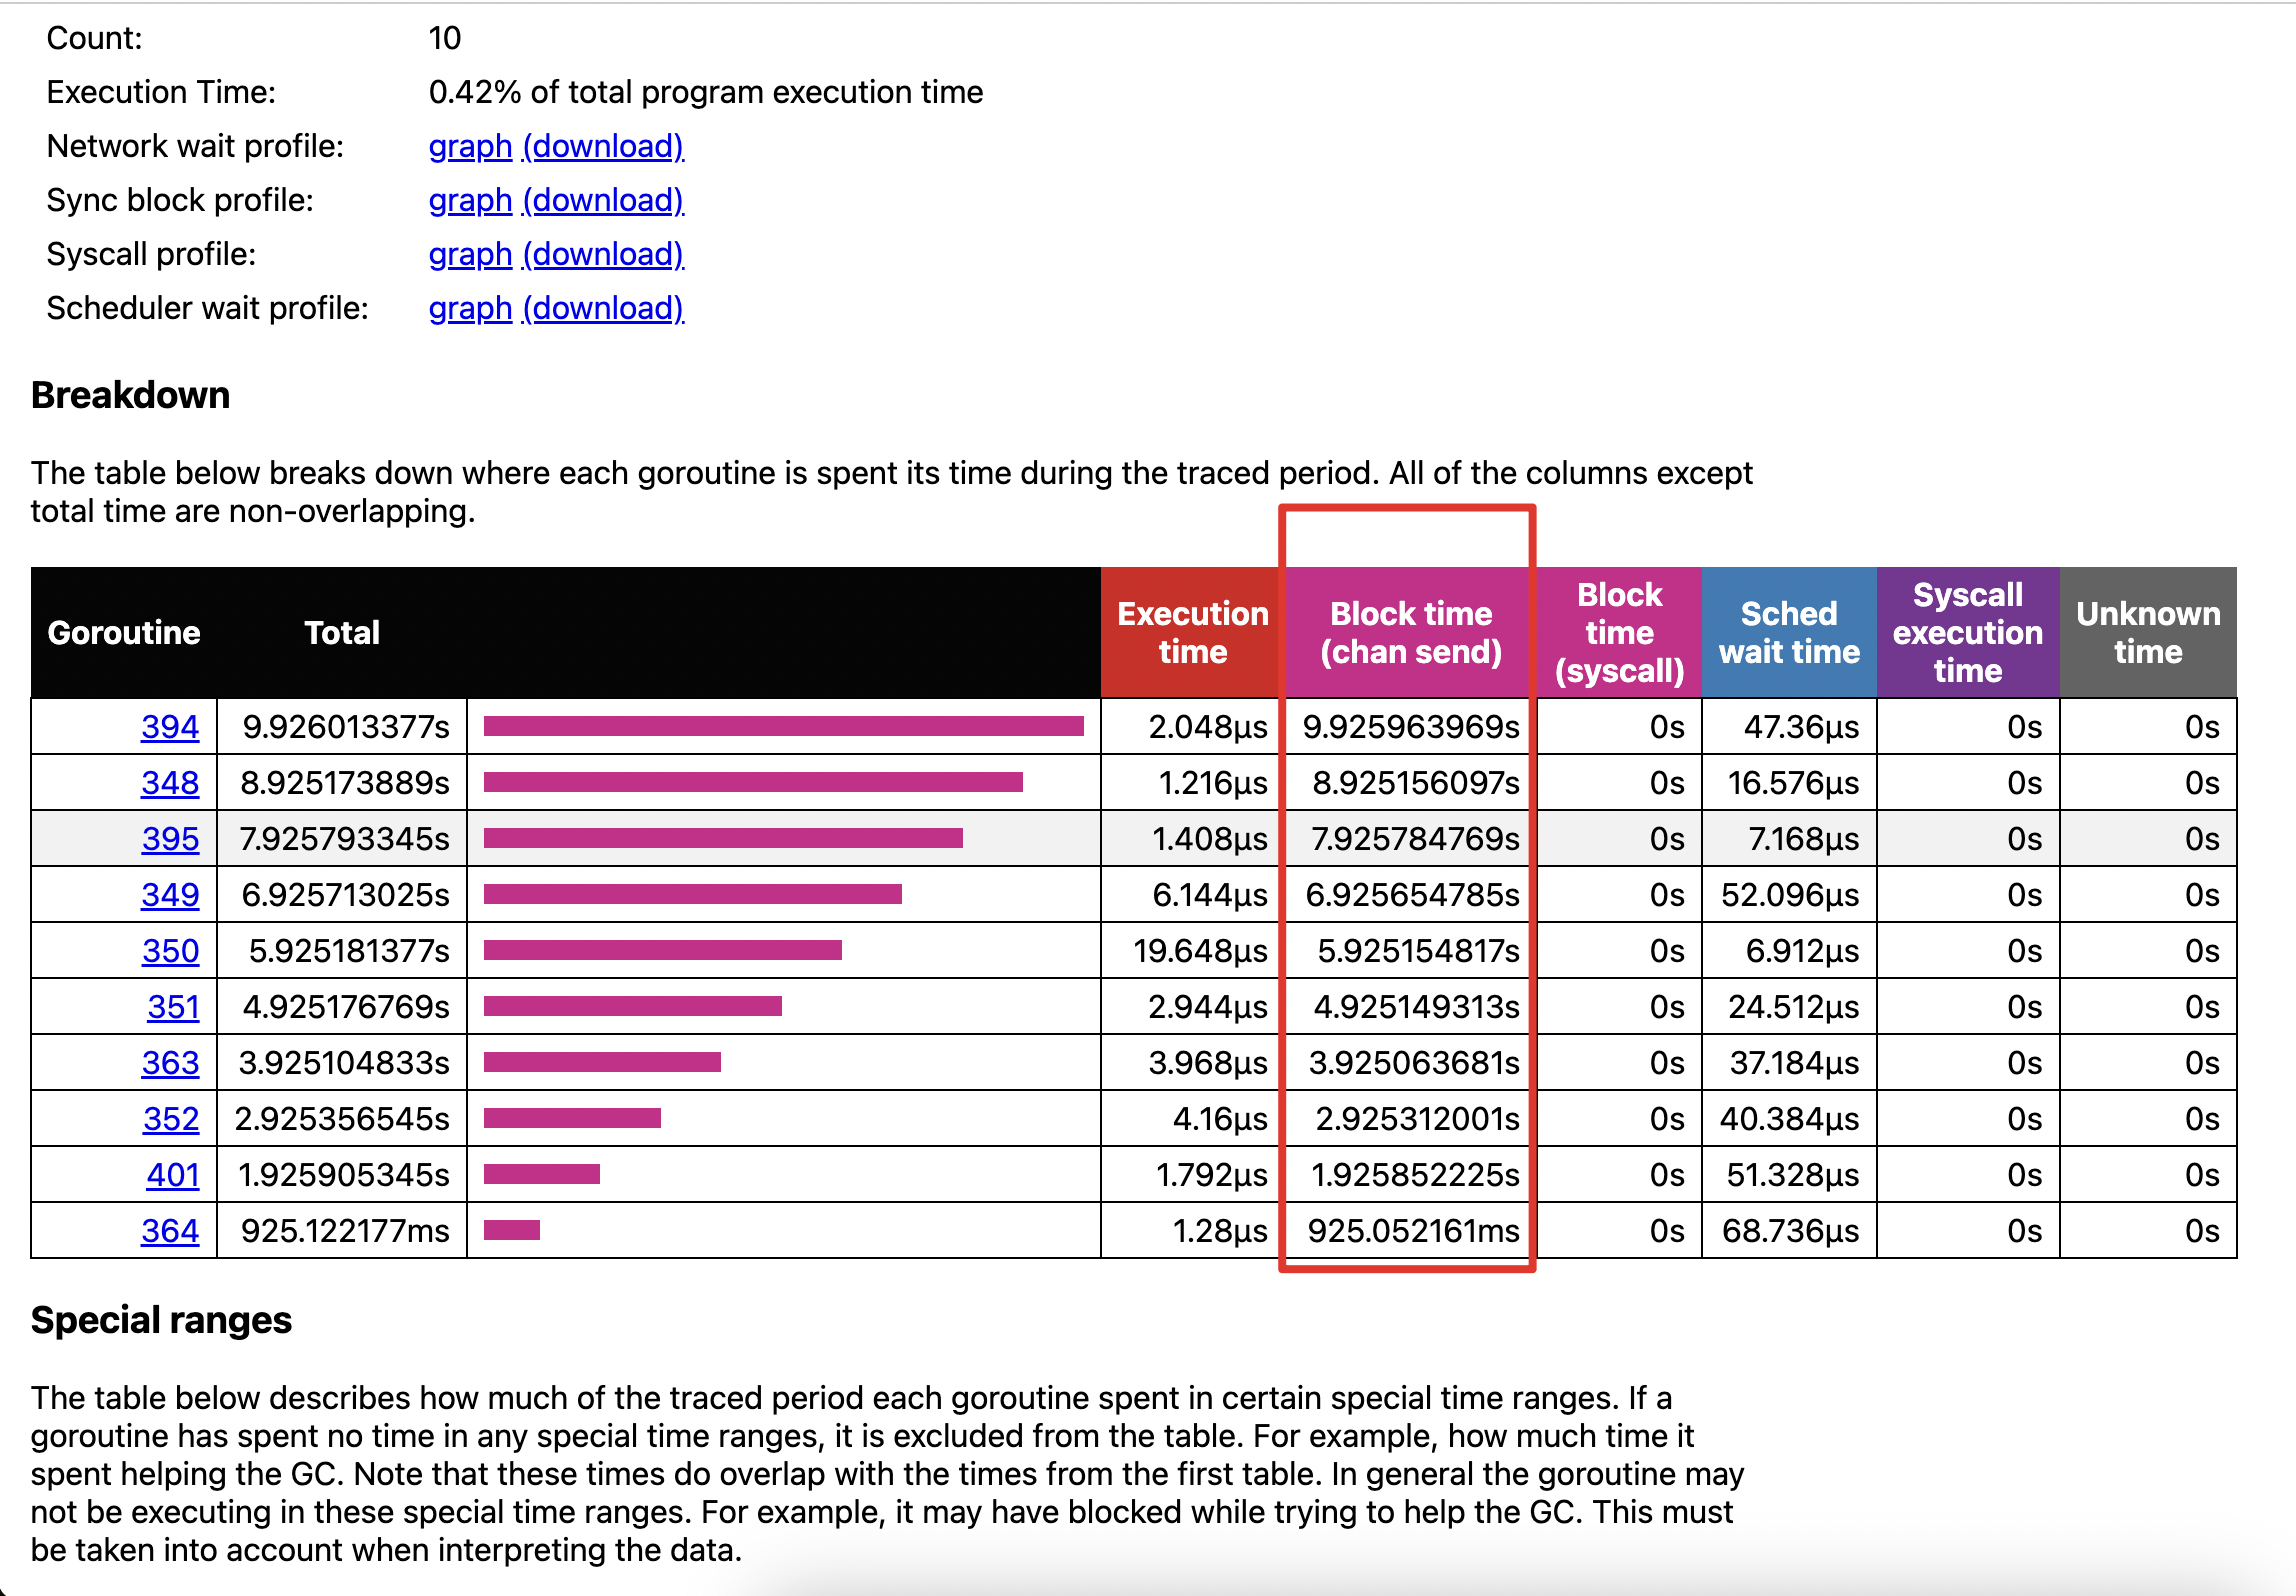
Count: 10:表示创建的goroutine 总数
Execution Time: 0.42%:表示这些 goroutine 实际执行代码的时间占比
以第一个 goroutine(394)为例拆解
| 列名 | 数值 | 含义 | 泄漏结论 |
|---|---|---|---|
Total |
9.926013377s | 该 goroutine 从创建到 trace 结束的总时长 | goroutine 存活了近 10 秒,未退出 |
Execution time |
2.048µs | 实际执行代码的时间 | 仅执行了「准备发送 channel」的极短逻辑,随即阻塞 |
Block time (chan send) |
9.925963969s | 阻塞在 channel 发送的时间 | 占总时长的 99.999%,核心阻塞原因 |
Block time (syscall) |
0s | 系统调用阻塞时间 | 无系统调用阻塞,排除 IO / 网络问题 |
Sched wait time |
47.36µs | 等待调度器调度的时间 | 可忽略,属于正常调度延迟 |
二、Channel 泄漏
channel 创建后未关闭,且无 goroutine 持续收发,导致 channel 占用的内存无法释放;或 channel 被存储在全局变量 / 长生命周期对象中,无法被 GC 回收。
Go
// channel_leak.go
package main

import (
	"log"
	"net/http"
	_ "net/http/pprof"
	"time"
)

// 全局channel:创建后未关闭,且无收发,持续占用内存
var globalCh = make(chan []byte, 100)

func leakChannel() {
	// 向全局channel写入大量数据,且不消费
	bigData := make([]byte, 1024*1024) // 1MB数据
	for i := 0; i < 100; i++ {
		globalCh <- bigData // 填满channel
	}
	log.Println("write data to global channel")
}

func main() {
	// 启动pprof
	go func() {
		log.Println("pprof server start at :6060")
		log.Fatal(http.ListenAndServe(":6060", nil))
	}()

	// 每隔5秒写入数据,导致channel内存持续增长
	ticker := time.NewTicker(5 * time.Second)
	defer ticker.Stop()
	for range ticker.C {
		leakChannel()
	}
}
Go
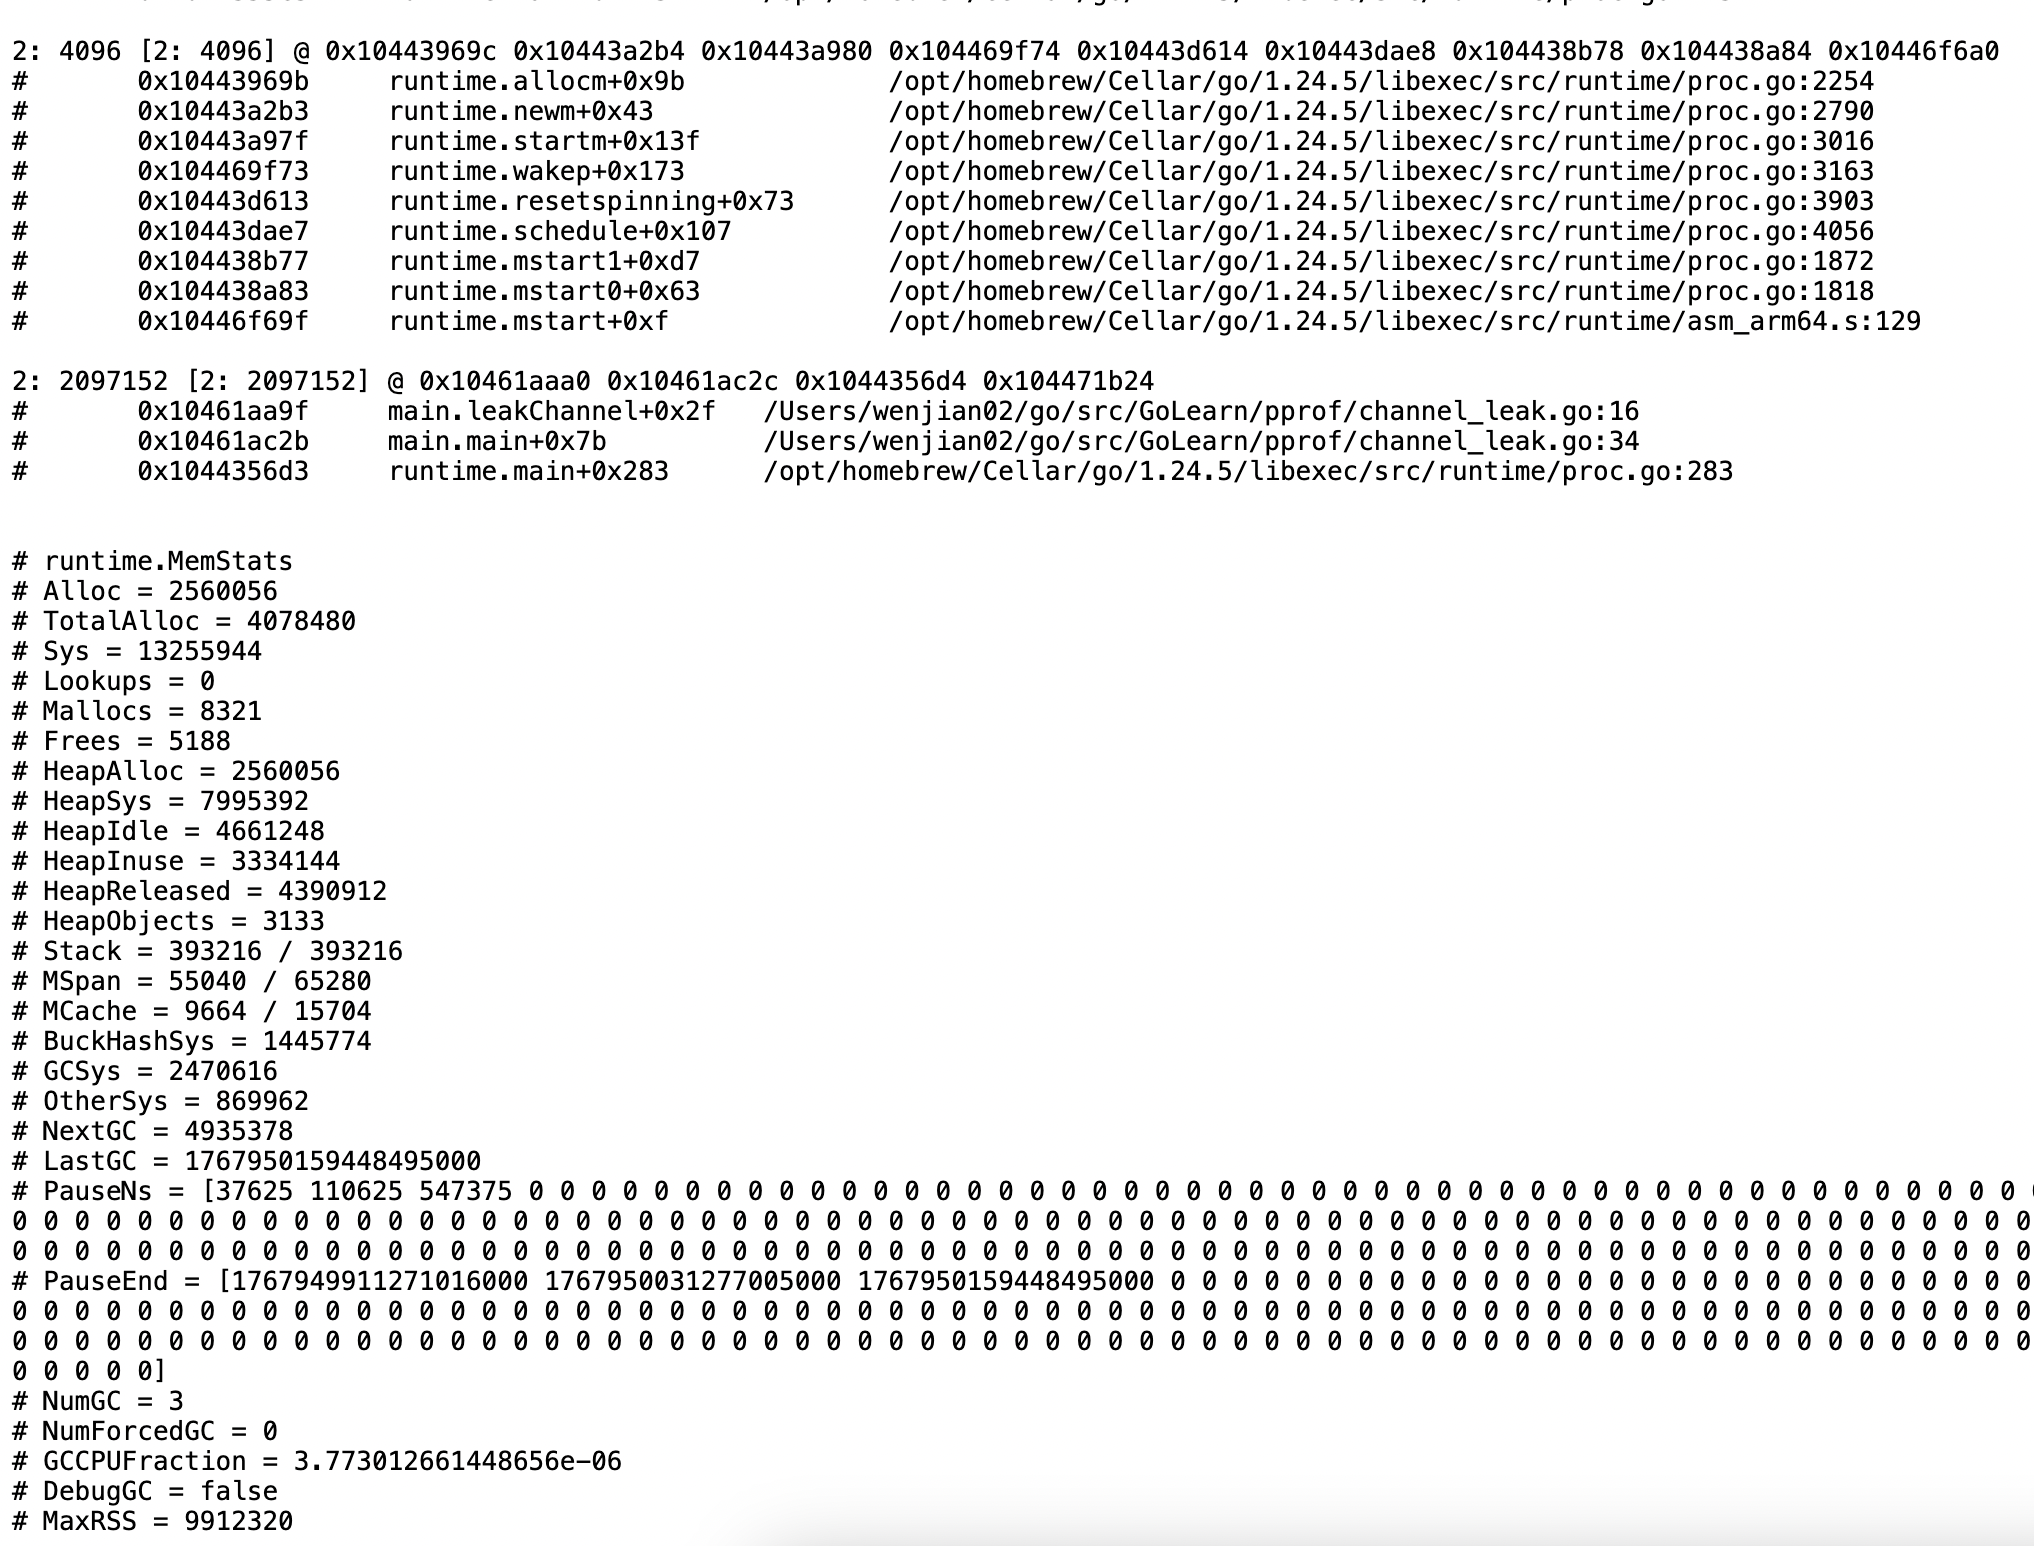
# runtime.MemStats
# Alloc = 2560056          // 当前堆内存已分配(未释放)
# TotalAlloc = 4078480     // 程序启动后累计分配
# Sys = 13255944
# Lookups = 0
# Mallocs = 8321
# Frees = 5188
# HeapAlloc = 2560056      // 堆内存已分配(和Alloc一致,无碎片)
# HeapSys = 7995392
# HeapIdle = 4661248
# HeapInuse = 3334144
# HeapReleased = 4390912
# HeapObjects = 3133
# Stack = 393216 / 393216
# MSpan = 55040 / 65280
# MCache = 9664 / 15704
# BuckHashSys = 1445774
# GCSys = 2470616
# OtherSys = 869962
# NextGC = 4935378         // 下次GC阈值
# LastGC = 1767950159448495000
# NumGC = 4                // GC仅执行4次,但内存未下降
三、堆内存泄漏(常见于缓存 / 切片 / 映射)
- 全局 map/slice 存储大量数据,未及时清理,导致 GC 无法回收;
- 引用逃逸:局部变量被逃逸到堆上,且被长生命周期对象引用;
- 第三方库使用不当:如缓存库未设置过期时间,导致内存持续增长。
Go
// memory_leak.go
package main

import (
	"log"
	"net/http"
	_ "net/http/pprof"
	"time"
)

// 全局map:存储大量用户数据,未清理
var userCache = make(map[string][]byte)

func leakMemory(userID string) {
	// 每个用户存储10MB数据,且永不删除
	userData := make([]byte, 10*1024*1024)
	userCache[userID] = userData
	log.Printf("add user %s to cache, current cache size: %d\n", userID, len(userCache))
}

func main() {
	// 启动pprof
	go func() {
		log.Println("pprof server start at :6060")
		log.Fatal(http.ListenAndServe(":6060", nil))
	}()

	// 每隔1秒添加一个用户到缓存,内存持续增长
	userID := 0
	ticker := time.NewTicker(1 * time.Second)
	defer ticker.Stop()
	for range ticker.C {
		userID++
		leakMemory(fmt.Sprintf("user_%d", userID))
	}
}
四、文件句柄泄漏
打开文件 / 网络连接后未关闭(defer close() 缺失),导致系统文件句柄耗尽,程序无法创建新连接 / 文件。
Go
// fd_leak.go
package main

import (
	"log"
	"net/http"
	_ "net/http/pprof"
	"os"
	"time"
)

func leakFileDescriptor() {
	// 打开文件但未关闭,每次调用都会泄漏一个文件句柄
	f, err := os.Open("test.txt")
	if err != nil {
		log.Println("open file error:", err)
		return
	}
	// 缺失 defer f.Close()
	log.Println("open file success, fd:", f.Fd())
}

func main() {
	// 启动pprof
	go func() {
		log.Println("pprof server start at :6060")
		log.Fatal(http.ListenAndServe(":6060", nil))
	}()

	// 每隔1秒打开一个文件,泄漏句柄
	ticker := time.NewTicker(1 * time.Second)
	defer ticker.Stop()
	for range ticker.C {
		leakFileDescriptor()
	}
}
验证文件句柄泄漏
Go
# 查看程序的文件句柄
pid=$(ps -ef | grep fd_leak | grep -v grep | awk '{print $2}')
lsof -p $pid | wc -l
# 输出数值持续增长,说明句柄泄漏

# 查看具体泄漏的文件:
lsof -p $pid | grep test.txt