javascript
option = {
backgroundColor: '#0C1E49',
tooltip: {
trigger: "axis",
textStyle: {
fontSize: 14,
fontWeight: 400,
color: "rgb(255, 255, 255)",
},
backgroundColor: "#43434391",
borderColor: "#43434391",
},
legend: {
// align: "right",
// right: "14%",
top: "5%",
// type: "plain",
// formatter: ["{name}"].join("\n"),
textStyle: {
color: "rgba(255, 255, 255, 0.6)"
}
},
grid: {
top: "12%",
bottom: "2%",
right: "2%",
left: "2%",
containLabel: true,
},
xAxis: [
{
type: "category",
splitLine: { show: false },
data: ["1月", "2月", "3月", "4月", "5月", "6月",
"7月", "8月", "9月", "10月", "11月", "12月"],
axisTick: {
alignWithLabel: true,
show: true,
length: 5,
},
axisLabel: {
show: true,
textStyle: { color: "#bfd0e1" },
},
axisLine: {
show: true,
lineStyle: {
color: "rgba(255,255,255,0.8)",
fontSize: 13,
},
},
},
],
yAxis: [
{
type: "value",
name: "单位:万元",
splitLine: { show: false },
axisLine: {
show: true,
lineStyle: {
color: "rgba(255,255,255,0.8)",
fontSize: 13,
},
},
splitNumber: 5,
axisLabel: {
show: true,
margin: 15,
textStyle: { color: "#bfd0e1" },
},
axisTick: {
show: true,
length: 5,
},
},
{
type: "value",
name: "",
splitLine: { show: false },
axisLine: { show: false },
splitNumber: 5,
axisLabel: {
show: true,
margin: 15,
textStyle: { color: "#bfd0e1" },
},
axisTick: {
show: true,
length: 5,
},
},
],
series: [
/* ===== 月度计划 bar + 上下菱形 ===== */
{
name: "月度计划",
type: "bar",
barMaxWidth: "auto",
barWidth: 20,
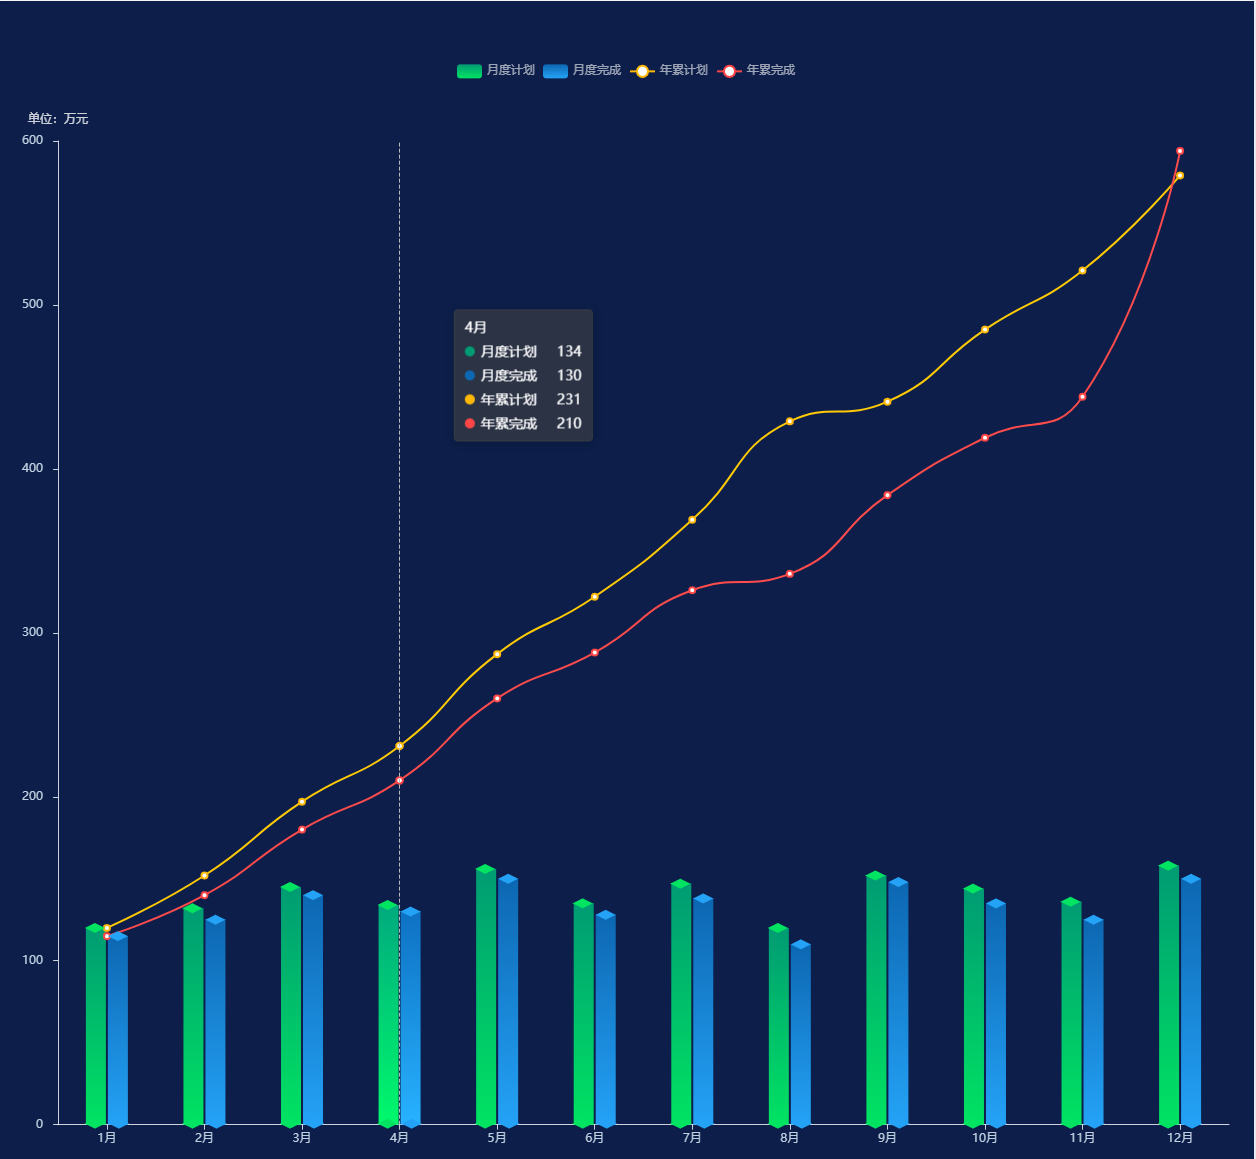
data: [120, 132, 145, 134, 156, 135, 147, 120, 152, 144, 136, 158],
itemStyle: {
color: {
type: "linear",
x: 0, y: 0, x2: 0, y2: 1,
colorStops: [
{ offset: 0, color: "#009b73" },
{ offset: 1, color: "#00e362" },
],
},
},
},
{
name: "月度计划",
type: "pictorialBar",
barMaxWidth: 20,
symbol: "diamond",
symbolOffset: [-12, "40%"],
symbolSize: [20, 10],
color: "#00e462",
data: [10, 21, 25, 35, 35, 10, 10, 10, 10, 10, 10, 10],
tooltip: { show: false },
zlevel: 2,
},
{
name: "月度计划",
type: "pictorialBar",
barMaxWidth: 20,
symbol: "diamond",
symbolPosition: "end",
symbolOffset: [-12, "-50%"],
symbolSize: [20, 10],
color: "#00e462",
data: [120, 132, 145, 134, 156, 135, 147, 120, 152, 144, 136, 158],
tooltip: { show: false },
zlevel: 2,
},
/* ===== 月度完成 bar + 上下菱形 ===== */
{
name: "月度完成",
type: "bar",
barMaxWidth: "auto",
barWidth: 20,
data: [115, 125, 140, 130, 150, 128, 138, 110, 148, 135, 125, 150],
itemStyle: {
color: {
type: "linear",
x: 0, y: 0, x2: 0, y2: 1,
colorStops: [
{ offset: 0, color: "#0d67b2" },
{ offset: 1, color: "#24a2f6" },
],
},
},
},
{
name: "月度完成",
type: "pictorialBar",
barMaxWidth: 20,
symbol: "diamond",
symbolOffset: [12, "40%"],
symbolSize: [20, 10],
color: "#24a2f6",
data: [1, 1, 1, 1, 1, 1, 1, 1, 1, 1, 1, 1],
tooltip: { show: false },
zlevel: 2,
},
{
name: "月度完成",
type: "pictorialBar",
barMaxWidth: 20,
symbol: "diamond",
symbolPosition: "end",
symbolOffset: [11, "-50%"],
symbolSize: [20, 10],
color: "#24a2f6",
data: [115, 125, 140, 130, 150, 128, 138, 110, 148, 135, 125, 150],
tooltip: { show: false },
zlevel: 2,
},
/* ===== 年累计划 / 年累完成 折线 ===== */
{
name: "年累计划",
type: "line",
smooth: true,
symbolSize: 6,
color: "#FFB805",
itemStyle: {
borderColor: "#FFB805",
borderWidth: 2,
},
lineStyle: { color: "#FFB805" },
data: [120, 152, 197, 231, 287, 322, 369, 429, 441, 485, 521, 579],
},
{
name: "年累完成",
type: "line",
smooth: true,
symbolSize: 6,
color: "#FF4545",
itemStyle: {
borderColor: "#FF4545",
borderWidth: 2,
},
lineStyle: { color: "#FF4545" },
data: [115, 140, 180, 210, 260, 288, 326, 336, 384, 419, 444, 594],
},
],
};option = {
backgroundColor: '#0C1E49',
tooltip: {
trigger: "axis",
textStyle: {
fontSize: 14,
fontWeight: 400,
color: "rgb(255, 255, 255)",
},
backgroundColor: "#43434391",
borderColor: "#43434391",
},
legend: {
// align: "right",
// right: "14%",
top: "5%",
// type: "plain",
// formatter: "{name}".join("\n"),
textStyle: {
color: "rgba(255, 255, 255, 0.6)"
}
},
grid: {
top: "12%",
bottom: "2%",
right: "2%",
left: "2%",
containLabel: true,
},
xAxis: [
{
type: "category",
splitLine: { show: false },
data: ["1月", "2月", "3月", "4月", "5月", "6月",
"7月", "8月", "9月", "10月", "11月", "12月"],
axisTick: {
alignWithLabel: true,
show: true,
length: 5,
},
axisLabel: {
show: true,
textStyle: { color: "#bfd0e1" },
},
axisLine: {
show: true,
lineStyle: {
color: "rgba(255,255,255,0.8)",
fontSize: 13,
},
},
},
],
yAxis: [
{
type: "value",
name: "单位:万元",
splitLine: { show: false },
axisLine: {
show: true,
lineStyle: {
color: "rgba(255,255,255,0.8)",
fontSize: 13,
},
},
splitNumber: 5,
axisLabel: {
show: true,
margin: 15,
textStyle: { color: "#bfd0e1" },
},
axisTick: {
show: true,
length: 5,
},
},
{
type: "value",
name: "",
splitLine: { show: false },
axisLine: { show: false },
splitNumber: 5,
axisLabel: {
show: true,
margin: 15,
textStyle: { color: "#bfd0e1" },
},
axisTick: {
show: true,
length: 5,
},
},
],
series: [
/* ===== 月度计划 bar + 上下菱形 ===== */
{
name: "月度计划",
type: "bar",
barMaxWidth: "auto",
barWidth: 20,
data: 120, 132, 145, 134, 156, 135, 147, 120, 152, 144, 136, 158,
itemStyle: {
color: {
type: "linear",
x: 0, y: 0, x2: 0, y2: 1,
colorStops: [
{ offset: 0, color: "#009b73" },
{ offset: 1, color: "#00e362" },
],
},
},
},
{
name: "月度计划",
type: "pictorialBar",
barMaxWidth: 20,
symbol: "diamond",
symbolOffset: -12, "40%",
symbolSize: 20, 10,
color: "#00e462",
data: 10, 21, 25, 35, 35, 10, 10, 10, 10, 10, 10, 10,
tooltip: { show: false },
zlevel: 2,
},
{
name: "月度计划",
type: "pictorialBar",
barMaxWidth: 20,
symbol: "diamond",
symbolPosition: "end",
symbolOffset: -12, "-50%",
symbolSize: 20, 10,
color: "#00e462",
data: 120, 132, 145, 134, 156, 135, 147, 120, 152, 144, 136, 158,
tooltip: { show: false },
zlevel: 2,
},
/* ===== 月度完成 bar + 上下菱形 ===== */
{
name: "月度完成",
type: "bar",
barMaxWidth: "auto",
barWidth: 20,
data: 115, 125, 140, 130, 150, 128, 138, 110, 148, 135, 125, 150,
itemStyle: {
color: {
type: "linear",
x: 0, y: 0, x2: 0, y2: 1,
colorStops: [
{ offset: 0, color: "#0d67b2" },
{ offset: 1, color: "#24a2f6" },
],
},
},
},
{
name: "月度完成",
type: "pictorialBar",
barMaxWidth: 20,
symbol: "diamond",
symbolOffset: 12, "40%",
symbolSize: 20, 10,
color: "#24a2f6",
data: 1, 1, 1, 1, 1, 1, 1, 1, 1, 1, 1, 1,
tooltip: { show: false },
zlevel: 2,
},
{
name: "月度完成",
type: "pictorialBar",
barMaxWidth: 20,
symbol: "diamond",
symbolPosition: "end",
symbolOffset: 11, "-50%",
symbolSize: 20, 10,
color: "#24a2f6",
data: 115, 125, 140, 130, 150, 128, 138, 110, 148, 135, 125, 150,
tooltip: { show: false },
zlevel: 2,
},
/* ===== 年累计划 / 年累完成 折线 ===== */
{
name: "年累计划",
type: "line",
smooth: true,
symbolSize: 6,
color: "#FFB805",
itemStyle: {
borderColor: "#FFB805",
borderWidth: 2,
},
lineStyle: { color: "#FFB805" },
data: 120, 152, 197, 231, 287, 322, 369, 429, 441, 485, 521, 579,
},
{
name: "年累完成",
type: "line",
smooth: true,
symbolSize: 6,
color: "#FF4545",
itemStyle: {
borderColor: "#FF4545",
borderWidth: 2,
},
lineStyle: { color: "#FF4545" },
data: 115, 140, 180, 210, 260, 288, 326, 336, 384, 419, 444, 594,
},
],
};