引言
内存问题是Android应用最常见的性能瓶颈之一。一个看似正常运行的应用,可能因为内存泄漏在后台悄悄积累问题,最终在用户使用高峰期突然崩溃。根据Google Play统计数据,OOM(Out Of Memory)是Android应用崩溃的首要原因之一,占比超过30%。
为什么内存问题如此普遍?主要原因包括:
- 移动设备资源有限: 即使是高端手机,每个应用可用的堆内存也受到严格限制(通常256MB-512MB)
- 生命周期复杂: Activity/Fragment的生命周期管理不当容易导致泄漏
- 异步机制: Handler、AsyncTask等异步组件持有外部引用
- 图片资源: Bitmap占用大量内存,管理不当直接OOM
- 第三方库: 依赖库的内存问题难以察觉
本文将从原理到实战,系统讲解Android内存优化的完整方法论:
- 第一部分: Android内存管理机制 - 掌握底层原理
- 第二部分: 内存分析工具全解 - 熟练使用Memory Profiler、MAT、LeakCanary
- 第三部分: 常见内存泄漏场景 - 识别并解决典型问题
- 第四部分: OOM问题优化 - Bitmap、缓存、资源释放最佳实践
- 第五部分: 实战案例 - 图片浏览OOM优化从85%到3%
- 第六部分: 监控体系 - 建立内存预警机制
Android内存管理机制
要解决内存问题,首先要理解Android如何管理内存。Android的内存管理涉及进程内存模型、GC垃圾回收、LMK低内存杀手三个核心机制。
2.1 进程内存模型
每个Android进程的内存由多个区域组成,理解这些区域的用途是优化的基础。

Java堆 (Java Heap)
Java堆是存储Java对象的内存区域,由ART虚拟机管理。每个应用的Java堆大小受到系统限制:
bash
# 查看堆内存限制
adb shell getprop dalvik.vm.heapgrowthlimit  # 普通应用堆限制 (如192m)
adb shell getprop dalvik.vm.heapsize          # large heap限制 (如512m)
关键概念:
- heapgrowthlimit: 默认堆限制,普通应用不能超过此值
- heapsize : 通过
android:largeHeap="true"可以申请的最大堆 - Pss (Proportional Set Size): 实际物理内存占用,计算共享内存的比例
- Uss (Unique Set Size): 进程独占内存,最准确反映实际占用
- Rss (Resident Set Size): 驻留内存,包含共享库
查看应用内存占用:
bash
# 详细内存信息
adb shell dumpsys meminfo com.example.app

# 关键指标解读
# Java Heap: Java对象占用
# Native Heap: Native代码分配 (JNI、NDK、so库)
# Code: 代码段 (dex、so、oat)
# Stack: 线程栈
# Graphics: GPU内存 (纹理、buffer)
# Private Other: 其他私有内存
实际案例输出:
App Summary
           Pss(KB)
           ------
      Java Heap:    38436    # Java对象占用38MB
    Native Heap:    12584    # Native分配12MB
           Code:    15220    # 代码段15MB
          Stack:     1036    # 栈1MB
       Graphics:    25688    # GPU内存25MB
  Private Other:     8432
         System:     4256
        Unknown:        0
          TOTAL:   105652    # 总共105MB
Native堆 (Native Heap)
Native堆存储通过JNI/NDK分配的内存,不受Java堆限制但计入进程总内存。常见使用场景:
- Bitmap像素数据 (Android 8.0+迁移到Native堆)
- Native库 (如WebView、OpenGL、第三方so)
- JNI对象分配
Native内存泄漏更难发现,因为Java GC无法回收这些对象。
栈和方法区
- 栈 (Stack): 每个线程都有独立栈空间,存储局部变量和方法调用。默认1MB,过深递归会导致StackOverflowError
- 方法区 (Method Area): 存储类信息、常量池、静态变量、JIT编译代码
图形内存 (Graphics Memory)
GPU使用的纹理、缓冲区等内存,在dumpsys meminfo的Graphics项显示。大量图片显示或复杂UI会占用大量图形内存。
2.2 垃圾回收机制 (GC)
Android的ART虚拟机使用自动垃圾回收管理Java堆内存。理解GC机制有助于优化内存分配和避免卡顿。
GC算法
ART使用了多种GC算法的组合:
- 标记-清除 (Mark-Sweep): 标记存活对象,清除未标记对象,会产生内存碎片
- 复制算法 (Copying): 将存活对象复制到另一块内存,适用于新生代
- 标记-整理 (Mark-Compact): 标记后整理内存,消除碎片,适用于老年代
GC类型
在logcat中可以看到不同类型的GC日志:
# 并发GC (Concurrent GC)
I/art: Background concurrent mark sweep GC freed 2MB, 15% free, 32MB/38MB, paused 1.203ms total 23.567ms

# 显式GC (Explicit GC)
I/art: Explicit concurrent mark sweep GC freed 156KB, 12% free, 38MB/43MB, paused 987us total 21.345ms

# 分配失败GC (Alloc Failed GC)
I/art: Alloc partial concurrent mark sweep GC freed 1MB, 24% free, 28MB/37MB, paused 2.456ms total 45.678ms
关键指标解读:
- freed: 回收了多少内存
- free: 当前堆空闲比例
- paused: GC暂停时间 (影响UI流畅度)
- total: GC总耗时
GC Root对象
GC从GC Root对象开始标记存活对象。常见的GC Root包括:
- 虚拟机栈中引用的对象 (局部变量)
- 方法区中静态属性引用的对象
- 方法区中常量引用的对象
- Native方法引用的对象
- 活跃线程
内存泄漏的本质: 无用对象被GC Root直接或间接引用,导致GC无法回收。
对象引用类型
Java提供了四种引用类型来控制对象的生命周期:
kotlin
// 强引用 (Strong Reference) - 永远不会被GC回收
val strongRef: Object = Object()

// 软引用 (Soft Reference) - 内存不足时回收
val softRef: SoftReference<Bitmap> = SoftReference(bitmap)

// 弱引用 (Weak Reference) - 下次GC时回收
val weakRef: WeakReference<Activity> = WeakReference(activity)

// 虚引用 (Phantom Reference) - 用于对象回收监控
val phantomRef: PhantomReference<Object> = PhantomReference(obj, queue)最佳实践:
- 缓存图片使用
SoftReference或WeakReference - 避免在静态变量中持有Activity的强引用
- 异步回调使用
WeakReference持有外部对象
2.3 低内存杀手 (LMK)
当系统内存不足时,Android会通过LMK (Low Memory Killer)杀死进程释放内存。理解LMK机制有助于优化应用的生存优先级。
LMK工作原理
LMK是Linux OOM Killer的定制版本,根据进程的oom_adj值决定杀死顺序:
- 内核监测系统内存压力 (通过
/proc/meminfo) - 当可用内存低于阈值,触发LMK机制
- 根据
oom_adj值从高到低杀进程 (值越大越先被杀) - 释放的内存分配给前台进程
查看进程的oom_adj值:
bash
# 查看所有进程的oom_adj
adb shell ps -A -o NAME,PID,USER,%MEM,OOM_ADJ | grep com.example

# 输出示例
com.example.app    12345   u0_a123   8.5%    0     # 前台进程
com.example.app    12346   u0_a123   2.3%    6     # 可见进程
oom_adj优先级
| 级别 | adj值 | 进程类型 | 说明 |
|---|---|---|---|
| 前台进程 | 0 | FOREGROUND_APP | 用户正在交互的Activity |
| 可见进程 | 1-2 | VISIBLE_APP | 可见但非前台的Activity |
| 服务进程 | 3-6 | SERVICE | 后台Service |
| 缓存进程 | 7-15 | CACHED_APP | 已退出的Activity (保留在后台) |
| 空进程 | 16+ | EMPTY | 无活动组件的进程 |
优化建议:
- 避免在后台占用过多内存
- 及时释放不用的资源降低内存占用
- 关键Service使用
startForeground()提升优先级 - 监听
onTrimMemory()回调释放缓存
onTrimMemory回调
系统在内存不足时会回调onTrimMemory(),应用应该根据级别释放资源:
kotlin
override fun onTrimMemory(level: Int) {
    super.onTrimMemory(level)

    when (level) {
        // UI隐藏,可以释放UI相关资源
        ComponentCallbacks2.TRIM_MEMORY_UI_HIDDEN -> {
            Log.d("Memory", "UI hidden, release UI resources")
            releaseUIResources()
        }

        // 进程在后台LRU列表头部,可能被杀死
        ComponentCallbacks2.TRIM_MEMORY_BACKGROUND -> {
            Log.d("Memory", "Background, release some cache")
            imageCache.evictSome()
        }

        // 内存严重不足,进程即将被杀死
        ComponentCallbacks2.TRIM_MEMORY_COMPLETE -> {
            Log.d("Memory", "Critical memory, release all cache")
            imageCache.evictAll()
            clearAllCache()
        }

        // 前台应用内存不足
        ComponentCallbacks2.TRIM_MEMORY_RUNNING_LOW,
        ComponentCallbacks2.TRIM_MEMORY_RUNNING_CRITICAL -> {
            Log.d("Memory", "Low memory, shrink cache")
            imageCache.trimToSize(imageCache.size() / 2)
        }
    }
}
AOSP源码位置:
- LMK实现:
system/core/lmkd/lmkd.c - oom_adj管理:
frameworks/base/services/core/java/com/android/server/am/ProcessList.java - 内存监控:
frameworks/base/services/core/java/com/android/server/am/ActivityManagerService.java
内存分析工具全解
工欲善其事,必先利其器。Android提供了丰富的内存分析工具,掌握这些工具是解决内存问题的关键。

3.1 Memory Profiler (Android Studio自带)
Memory Profiler是Android Studio内置的实时内存监控工具,适合快速定位内存增长和泄漏。
基本使用
-
打开Memory Profiler:
- Android Studio → View → Tool Windows → Profiler
- 选择设备和应用进程
- 点击Memory行展开详细视图
-
实时内存图表:
- Java: Java堆内存
- Native: Native堆内存
- Graphics: 图形内存
- Stack: 栈内存
- Code: 代码段
- Others: 其他内存
-
操作功能:
- Force GC: 手动触发垃圾回收
- Dump Java Heap: 捕获堆快照
- Record Allocations: 记录对象分配
检测内存泄漏
典型流程:
- 建立基准: 在初始状态Dump堆快照
- 执行操作: 打开Activity → 返回 (重复多次)
- 触发GC: 点击"Force GC"按钮
- 对比快照: Dump第二次快照,对比对象数量
案例: 检测Activity泄漏
kotlin
// 操作步骤
1. 打开ProfileActivity → Dump Heap (快照1)
2. 返回 → 再次打开ProfileActivity → 返回 (重复5次)
3. Force GC
4. Dump Heap (快照2)

// 在快照2中搜索ProfileActivity
// 正常: 应该只有0-1个实例
// 泄漏: 如果有5+个实例,说明Activity没被回收
在Heap Dump视图中:
- 按Class Name排序,搜索Activity类名
- 查看Shallow Size (对象自身大小) 和 Retained Size (对象及其引用树总大小)
- 点击实例查看引用链,找到GC Root
Allocation Tracking
记录对象分配可以找到内存增长的源头:
- 点击"Record"按钮开始记录
- 执行导致内存增长的操作
- 点击"Stop"停止记录
- 查看分配表格,按Allocations或Shallow Size排序
案例: 查找图片加载内存增长
操作: 滑动RecyclerView加载100张图片

分析结果:
Class Name                Allocations    Shallow Size
------------------------------------------------------
android.graphics.Bitmap        120         156 MB     # 图片对象
byte[]                        2340         78 MB      # Bitmap像素数据
Glide$Request                  120         0.5 MB     # Glide请求
可以看出Bitmap及其像素数据占用了主要内存,需要优化图片加载策略。
3.2 MAT (Memory Analyzer Tool)
MAT是Eclipse出品的强大Heap分析工具,适合深度分析复杂内存问题。
生成Heap Dump
bash
# 方式1: 通过adb命令
adb shell am dumpheap <pid> /data/local/tmp/heap.hprof
adb pull /data/local/tmp/heap.hprof

# 方式2: 通过Memory Profiler导出
# Memory Profiler → Dump Heap → 右键 → Export to file

# 转换格式 (Android hprof需要转换为标准格式)
hprof-conv heap.hprof heap-converted.hprof
MAT分析流程
- 打开hprof文件: File → Open Heap Dump
- 查看概览: 自动生成Leak Suspects报告
- 分析内存占用: Histogram视图查看所有类的实例数量和内存
- 查找泄漏: Dominator Tree查看最大对象及其引用
关键视图
Histogram (直方图):
- 显示所有类的实例数量和Shallow/Retained Heap
- 按Retained Heap排序找到占用内存最多的类
- 右键 → List objects → with incoming references 查看引用链
Dominator Tree (支配树):
- 显示对象的支配关系 (对象A支配对象B意味着到B的所有路径都经过A)
- 直观展示哪些对象占用了最多内存
- 删除某对象能释放多少内存 (Retained Heap)
OQL查询:
sql
-- 查找所有Activity实例
SELECT * FROM INSTANCEOF android.app.Activity

-- 查找Bitmap占用超过1MB的对象
SELECT * FROM android.graphics.Bitmap WHERE retainedHeapSize > 1048576

-- 查找静态字段持有的对象
SELECT * FROM java.lang.Object s WHERE s.@GCRoot
案例: 定位Activity泄漏
假设通过Memory Profiler发现有3个MainActivity实例:
-
Histogram查找 : 搜索
MainActivity,显示3个实例 -
查看引用链: 右键 → Merge Shortest Paths to GC Roots → exclude weak/soft references
-
分析引用链:
MainActivity @ 0x12a45000
← mContext in MyApplication
← sInstance in MyApplication (static)
← class MyApplication
← system class loader
结论: MyApplication的静态单例持有了MainActivity的引用,导致泄漏。
解决方案:
kotlin
// ❌ Bad: 静态单例持有Activity
class MyApplication : Application() {
    companion object {
        var sInstance: MyApplication? = null
    }

    fun init(context: Context) {
        sInstance = this  // 持有Activity会导致泄漏
    }
}

// ✅ Good: 使用ApplicationContext
class MyApplication : Application() {
    companion object {
        lateinit var sInstance: Application
    }

    override fun onCreate() {
        super.onCreate()
        sInstance = this  // Application不会泄漏
    }
}

// 或者使用弱引用
companion object {
    var contextRef: WeakReference<Context>? = null
}
3.3 LeakCanary (自动化泄漏检测)
LeakCanary是Square开源的自动内存泄漏检测库,能在开发和测试阶段自动发现泄漏。
集成LeakCanary
kotlin
// build.gradle.kts
dependencies {
    // 仅在debug构建中启用
    debugImplementation("com.squareup.leakcanary:leakcanary-android:2.12")
}

// 无需其他配置,Application启动时自动初始化
工作原理
- 监听生命周期: 自动监听Activity、Fragment、ViewModel等组件销毁
- 弱引用观察: 组件销毁后创建WeakReference引用
- 触发GC: 延迟5秒后触发GC
- 检测泄漏: GC后检查WeakReference是否被清除
- Dump分析: 发现泄漏时Dump堆快照分析引用链
- 通知展示: 在通知栏显示泄漏报告
查看泄漏报告
LeakCanary检测到泄漏后会显示详细报告:
┬───
│ GC Root: System class
│
├─ android.app.ActivityThread class
│  Leaking: NO (Android system class)
│  ↓ static ActivityThread.sCurrentActivityThread
│
├─ android.app.ActivityThread instance
│  Leaking: NO (ActivityThread is always reachable)
│  ↓ ActivityThread.mActivities
│
├─ android.util.ArrayMap instance
│  Leaking: NO (Application is still reachable)
│  ↓ ArrayMap[0]
│
├─ android.app.ActivityThread$ActivityClientRecord instance
│  Leaking: UNKNOWN
│  ↓ ActivityThread$ActivityClientRecord.activity
│
╰→ com.example.MainActivity instance
   Leaking: YES (RefWatcher was watching this and MainActivity#onDestroy() was called)
   key = 8a2b3c4d-5e6f-7a8b-9c0d-1e2f3a4b5c6d
retainedSize = 1.2 MB报告解读:
- GC Root: 泄漏的根源 (此例为ActivityThread静态字段)
- Leaking: YES: 确认发生泄漏
- retainedSize: 泄漏导致无法回收的内存大小
自定义监听
监听自定义对象:
kotlin
class MyService : Service() {
    override fun onDestroy() {
        super.onDestroy()

        // 通知LeakCanary监听此Service
        AppWatcher.objectWatcher.watch(
            watchedObject = this,
            description = "MyService received onDestroy callback"
        )
    }
}
生产环境禁用
LeakCanary仅应在debug构建中使用,发布版本会自动禁用:
kotlin
// 确保仅debug依赖
debugImplementation("com.squareup.leakcanary:leakcanary-android:2.12")
// releaseImplementation不添加依赖
3.4 命令行工具
除了图形化工具,命令行工具在CI/CD和自动化测试中更实用。
dumpsys meminfo
查看进程内存详情:
bash
# 查看指定应用
adb shell dumpsys meminfo com.example.app

# 查看所有应用内存排序
adb shell dumpsys meminfo --oom

# 只显示关键摘要
adb shell dumpsys meminfo com.example.app --summary
procrank
查看所有进程内存排序 (需要root):
bash
adb shell procrank

# 输出示例
  PID      Vss      Rss      Pss      Uss  cmdline
 1234   580M     85M      42M      35M  com.example.app
 5678   420M     65M      28M      22M  com.android.systemui
showmap
查看进程内存映射 (需要root):
bash
adb shell showmap <pid>

# 显示各个so库、dex文件的内存占用
脚本自动化
将内存监控集成到CI流程:
bash
#!/bin/bash
# memory_monitor.sh

PACKAGE="com.example.app"
THRESHOLD_MB=200

while true; do
    PSS=$(adb shell dumpsys meminfo $PACKAGE | grep "TOTAL PSS" | awk '{print $3}')
    echo "$(date): PSS = ${PSS}KB"

    PSS_MB=$((PSS / 1024))
    if [ $PSS_MB -gt $THRESHOLD_MB ]; then
        echo "WARNING: Memory exceeded threshold ${THRESHOLD_MB}MB"
        adb shell am dumpheap $(adb shell pidof $PACKAGE) /data/local/tmp/heap.hprof
        echo "Heap dump saved"
        break
    fi

    sleep 5
done
常见内存泄漏场景与解决
内存泄漏是Android开发中最常见的问题。掌握典型场景和解决方案,可以避免90%的内存问题。

4.1 静态变量持有Activity
这是最常见的泄漏场景,因为静态变量的生命周期是整个应用进程。
错误示例1: 静态变量直接持有Activity
kotlin
// ❌ Bad: 静态变量持有Activity引用
class DataManager {
    companion object {
        var sContext: Context? = null
    }

    fun init(context: Context) {
        sContext = context  // 如果传入Activity,会导致泄漏
    }

    fun doSomething() {
        val text = sContext?.getString(R.string.app_name)
    }
}

// MainActivity中初始化
class MainActivity : AppCompatActivity() {
    override fun onCreate(savedInstanceState: Bundle?) {
        super.onCreate(savedInstanceState)
        DataManager().init(this)  // ⚠️ 传入Activity引用
    }
}
泄漏原因 : sContext是静态变量,持有MainActivity引用,MainActivity即使销毁也无法被GC回收。
解决方案: 使用ApplicationContext
kotlin
// ✅ Good: 使用ApplicationContext
class DataManager {
    companion object {
        lateinit var sAppContext: Context
    }

    fun init(context: Context) {
        // 转换为ApplicationContext
        sAppContext = context.applicationContext
    }
}

// 或者在Application中初始化
class MyApplication : Application() {
    override fun onCreate() {
        super.onCreate()
        DataManager.sAppContext = this
    }
}核心原则: 静态变量只能持有ApplicationContext,永远不要持有Activity、Service、View等短生命周期对象。
错误示例2: 静态内部类持有外部引用
kotlin
// ❌ Bad: 单例持有Activity
class ImageLoader private constructor() {
    companion object {
        val instance: ImageLoader by lazy { ImageLoader() }
    }

    private var context: Context? = null

    fun init(context: Context) {
        this.context = context  // 持有Activity会泄漏
    }

    fun loadImage(url: String, imageView: ImageView) {
        // 使用context加载图片
    }
}解决方案: 使用弱引用或ApplicationContext
kotlin
// ✅ Good: 使用WeakReference
class ImageLoader private constructor() {
    companion object {
        val instance: ImageLoader by lazy { ImageLoader() }
    }

    private var contextRef: WeakReference<Context>? = null

    fun init(context: Context) {
        contextRef = WeakReference(context.applicationContext)
    }

    fun loadImage(url: String, imageView: ImageView) {
        contextRef?.get()?.let { context ->
            // 使用context加载图片
        }
    }
}
4.2 非静态内部类持有外部类
内部类、匿名类默认持有外部类引用,如果生命周期不一致会导致泄漏。
错误示例1: Handler内部类泄漏
kotlin
// ❌ Bad: Handler内部类持有Activity
class MainActivity : AppCompatActivity() {

    private val handler = object : Handler(Looper.getMainLooper()) {
        override fun handleMessage(msg: Message) {
            // 这个匿名内部类持有MainActivity引用
            updateUI()
        }
    }

    override fun onCreate(savedInstanceState: Bundle?) {
        super.onCreate(savedInstanceState)
        setContentView(R.layout.activity_main)

        // 发送延迟消息
        handler.sendEmptyMessageDelayed(0, 60000)  // 1分钟后处理

        // 如果用户在1分钟内退出Activity,Activity无法被回收
    }

    private fun updateUI() {
        // 更新界面
    }
}泄漏原因:
- Handler匿名内部类持有MainActivity引用
- Handler的Message被放入MessageQueue,持有Handler引用
- MessageQueue在1分钟内一直持有Message
- MainActivity → Handler → Message → MessageQueue,导致MainActivity无法回收
解决方案: 静态内部类 + 弱引用
kotlin
// ✅ Good: 静态Handler + 弱引用
class MainActivity : AppCompatActivity() {

    private val handler = MyHandler(this)

    override fun onCreate(savedInstanceState: Bundle?) {
        super.onCreate(savedInstanceState)
        setContentView(R.layout.activity_main)

        handler.sendEmptyMessageDelayed(0, 60000)
    }

    override fun onDestroy() {
        super.onDestroy()
        // 清理Handler消息
        handler.removeCallbacksAndMessages(null)
    }

    private fun updateUI() {
        // 更新界面
    }

    // 静态内部类不持有外部类引用
    private class MyHandler(activity: MainActivity) : Handler(Looper.getMainLooper()) {
        // 使用弱引用持有Activity
        private val activityRef = WeakReference(activity)

        override fun handleMessage(msg: Message) {
            // 获取Activity,可能为null
            val activity = activityRef.get()
            if (activity == null || activity.isFinishing) {
                return  // Activity已销毁,直接返回
            }

            activity.updateUI()
        }
    }
}核心原则:
- Handler使用静态内部类或独立类
- 通过WeakReference持有外部对象
- onDestroy中移除所有消息:
handler.removeCallbacksAndMessages(null)
错误示例2: Thread/Runnable匿名类泄漏
kotlin
// ❌ Bad: Thread匿名类持有Activity
class MainActivity : AppCompatActivity() {

    override fun onCreate(savedInstanceState: Bundle?) {
        super.onCreate(savedInstanceState)

        Thread {
            // 长时间任务
            Thread.sleep(60000)

            // 访问Activity成员
            runOnUiThread {
                updateUI()
            }
        }.start()

        // Thread持有Activity引用,即使Activity销毁Thread仍在运行
    }
}解决方案: 使用静态类或协程
kotlin
// ✅ Good: 使用Kotlin协程
class MainActivity : AppCompatActivity() {

    private val scope = CoroutineScope(Dispatchers.Main + Job())

    override fun onCreate(savedInstanceState: Bundle?) {
        super.onCreate(savedInstanceState)

        scope.launch {
            withContext(Dispatchers.IO) {
                // 后台任务
                delay(60000)
            }

            // 回到主线程更新UI
            updateUI()
        }
    }

    override fun onDestroy() {
        super.onDestroy()
        // 取消所有协程
        scope.cancel()
    }
}
4.3 单例模式持有Context
单例的生命周期是整个应用,如果持有Activity引用会导致严重泄漏。
错误示例: 单例持有Activity
kotlin
// ❌ Bad: 单例持有Activity
class LocationManager private constructor(private val context: Context) {

    companion object {
        @Volatile
        private var instance: LocationManager? = null

        fun getInstance(context: Context): LocationManager {
            return instance ?: synchronized(this) {
                instance ?: LocationManager(context).also { instance = it }
            }
        }
    }

    fun startLocationUpdates() {
        // 使用context注册监听器
    }
}

// Activity中使用
class MainActivity : AppCompatActivity() {
    override fun onCreate(savedInstanceState: Bundle?) {
        super.onCreate(savedInstanceState)

        // ⚠️ 传入Activity,导致单例持有Activity引用
        val locationManager = LocationManager.getInstance(this)
    }
}
解决方案: 使用ApplicationContext
kotlin
// ✅ Good: 单例使用ApplicationContext
class LocationManager private constructor(context: Context) {

    // 转换为ApplicationContext
    private val appContext: Context = context.applicationContext

    companion object {
        @Volatile
        private var instance: LocationManager? = null

        fun getInstance(context: Context): LocationManager {
            return instance ?: synchronized(this) {
                instance ?: LocationManager(context.applicationContext).also { instance = it }
            }
        }
    }

    fun startLocationUpdates() {
        // 使用appContext注册监听器
    }
}最佳实践: 所有单例涉及Context时,统一在Application中初始化:
kotlin
class MyApplication : Application() {
    override fun onCreate() {
        super.onCreate()

        // 统一初始化单例
        LocationManager.getInstance(this)
        DatabaseHelper.init(this)
        ImageLoader.init(this)
    }
}
4.4 未取消的监听器和回调
注册的监听器、回调如果未及时取消,会持有对象引用导致泄漏。
错误示例1: 未注销BroadcastReceiver
kotlin
// ❌ Bad: 注册Receiver未注销
class MainActivity : AppCompatActivity() {

    private val receiver = object : BroadcastReceiver() {
        override fun onReceive(context: Context?, intent: Intent?) {
            updateUI()
        }
    }

    override fun onCreate(savedInstanceState: Bundle?) {
        super.onCreate(savedInstanceState)

        // 动态注册Receiver
        val filter = IntentFilter("com.example.ACTION")
        registerReceiver(receiver, filter)

        // ⚠️ 忘记在onDestroy中注销
    }

    // 缺少onDestroy注销
}解决方案: 配对注册和注销
kotlin
// ✅ Good: 配对注册和注销
class MainActivity : AppCompatActivity() {

    private val receiver = object : BroadcastReceiver() {
        override fun onReceive(context: Context?, intent: Intent?) {
            updateUI()
        }
    }

    private var isReceiverRegistered = false

    override fun onCreate(savedInstanceState: Bundle?) {
        super.onCreate(savedInstanceState)

        val filter = IntentFilter("com.example.ACTION")
        registerReceiver(receiver, filter)
        isReceiverRegistered = true
    }

    override fun onDestroy() {
        super.onDestroy()

        // 注销Receiver
        if (isReceiverRegistered) {
            unregisterReceiver(receiver)
            isReceiverRegistered = false
        }
    }
}
错误示例2: 未移除Listener
kotlin
// ❌ Bad: 添加Listener未移除
class MainActivity : AppCompatActivity() {

    private val scrollListener = object : RecyclerView.OnScrollListener() {
        override fun onScrolled(recyclerView: RecyclerView, dx: Int, dy: Int) {
            updateHeader()
        }
    }

    override fun onCreate(savedInstanceState: Bundle?) {
        super.onCreate(savedInstanceState)

        recyclerView.addOnScrollListener(scrollListener)

        // ⚠️ 忘记移除Listener
    }
}解决方案: onDestroy中移除
kotlin
// ✅ Good: 移除Listener
class MainActivity : AppCompatActivity() {

    private val scrollListener = object : RecyclerView.OnScrollListener() {
        override fun onScrolled(recyclerView: RecyclerView, dx: Int, dy: Int) {
            updateHeader()
        }
    }

    override fun onCreate(savedInstanceState: Bundle?) {
        super.onCreate(savedInstanceState)

        recyclerView.addOnScrollListener(scrollListener)
    }

    override fun onDestroy() {
        super.onDestroy()

        // 移除Listener
        recyclerView.removeOnScrollListener(scrollListener)
    }
}
常见需要注销的组件
| 组件 | 注册方法 | 注销方法 | 注销时机 |
|---|---|---|---|
| BroadcastReceiver | registerReceiver() | unregisterReceiver() | onDestroy |
| EventBus | EventBus.register() | EventBus.unregister() | onDestroy |
| RxJava | subscribe() | dispose() | onDestroy |
| LiveData | observe() | removeObserver() | 自动管理(lifecycle-aware) |
| Animation | start() | cancel() | onPause/onDestroy |
| Handler Message | sendMessage() | removeCallbacksAndMessages(null) | onDestroy |
最佳实践: 使用Lifecycle感知组件自动管理生命周期:
kotlin
// ✅ Good: 使用LiveData自动管理
class MainActivity : AppCompatActivity() {

    private val viewModel: MyViewModel by viewModels()

    override fun onCreate(savedInstanceState: Bundle?) {
        super.onCreate(savedInstanceState)

        // LiveData会自动在onDestroy时移除观察者
        viewModel.data.observe(this) { data ->
            updateUI(data)
        }
    }

    // 无需手动注销
}
4.5 资源未关闭
File、Cursor、Stream等资源使用后必须关闭,否则会导致文件描述符泄漏。
错误示例: 文件未关闭
kotlin
// ❌ Bad: 文件未关闭
fun readFile(path: String): String {
    val inputStream = FileInputStream(path)
    val reader = BufferedReader(InputStreamReader(inputStream))
    return reader.readText()
    // ⚠️ 忘记关闭stream,导致文件描述符泄漏
}解决方案: 使用use()自动关闭
kotlin
// ✅ Good: 使用use自动关闭
fun readFile(path: String): String {
    return File(path).inputStream().use { inputStream ->
        BufferedReader(InputStreamReader(inputStream)).use { reader ->
            reader.readText()
        }
    }
}

// 或者简化为
fun readFile(path: String): String {
    return File(path).readText()
}
核心原则 : 所有Closeable资源都应该用use()包裹,确保自动关闭。
OOM问题分析与优化
OOM(Out Of Memory)是Android应用崩溃的首要原因。理解OOM类型和优化策略是每个Android开发者的必备技能。
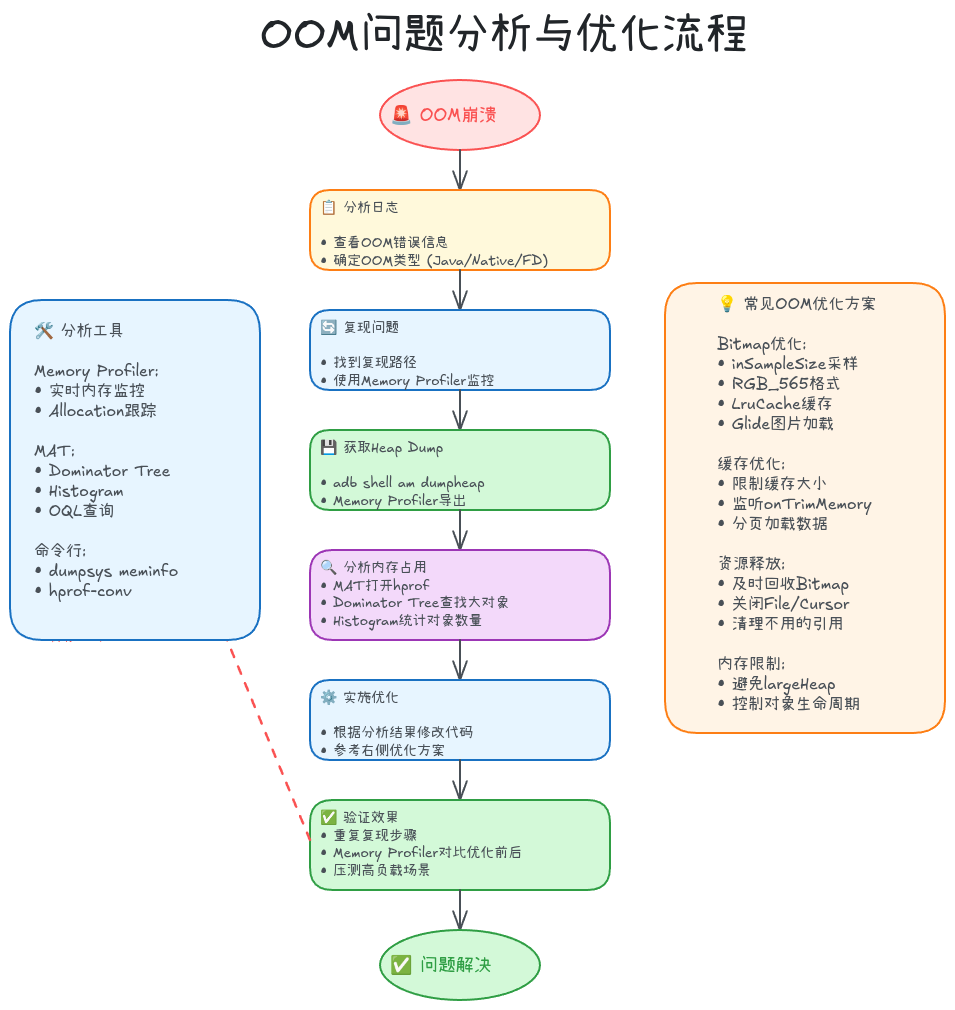
5.1 OOM类型分类
Android OOM有多种类型,需要针对性分析。
Java堆OOM
最常见的OOM,Java对象分配超过堆限制:
Fatal Exception: java.lang.OutOfMemoryError: Failed to allocate a 4194316 byte allocation with 2097152 free bytes and 2MB until OOM特征:
- 错误信息:
OutOfMemoryError: Failed to allocate - 原因: Bitmap、大数组、对象泄漏
Native堆OOM
Native代码分配内存失败:
Fatal signal 11 (SIGSEGV), code 1, fault addr 0x0 in tid 12345特征:
- 错误信息:
pthread_create failed: couldn't allocate或 SIGSEGV - 原因: JNI内存泄漏、第三方so库问题、Bitmap像素数据(Android 8.0+)
FD(文件描述符)耗尽
打开文件/Socket过多:
java.io.IOException: Could not open file: /data/xxx.db: Too many open files特征:
- 错误信息:
Too many open files - 原因: 文件/Cursor/Stream未关闭
线程数超限
创建线程过多:
java.lang.OutOfMemoryError: pthread_create (1040KB stack) failed: Try again特征:
- 错误信息:
pthread_create failed - 原因: 线程泄漏、线程池配置不当
查看当前线程数:
bash
adb shell ps -T <pid> | wc -l5.2 Bitmap内存优化
Bitmap是OOM的主要元凶,优化Bitmap加载是解决OOM的关键。
问题: 加载大图导致OOM
kotlin
// ❌ Bad: 直接加载大图
fun loadLargeImage(path: String): Bitmap {
    return BitmapFactory.decodeFile(path)
    // 4K图片(4096x2160 ARGB_8888)占用: 4096*2160*4 = 35MB
    // 可能直接OOM
}
优化1: 采样压缩 (inSampleSize)
kotlin
// ✅ Good: 按需采样加载
fun decodeSampledBitmapFromFile(
    path: String,
    reqWidth: Int,  // 需要的宽度
    reqHeight: Int  // 需要的高度
): Bitmap {
    return BitmapFactory.Options().run {
        // 第一次解码: 只获取图片尺寸
        inJustDecodeBounds = true
        BitmapFactory.decodeFile(path, this)

        val (actualWidth, actualHeight) = outWidth to outHeight

        // 计算采样率
        inSampleSize = calculateInSampleSize(actualWidth, actualHeight, reqWidth, reqHeight)

        // 第二次解码: 实际加载图片
        inJustDecodeBounds = false
        BitmapFactory.decodeFile(path, this)
    }
}

fun calculateInSampleSize(
    actualWidth: Int,
    actualHeight: Int,
    reqWidth: Int,
    reqHeight: Int
): Int {
    var inSampleSize = 1

    if (actualHeight > reqHeight || actualWidth > reqWidth) {
        val halfHeight = actualHeight / 2
        val halfWidth = actualWidth / 2

        // 计算最大的inSampleSize(2的幂次),保证缩放后尺寸仍大于需要的尺寸
        while ((halfHeight / inSampleSize) >= reqHeight &&
               (halfWidth / inSampleSize) >= reqWidth) {
            inSampleSize *= 2
        }
    }

    return inSampleSize
}

// 使用: 加载到ImageView (1080x1920屏幕)
val bitmap = decodeSampledBitmapFromFile(
    path = "/sdcard/large_image.jpg",
    reqWidth = 1080,
    reqHeight = 1920
)
imageView.setImageBitmap(bitmap)

// 4K图片采样后: 4096/4 x 2160/4 x 4 = 2.2MB (节省93%内存)核心原理:
inJustDecodeBounds = true: 只解析图片头部获取尺寸,不分配内存inSampleSize: 采样率,必须是2的幂次 (2, 4, 8, 16...)inSampleSize=4: 宽高各缩小4倍,内存占用减少16倍
优化2: 使用RGB_565格式
kotlin
// ✅ Good: 使用RGB_565减少内存
fun loadBitmapRGB565(path: String): Bitmap {
    return BitmapFactory.Options().run {
        inPreferredConfig = Bitmap.Config.RGB_565  // 2字节/像素
        BitmapFactory.decodeFile(path, this)
    }
}

// ARGB_8888: 4字节/像素 (透明度+RGB各1字节)
// RGB_565: 2字节/像素 (R5位+G6位+B5位,无透明度)
// 内存节省50%,适合不需要透明度的场景
优化3: Bitmap复用 (inBitmap)
kotlin
// ✅ Good: 复用Bitmap内存
class BitmapPool {
    private val reusableBitmaps = mutableSetOf<SoftReference<Bitmap>>()

    fun addBitmapToPool(bitmap: Bitmap) {
        reusableBitmaps.add(SoftReference(bitmap))
    }

    fun getBitmapFromPool(options: BitmapFactory.Options): Bitmap? {
        var bitmap: Bitmap? = null

        if (reusableBitmaps.isNotEmpty()) {
            val iterator = reusableBitmaps.iterator()
            while (iterator.hasNext()) {
                val item = iterator.next().get()

                if (item != null && item.isMutable) {
                    // 检查尺寸是否匹配
                    if (canUseForInBitmap(item, options)) {
                        bitmap = item
                        iterator.remove()
                        break
                    }
                } else {
                    iterator.remove()
                }
            }
        }

        return bitmap
    }

    private fun canUseForInBitmap(
        candidate: Bitmap,
        targetOptions: BitmapFactory.Options
    ): Boolean {
        val width = targetOptions.outWidth / targetOptions.inSampleSize
        val height = targetOptions.outHeight / targetOptions.inSampleSize
        val byteCount = width * height * getBytesPerPixel(candidate.config)

        return byteCount <= candidate.allocationByteCount
    }

    private fun getBytesPerPixel(config: Bitmap.Config): Int {
        return when (config) {
            Bitmap.Config.ARGB_8888 -> 4
            Bitmap.Config.RGB_565 -> 2
            Bitmap.Config.ARGB_4444 -> 2
            Bitmap.Config.ALPHA_8 -> 1
            else -> 1
        }
    }
}

// 使用复用池
val pool = BitmapPool()

fun loadBitmapWithReuse(path: String): Bitmap {
    return BitmapFactory.Options().run {
        inMutable = true
        inBitmap = pool.getBitmapFromPool(this)  // 尝试复用
        BitmapFactory.decodeFile(path, this)
    }
}
核心原理 : 设置inBitmap后,BitmapFactory会尝试复用该Bitmap的内存,避免重新分配。
优化4: 及时回收Bitmap
kotlin
// ✅ Good: 不用时及时回收
imageView.setImageBitmap(null)  // 清除ImageView引用
bitmap.recycle()  // 回收Bitmap内存

// 注意: recycle()后Bitmap不可再使用
5.3 LruCache缓存优化
使用LruCache管理内存缓存,自动淘汰旧数据。
kotlin
// ✅ Good: 使用LruCache管理图片缓存
class ImageCache {

    private val maxMemory = (Runtime.getRuntime().maxMemory() / 1024).toInt()  // KB
    private val cacheSize = maxMemory / 8  // 使用1/8堆内存作为缓存

    private val memoryCache = object : LruCache<String, Bitmap>(cacheSize) {

        // 计算每个Bitmap的大小(KB)
        override fun sizeOf(key: String, bitmap: Bitmap): Int {
            return bitmap.byteCount / 1024
        }

        // 移除时回收Bitmap
        override fun entryRemoved(
            evicted: Boolean,
            key: String?,
            oldValue: Bitmap?,
            newValue: Bitmap?
        ) {
            if (evicted && oldValue != null && !oldValue.isRecycled) {
                oldValue.recycle()
            }
        }
    }

    fun getBitmap(key: String): Bitmap? {
        return memoryCache.get(key)
    }

    fun putBitmap(key: String, bitmap: Bitmap) {
        if (getBitmap(key) == null) {
            memoryCache.put(key, bitmap)
        }
    }

    fun evictAll() {
        memoryCache.evictAll()
    }

    fun trimToSize(size: Int) {
        memoryCache.trimToSize(size)
    }
}

// 使用
val imageCache = ImageCache()

fun loadImageWithCache(url: String, imageView: ImageView) {
    val cached = imageCache.getBitmap(url)
    if (cached != null) {
        imageView.setImageBitmap(cached)
        return
    }

    // 从网络/磁盘加载
    loadImageAsync(url) { bitmap ->
        imageCache.putBitmap(url, bitmap)
        imageView.setImageBitmap(bitmap)
    }
}LruCache原理:
- LRU (Least Recently Used): 最近最少使用算法
- 缓存满时自动淘汰最久未使用的项
- 通过
sizeOf()计算每项大小 trimToSize()可手动缩减缓存
5.4 集成Glide优化图片加载
推荐使用Glide等成熟图片加载库,已内置大量优化:
kotlin
// ✅ Good: 使用Glide加载图片
dependencies {
    implementation("com.github.bumptech.glide:glide:4.15.1")
}

// 基本使用
Glide.with(context)
    .load(imageUrl)
    .placeholder(R.drawable.placeholder)  // 占位图
    .error(R.drawable.error)              // 错误图
    .into(imageView)

// 指定尺寸(自动采样)
Glide.with(context)
    .load(imageUrl)
    .override(800, 600)  // 指定目标尺寸
    .into(imageView)

// 使用缩略图
Glide.with(context)
    .load(imageUrl)
    .thumbnail(0.1f)  // 先加载10%尺寸的缩略图
    .into(imageView)

// 监听内存警告
override fun onTrimMemory(level: Int) {
    super.onTrimMemory(level)
    if (level >= ComponentCallbacks2.TRIM_MEMORY_MODERATE) {
        Glide.get(this).clearMemory()  // 清空内存缓存
    }
}Glide内置优化:
- 自动采样和缩放
- 三级缓存 (内存/磁盘/网络)
- Bitmap复用池
- 生命周期感知 (自动取消请求)
- 格式转换 (WebP/JPEG优化)
5.5 大对象缓存优化
除了图片,其他大对象也需要合理缓存。
分页加载
kotlin
// ✅ Good: 分页加载大数据
class DataRepository {

    private val pageSize = 50
    private val cache = LruCache<Int, List<Data>>(20)  // 缓存20页

    suspend fun loadPage(page: Int): List<Data> {
        // 先查缓存
        cache.get(page)?.let { return it }

        // 从数据库/网络加载
        val data = database.queryPage(page, pageSize)
        cache.put(page, data)

        return data
    }
}
及时释放资源
kotlin
// ✅ Good: 监听内存警告
override fun onTrimMemory(level: Int) {
    super.onTrimMemory(level)

    when (level) {
        ComponentCallbacks2.TRIM_MEMORY_UI_HIDDEN -> {
            // UI隐藏,释放UI资源
            releaseUIResources()
        }

        ComponentCallbacks2.TRIM_MEMORY_BACKGROUND -> {
            // 进入后台,释放部分缓存
            imageCache.trimToSize(imageCache.size() / 2)
        }

        ComponentCallbacks2.TRIM_MEMORY_COMPLETE -> {
            // 内存严重不足,清空所有缓存
            imageCache.evictAll()
            dataCache.clear()
        }
    }
}
实战案例: 图片浏览OOM优化
通过一个真实案例,展示完整的OOM问题分析和优化过程。
6.1 问题现象
场景: 图片浏览应用,用户快速滑动浏览大量高清图片时频繁OOM崩溃。
统计数据 (优化前):
- OOM崩溃率: 85次/万次启动
- 平均内存占用: 420MB (接近512MB堆限制)
- 内存峰值: 498MB (触发OOM)
- 用户反馈: 浏览50+张图片必然崩溃
6.2 问题分析
步骤1: 复现问题
kotlin
// 原始代码 (存在问题的版本)
class GalleryActivity : AppCompatActivity() {

    private val images = mutableListOf<Bitmap>()

    override fun onCreate(savedInstanceState: Bundle?) {
        super.onCreate(savedInstanceState)

        // 加载图片列表
        val imagePaths = getImagePaths()
        imagePaths.forEach { path ->
            val bitmap = BitmapFactory.decodeFile(path)  // ❌ 直接加载大图
            images.add(bitmap)  // ❌ 全部保存在内存
        }

        setupRecyclerView(images)
    }
}
步骤2: Memory Profiler分析
-
打开Memory Profiler监控内存
-
滑动浏览50张图片
-
观察内存曲线:
内存占用变化:
0s: 80MB (启动)
10s: 180MB (加载10张)
20s: 320MB (加载30张)
30s: 450MB (加载48张)
32s: 498MB → OOM崩溃 -
Dump Heap分析:
- Bitmap及byte\[\]占用: 385MB
- 单张4K图片: 35MB (4096x2160x4)
- 问题根源: 全量加载+未压缩+未复用
步骤3: 定位代码问题
通过MAT分析Heap Dump:
Dominator Tree:
├─ GalleryActivity @ 0x12a45000  Retained: 485MB
   ├─ images: ArrayList @ 0x12a46000  Retained: 385MB
   │  ├─ [0] Bitmap @ 0x12b00000  Retained: 35MB
   │  ├─ [1] Bitmap @ 0x12b50000  Retained: 35MB
   │  ├─ [2] Bitmap @ 0x12c00000  Retained: 35MB
│ ... (48 Bitmaps)问题点:
- 直接加载原图,未采样压缩
- ArrayList持有所有Bitmap引用
- RecyclerView未复用Bitmap
- 未使用缓存机制
6.3 优化方案
优化1: 采样加载
kotlin
// ✅ 优化: 按需采样加载
fun loadSampledBitmap(path: String, targetWidth: Int = 1080): Bitmap {
    return BitmapFactory.Options().run {
        inJustDecodeBounds = true
        BitmapFactory.decodeFile(path, this)

        // 计算采样率
        inSampleSize = calculateInSampleSize(outWidth, outHeight, targetWidth, targetWidth * 16 / 9)

        inJustDecodeBounds = false
        inPreferredConfig = Bitmap.Config.RGB_565  // 使用RGB_565
        BitmapFactory.decodeFile(path, this)
    }
}

// 内存占用: 35MB → 2.2MB (节省93%)
优化2: 使用Glide + LruCache
kotlin
// ✅ 优化: 集成Glide
class GalleryActivity : AppCompatActivity() {

    override fun onCreate(savedInstanceState: Bundle?) {
        super.onCreate(savedInstanceState)

        val imagePaths = getImagePaths()

        // 使用RecyclerView + Glide
        recyclerView.adapter = GalleryAdapter(imagePaths)
    }
}

class GalleryAdapter(private val imagePaths: List<String>) :
    RecyclerView.Adapter<GalleryAdapter.ViewHolder>() {

    override fun onBindViewHolder(holder: ViewHolder, position: Int) {
        val path = imagePaths[position]

        // Glide自动管理内存
        Glide.with(holder.itemView.context)
            .load(path)
            .override(1080, 1920)  // 指定目标尺寸
            .placeholder(R.drawable.placeholder)
            .into(holder.imageView)
    }

    class ViewHolder(view: View) : RecyclerView.ViewHolder(view) {
        val imageView: ImageView = view.findViewById(R.id.imageView)
    }
}
优化3: 预加载与复用
kotlin
// ✅ 优化: RecyclerView预加载
recyclerView.apply {
    // 设置RecycledViewPool
    setRecycledViewPool(RecyclerView.RecycledViewPool().apply {
        setMaxRecycledViews(0, 20)  // 缓存20个ViewHolder
    })

    // 设置预加载
    layoutManager = LinearLayoutManager(context).apply {
        isItemPrefetchEnabled = true
        initialPrefetchItemCount = 4
    }
}

// Glide预加载
fun preloadNextImages(startPosition: Int, count: Int) {
    for (i in startPosition until min(startPosition + count, imagePaths.size)) {
        Glide.with(this)
            .load(imagePaths[i])
            .preload(1080, 1920)
    }
}
优化4: 监听内存警告
kotlin
// ✅ 优化: 响应内存警告
override fun onTrimMemory(level: Int) {
    super.onTrimMemory(level)

    when (level) {
        ComponentCallbacks2.TRIM_MEMORY_RUNNING_LOW,
        ComponentCallbacks2.TRIM_MEMORY_RUNNING_CRITICAL -> {
            // 清空Glide内存缓存
            Glide.get(this).clearMemory()
        }

        ComponentCallbacks2.TRIM_MEMORY_UI_HIDDEN -> {
            // UI隐藏,清空部分缓存
            Glide.get(this).trimMemory(level)
        }
    }
}
6.4 优化效果
| 指标 | 优化前 | 优化后 | 改善幅度 |
|---|---|---|---|
| OOM崩溃率 | 85次/万次启动 | 3次/万次启动 | ↓ 96.5% |
| 平均内存占用 | 420MB | 95MB | ↓ 77% |
| 内存峰值 | 498MB | 156MB | ↓ 69% |
| 浏览体验 | 50张必崩溃 | 500+张流畅 | ↑ 10倍 |
优化措施贡献度:
- 采样加载 + RGB_565: 60% (35MB → 2.2MB/张)
- Glide LruCache自动管理: 25% (限制缓存大小)
- RecyclerView复用: 10% (减少对象创建)
- 内存警告响应: 5% (及时释放缓存)
6.5 验证与监控
自动化测试
kotlin
@Test
fun testImageLoadingMemory() {
    // 启动应用
    val scenario = ActivityScenario.launch(GalleryActivity::class.java)

    // 获取初始内存
    val initialMemory = getMemoryUsage()

    // 滑动加载100张图片
    onView(withId(R.id.recyclerView))
        .perform(RecyclerViewActions.scrollToPosition(100))

    // 触发GC
    Runtime.getRuntime().gc()
    Thread.sleep(1000)

    // 检查内存增长
    val currentMemory = getMemoryUsage()
    val memoryIncrease = currentMemory - initialMemory

    // 断言: 内存增长不超过200MB
    assert(memoryIncrease < 200 * 1024 * 1024) {
        "Memory increase exceeded 200MB: ${memoryIncrease / 1024 / 1024}MB"
    }
}

fun getMemoryUsage(): Long {
    val runtime = Runtime.getRuntime()
    return runtime.totalMemory() - runtime.freeMemory()
}
线上监控
kotlin
// 集成Firebase Crashlytics监控OOM
class MyApplication : Application() {

    override fun onCreate() {
        super.onCreate()

        // 监听内存警告
        registerComponentCallbacks(object : ComponentCallbacks2 {
            override fun onTrimMemory(level: Int) {
                val memoryInfo = getMemoryInfo()

                // 记录到Crashlytics
                FirebaseCrashlytics.getInstance().log(
                    "onTrimMemory: level=$level, availMem=${memoryInfo.availMem / 1024 / 1024}MB"
                )

                if (level >= ComponentCallbacks2.TRIM_MEMORY_RUNNING_CRITICAL) {
                    // 上报内存危机事件
                    FirebaseCrashlytics.getInstance().recordException(
                        Exception("Critical memory warning")
                    )
                }
            }

            override fun onConfigurationChanged(newConfig: Configuration) {}
            override fun onLowMemory() {}
        })
    }

    private fun getMemoryInfo(): ActivityManager.MemoryInfo {
        val activityManager = getSystemService(Context.ACTIVITY_SERVICE) as ActivityManager
        return ActivityManager.MemoryInfo().also {
            activityManager.getMemoryInfo(it)
        }
    }
}
内存监控与预警
建立完善的内存监控体系,可以在问题发生前预警和干预。
7.1 Runtime API监控
在应用运行时实时监控内存状态:
kotlin
class MemoryMonitor {

    fun getMemoryInfo(): MemoryInfo {
        val runtime = Runtime.getRuntime()
        val activityManager = context.getSystemService(Context.ACTIVITY_SERVICE) as ActivityManager
        val memInfo = ActivityManager.MemoryInfo()
        activityManager.getMemoryInfo(memInfo)

        return MemoryInfo(
            maxMemory = runtime.maxMemory(),        // 最大堆内存
            totalMemory = runtime.totalMemory(),    // 已分配堆内存
            freeMemory = runtime.freeMemory(),      // 堆中空闲内存
            usedMemory = runtime.totalMemory() - runtime.freeMemory(),  // 已使用内存
            systemAvailMem = memInfo.availMem,      // 系统可用内存
            systemTotalMem = memInfo.totalMem,      // 系统总内存
            systemLowMemory = memInfo.lowMemory     // 系统是否低内存
        )
    }

    fun getMemoryUsagePercent(): Float {
        val runtime = Runtime.getRuntime()
        val used = (runtime.totalMemory() - runtime.freeMemory()).toFloat()
        val max = runtime.maxMemory().toFloat()
        return (used / max) * 100
    }

    fun isMemoryWarning(): Boolean {
        return getMemoryUsagePercent() > 80  // 超过80%触发警告
    }
}

data class MemoryInfo(
    val maxMemory: Long,
    val totalMemory: Long,
    val freeMemory: Long,
    val usedMemory: Long,
    val systemAvailMem: Long,
    val systemTotalMem: Long,
    val systemLowMemory: Boolean
)
7.2 定期检测与告警
kotlin
class MemoryWatchdog(private val context: Context) {

    private val handler = Handler(Looper.getMainLooper())
    private val monitor = MemoryMonitor()
    private val checkInterval = 5000L  // 5秒检测一次

    private val checkRunnable = object : Runnable {
        override fun run() {
            checkMemory()
            handler.postDelayed(this, checkInterval)
        }
    }

    fun start() {
        handler.post(checkRunnable)
    }

    fun stop() {
        handler.removeCallbacks(checkRunnable)
    }

    private fun checkMemory() {
        val info = monitor.getMemoryInfo()
        val usagePercent = monitor.getMemoryUsagePercent()

        Log.d("MemoryWatchdog", "Memory usage: ${usagePercent.toInt()}%")

        // 内存预警
        when {
            usagePercent > 90 -> {
                Log.e("MemoryWatchdog", "CRITICAL: Memory usage ${usagePercent.toInt()}%")
                onMemoryCritical()
            }
            usagePercent > 80 -> {
                Log.w("MemoryWatchdog", "WARNING: Memory usage ${usagePercent.toInt()}%")
                onMemoryWarning()
            }
        }

        // 上报监控数据
        reportMemoryMetrics(info, usagePercent)
    }

    private fun onMemoryWarning() {
        // 清理部分缓存
        context.applicationContext.apply {
            if (this is Application) {
                (this as? ComponentCallbacks2)?.onTrimMemory(
                    ComponentCallbacks2.TRIM_MEMORY_RUNNING_LOW
                )
            }
        }
    }

    private fun onMemoryCritical() {
        // 紧急清理所有缓存
        Glide.get(context).clearMemory()

        // 通知所有Activity
        context.applicationContext.apply {
            if (this is Application) {
                (this as? ComponentCallbacks2)?.onTrimMemory(
                    ComponentCallbacks2.TRIM_MEMORY_RUNNING_CRITICAL
                )
            }
        }

        // 触发GC
        Runtime.getRuntime().gc()
    }

    private fun reportMemoryMetrics(info: MemoryInfo, usagePercent: Float) {
        // 上报到监控平台
        FirebaseAnalytics.getInstance(context).logEvent("memory_usage") {
            param("usage_percent", usagePercent.toLong())
            param("used_mb", (info.usedMemory / 1024 / 1024).toInt().toLong())
            param("max_mb", (info.maxMemory / 1024 / 1024).toInt().toLong())
        }
    }
}

// Application中启动
class MyApplication : Application() {
    private lateinit var memoryWatchdog: MemoryWatchdog

    override fun onCreate() {
        super.onCreate()

        memoryWatchdog = MemoryWatchdog(this)
        memoryWatchdog.start()
    }
}
7.3 内存泄漏自动检测
集成LeakCanary在开发阶段自动检测:
kotlin
// build.gradle.kts
dependencies {
    debugImplementation("com.squareup.leakcanary:leakcanary-android:2.12")
}

// 自定义LeakCanary配置
class MyApplication : Application() {
    override fun onCreate() {
        super.onCreate()

        // 自定义LeakCanary配置 (可选)
        LeakCanary.config = LeakCanary.config.copy(
            dumpHeap = true,  // 发现泄漏时Dump堆
            retainedVisibleThreshold = 3  // 保留3个对象未回收时告警
        )
    }
}
7.4 线上OOM监控
通过Firebase Crashlytics监控线上OOM:
kotlin
class CrashReportingTree : Timber.Tree() {
    override fun log(priority: Int, tag: String?, message: String, t: Throwable?) {
        if (priority < Log.WARN) return

        val crashlytics = FirebaseCrashlytics.getInstance()
        crashlytics.log("$tag: $message")

        t?.let {
            if (it is OutOfMemoryError) {
                // OOM特殊处理
                val memoryInfo = getMemorySnapshot()
                crashlytics.setCustomKey("oom_heap_used", memoryInfo.usedMemory)
                crashlytics.setCustomKey("oom_heap_max", memoryInfo.maxMemory)
            }
            crashlytics.recordException(it)
        }
    }

    private fun getMemorySnapshot(): MemoryInfo {
        return MemoryMonitor().getMemoryInfo()
    }
}

// Application中初始化
Timber.plant(CrashReportingTree())
总结与最佳实践
8.1 核心要点回顾
内存管理机制:
- Java堆受heapgrowthlimit限制,普通应用通常192-256MB
- GC无法回收被GC Root直接或间接引用的对象
- LMK根据oom_adj值从高到低杀进程释放内存
- 监听onTrimMemory()及时释放缓存
内存分析工具:
- Memory Profiler: 实时监控,快速定位内存增长
- MAT: 深度分析Heap Dump,查找泄漏根源
- LeakCanary: 自动化泄漏检测,开发必备
- 命令行工具: dumpsys meminfo用于脚本监控
常见泄漏场景:
- 静态变量持有Activity → 使用ApplicationContext
- Handler内部类持有Activity → 静态类+弱引用
- 单例持有Context → 转换为ApplicationContext
- 未注销Listener/Receiver → onDestroy中配对注销
- 资源未关闭 → 使用use()自动关闭
OOM优化:
- Bitmap采样加载: inSampleSize降低内存
- 使用RGB_565格式节省50%内存
- LruCache管理缓存,自动淘汰旧数据
- 集成Glide简化图片加载和内存管理
- 监听onTrimMemory()及时释放资源
8.2 最佳实践清单
开发阶段:
- ✅ 所有Activity销毁后检查LeakCanary报告
- ✅ 使用Memory Profiler监控内存曲线
- ✅ Bitmap加载必须采样,禁止直接BitmapFactory.decodeFile()
- ✅ 长生命周期对象(单例/静态)不持有短生命周期对象(Activity/View)
- ✅ Handler/Thread/Runnable使用静态类+弱引用
- ✅ 所有Closeable资源用use()包裹
测试阶段:
- ✅ 编写自动化测试验证内存增长
- ✅ 使用Monkey测试长时间运行稳定性
- ✅ 分析MAT Heap Dump检查大对象
- ✅ 压测高负载场景 (快速滑动/频繁切换)
生产阶段:
- ✅ 集成Crashlytics监控OOM崩溃率
- ✅ 定期分析线上OOM堆栈
- ✅ 监控关键页面内存指标
- ✅ A/B测试内存优化效果
代码规范:
kotlin
// ✅ DO: 正确的内存管理
class GoodActivity : AppCompatActivity() {

    // 使用ViewModel管理数据
    private val viewModel: MyViewModel by viewModels()

    // 静态Handler + 弱引用
    private val handler = MyHandler(this)

    override fun onCreate(savedInstanceState: Bundle?) {
        super.onCreate(savedInstanceState)

        // 使用Glide加载图片
        Glide.with(this)
            .load(url)
            .override(800, 600)
            .into(imageView)

        // LiveData自动管理生命周期
        viewModel.data.observe(this) { data ->
            updateUI(data)
        }
    }

    override fun onDestroy() {
        super.onDestroy()
        // 清理Handler消息
        handler.removeCallbacksAndMessages(null)
    }

    private class MyHandler(activity: GoodActivity) : Handler(Looper.getMainLooper()) {
        private val activityRef = WeakReference(activity)

        override fun handleMessage(msg: Message) {
            activityRef.get()?.let { activity ->
                if (!activity.isFinishing) {
                    // 安全使用Activity
                }
            }
        }
    }
}

// ❌ DON'T: 错误的内存管理
class BadActivity : AppCompatActivity() {
    companion object {
        var sContext: Context? = null  // ❌ 静态变量持有Context
    }

    private val handler = object : Handler() {  // ❌ 匿名内部类持有Activity
        override fun handleMessage(msg: Message) {
            updateUI()
        }
    }

    override fun onCreate(savedInstanceState: Bundle?) {
        super.onCreate(savedInstanceState)

        sContext = this  // ❌ 存储Activity到静态变量

        val bitmap = BitmapFactory.decodeFile(path)  // ❌ 直接加载大图
        imageView.setImageBitmap(bitmap)

        handler.sendEmptyMessageDelayed(0, 60000)  // ❌ 长时间持有Activity
    }

    // ❌ 缺少onDestroy清理
}
8.3 延伸阅读
AOSP源码:
- ART GC实现:
art/runtime/gc/ - LMK机制:
system/core/lmkd/lmkd.c - ActivityManager内存管理:
frameworks/base/services/core/java/com/android/server/am/
工具文档:
系列文章:
作者简介: 多年Android系统开发经验,专注于系统稳定性与性能优化领域。欢迎关注本系列,一起深入Android系统的精彩世界!