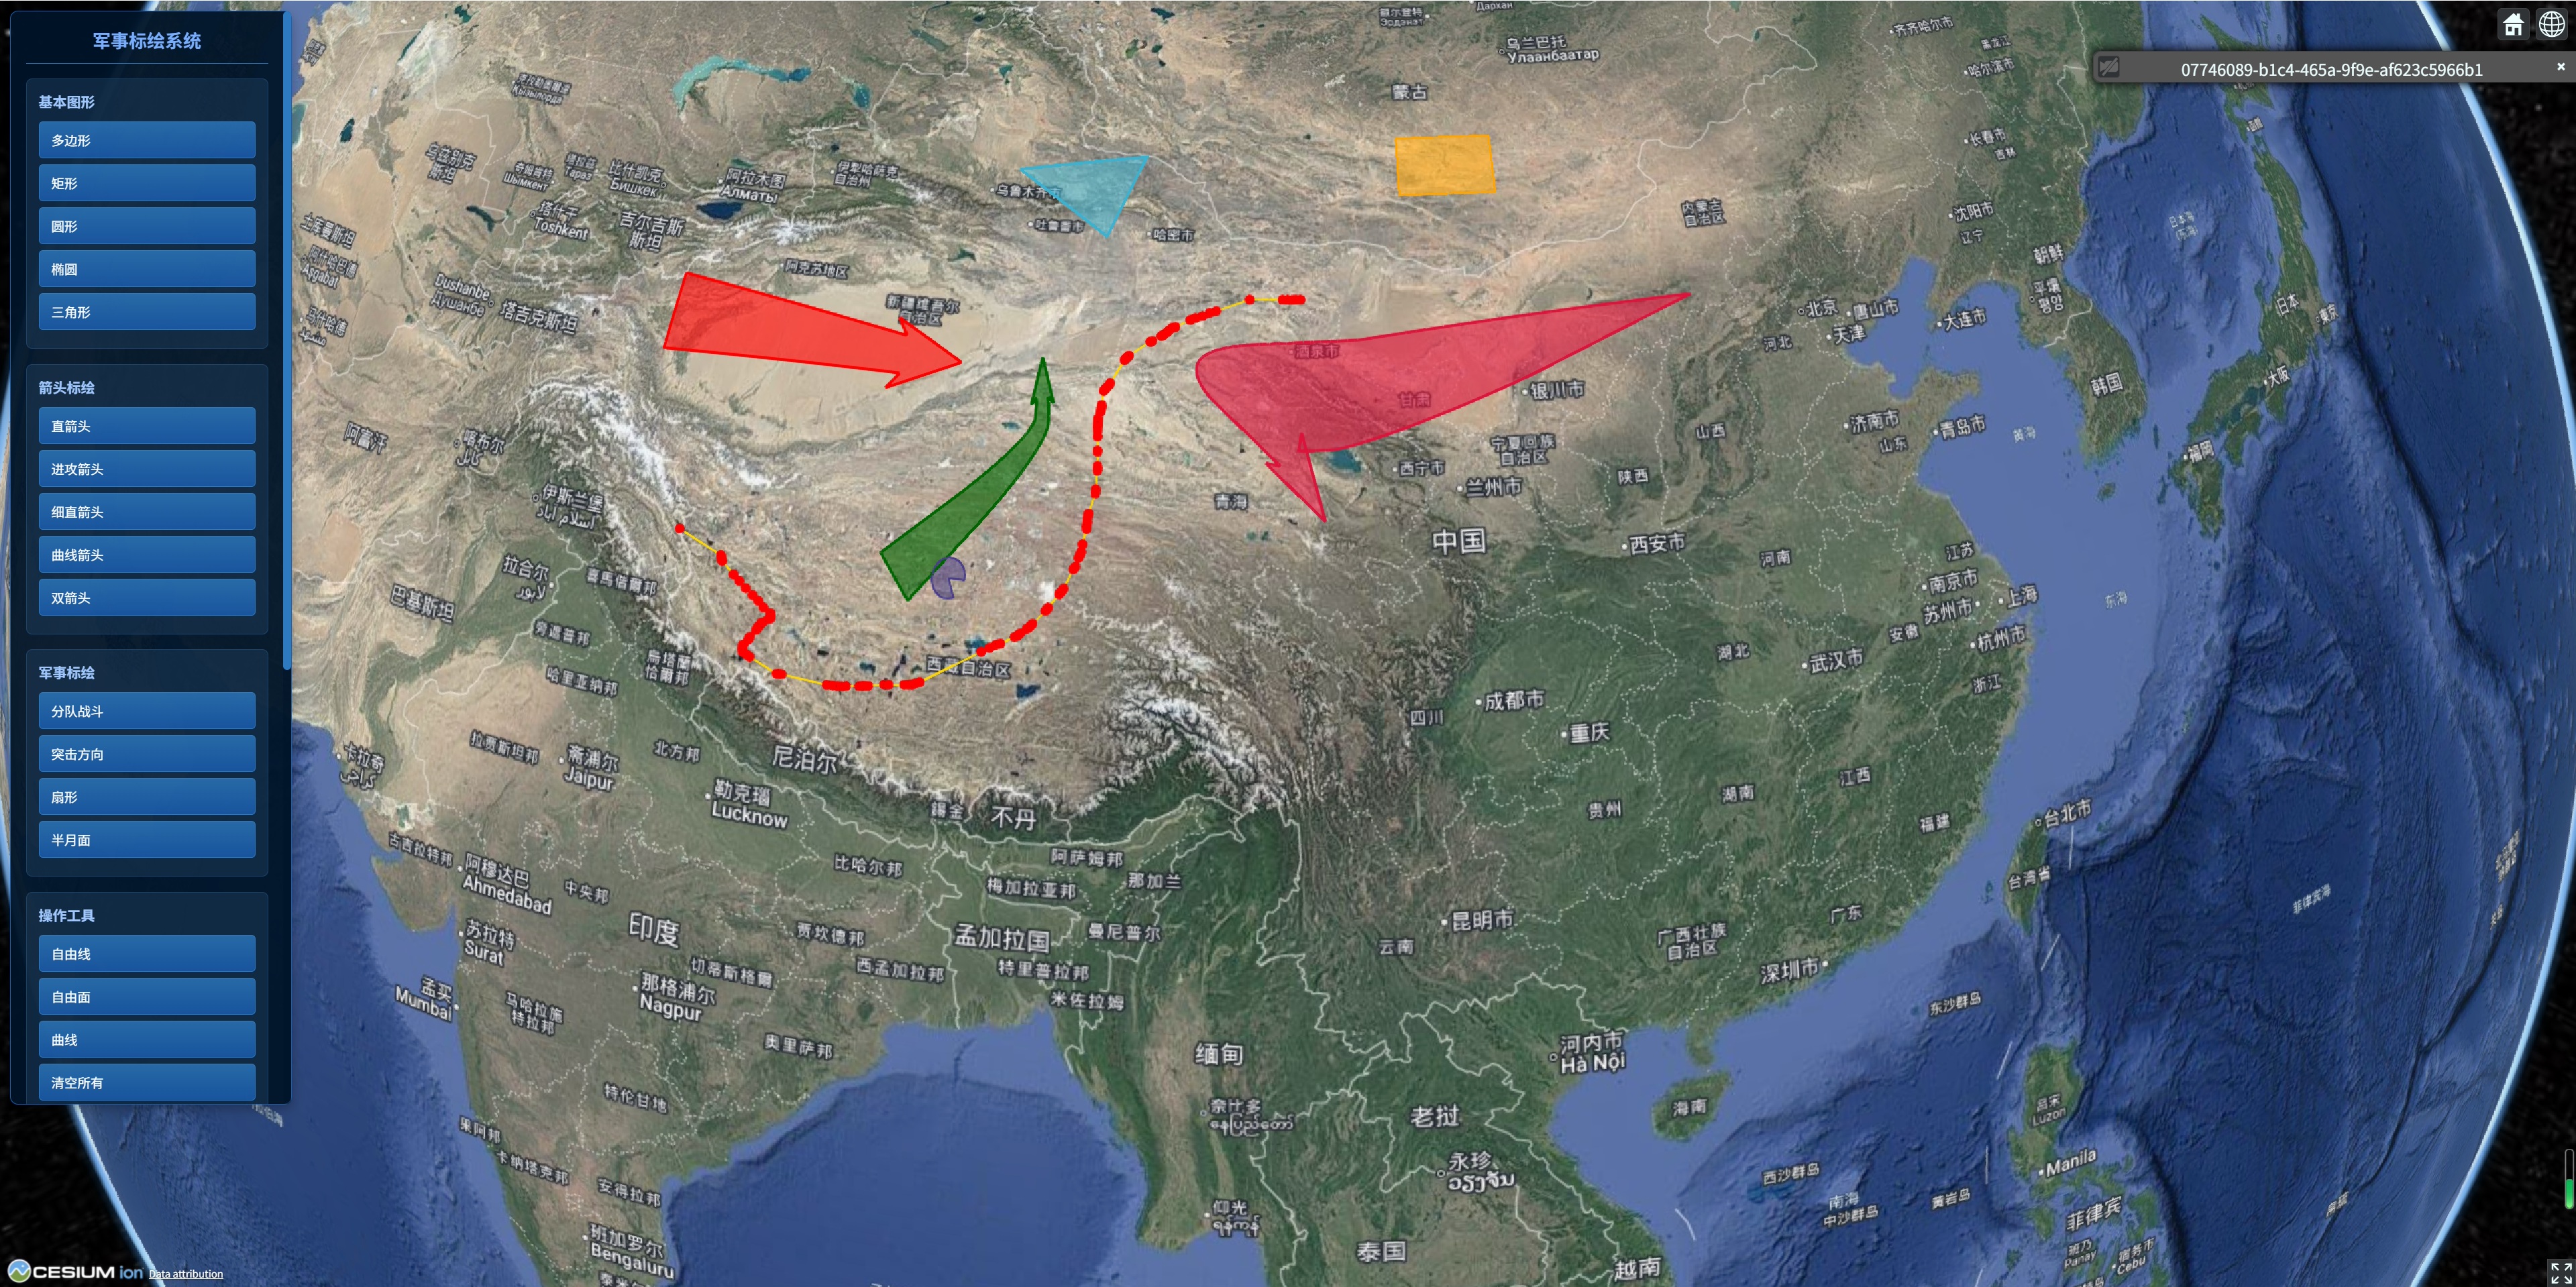
效果图:
1.下载
cesium 军事标绘插件,支持绘制多边形、曲线、箭头等图形
npm i cesium
npm i cesium-plot-js
2.引用
import * as Cesium from 'cesium'
注意:这里导入的是 CesiumPlot,不是 Plot
import CesiumPlot from 'cesium-plot-js';
3.调用绘制 api
new CesiumPlot.FineArrow(Cesium, viewer);
4.内置图形
| 类名 | 类型 | 描述 | 生长动画 |
|---|---|---|---|
| Polygon | 'polygon' | 多边形 | ❌ |
| Reactangle | 'polygon' | 矩形 | ❌ |
| Triangle | 'polygon' | 三角形 | ❌ |
| Circle | 'polygon' | 圆形 | ❌ |
| Sector | 'polygon' | 扇形 | ❌ |
| StraightArrow | 'line' | 细直箭头 | ✔️ |
| CurvedArrow | 'line' | 曲线箭头 | ✔️ |
| FineArrow | 'polygon' | 直箭头 | ✔️ |
| AttackArrow | 'polygon' | 进攻方向箭头 | ✔️ |
| SwallowtailAttackArrow | 'polygon' | 燕尾进攻方向箭头 | ✔️ |
| SquadCombat | 'polygon' | 分队战斗方向 | ✔️ |
| SwallowtailSquadCombat | 'polygon' | 燕尾分队战斗方向 | ✔️ |
| AssaultDirection | 'polygon' | 突击方向 | ✔️ |
| DoubleArrow | 'polygon' | 双箭头 | ✔️ |
| FreehandLine | 'line' | 自由线 | ❌ |
| FreehandPolygon | 'polygon' | 自由面 | ❌ |
| Curve | 'line' | 曲线 | ❌ |
| Ellipse | 'polygon' | 椭圆 | ❌ |
| Lune | 'polygon' | 半月面 | ❌ |
4.内置方法
| 方法名 | 参数 | 描述 |
|---|---|---|
| hide | options?: [AnimationOpts](#方法名 参数 描述 hide options?: AnimationOpts 隐藏,options 可配置动画参数,参数缺省时,不显示动画 show options?: AnimationOpts 显示,options 可配置动画参数,参数缺省时,不显示动画 startGrowthAnimation options?: AnimationOpts 生长动画,options 可配置动画参数 getPoints 获取图形关键点位 remove 删除 on (event: EventType, listener: (eventData?: any) => void) 绑定事件 off (event: EventType) 解绑事件) | 隐藏,options 可配置动画参数,参数缺省时,不显示动画 |
| show | options?: [AnimationOpts](#方法名 参数 描述 hide options?: AnimationOpts 隐藏,options 可配置动画参数,参数缺省时,不显示动画 show options?: AnimationOpts 显示,options 可配置动画参数,参数缺省时,不显示动画 startGrowthAnimation options?: AnimationOpts 生长动画,options 可配置动画参数 getPoints 获取图形关键点位 remove 删除 on (event: EventType, listener: (eventData?: any) => void) 绑定事件 off (event: EventType) 解绑事件) | 显示,options 可配置动画参数,参数缺省时,不显示动画 |
| startGrowthAnimation | options?: [AnimationOpts](#方法名 参数 描述 hide options?: AnimationOpts 隐藏,options 可配置动画参数,参数缺省时,不显示动画 show options?: AnimationOpts 显示,options 可配置动画参数,参数缺省时,不显示动画 startGrowthAnimation options?: AnimationOpts 生长动画,options 可配置动画参数 getPoints 获取图形关键点位 remove 删除 on (event: EventType, listener: (eventData?: any) => void) 绑定事件 off (event: EventType) 解绑事件) | 生长动画,options 可配置动画参数 |
| getPoints | 获取图形关键点位 | |
| remove | 删除 | |
| on | (event: [EventType](#方法名 参数 描述 hide options?: AnimationOpts 隐藏,options 可配置动画参数,参数缺省时,不显示动画 show options?: AnimationOpts 显示,options 可配置动画参数,参数缺省时,不显示动画 startGrowthAnimation options?: AnimationOpts 生长动画,options 可配置动画参数 getPoints 获取图形关键点位 remove 删除 on (event: EventType, listener: (eventData?: any) => void) 绑定事件 off (event: EventType) 解绑事件), listener: (eventData?: any) => void) | 绑定事件 |
| off | (event: [EventType](#方法名 参数 描述 hide options?: AnimationOpts 隐藏,options 可配置动画参数,参数缺省时,不显示动画 show options?: AnimationOpts 显示,options 可配置动画参数,参数缺省时,不显示动画 startGrowthAnimation options?: AnimationOpts 生长动画,options 可配置动画参数 getPoints 获取图形关键点位 remove 删除 on (event: EventType, listener: (eventData?: any) => void) 绑定事件 off (event: EventType) 解绑事件)) | 解绑事件 |
AnimationOpts类型
| 参数 | 类型 | 默认值 | 描述 |
|---|---|---|---|
| duration | number | 2000 | 动画持续时间(ms) |
| delay | number | 0 | 动画延迟启动时间(ms) |
| callback | () => void | - | 动画结束回调 |
5.完整代码示例
bash
<template>
<div id="cesiumContainer"></div>
<!-- 标绘工具栏 -->
<div class="plot-toolbar">
<div class="toolbar-header">军事标绘系统</div>
<div class="tool-group">
<h4>基本图形</h4>
<button @click="drawPolygon">多边形</button>
<button @click="drawRectangle">矩形</button>
<button @click="drawCircle">圆形</button>
<button @click="drawEllipse">椭圆</button>
<button @click="drawTriangle">三角形</button>
</div>
<div class="tool-group">
<h4>箭头标绘</h4>
<button @click="drawFineArrow">直箭头</button>
<button @click="drawAttackArrow">进攻箭头</button>
<button @click="drawStraightArrow">细直箭头</button>
<button @click="drawCurvedArrow">曲线箭头</button>
<button @click="drawDoubleArrow">双箭头</button>
</div>
<div class="tool-group">
<h4>军事标绘</h4>
<button @click="drawSquadCombat">分队战斗</button>
<button @click="drawAssaultDirection">突击方向</button>
<button @click="drawSector">扇形</button>
<button @click="drawLune">半月面</button>
</div>
<div class="tool-group">
<h4>操作工具</h4>
<button @click="drawFreehandLine">自由线</button>
<button @click="drawFreehandPolygon">自由面</button>
<button @click="drawCurve">曲线</button>
<button @click="clearAll">清空所有</button>
<button @click="exportData">导出数据</button>
</div>
<!-- 动画控制 -->
<div class="tool-group">
<h4>动画控制</h4>
<button @click="showAll">显示所有</button>
<button @click="hideAll">隐藏所有</button>
<button @click="startGrowthAnimation">生长动画</button>
</div>
<!-- 标绘列表 -->
<div class="plot-list" v-if="plots.length > 0">
<h4>标绘列表 ({{ plots.length }})</h4>
<div class="list-item" v-for="(plot, index) in plots" :key="plot.id" @click="selectPlot(index)"
:class="{ selected: selectedPlotIndex === index }">
<span class="plot-type">{{ getPlotTypeIcon(plot.type) }}</span>
<span class="plot-name">{{ plot.name || `标绘 ${index + 1}` }}</span>
<div class="plot-actions">
<button @click.stop="showPlot(index)" title="显示">👁️</button>
<button @click.stop="hidePlot(index)" title="隐藏">👁️🗨️</button>
<button @click.stop="removePlot(index)" title="删除">🗑️</button>
</div>
</div>
</div>
</div>
</template>
<script setup>
import { onMounted, onUnmounted, ref, reactive } from 'vue'
import * as Cesium from 'cesium'
import CesiumPlot from 'cesium-plot-js'
const viewer = ref(null)
const plots = reactive([])
const selectedPlotIndex = ref(-1)
const initViewer = () => {
viewer.value = new Cesium.Viewer("cesiumContainer", {
imageryProvider: false,
baseLayerPicker: false,
animation: false,
timeline: false,
geocoder: false,
homeButton: true,
sceneModePicker: true,
navigationHelpButton: false,
fullscreenButton: true
});
// 添加本地瓦片底图
const localTileProvider = new Cesium.UrlTemplateImageryProvider({
url: '地图资源地址/{z}/{x}/{y}.png',
fileExtension: 'png',
maximumLevel: 19,
tilingScheme: new Cesium.WebMercatorTilingScheme(),
credit: 'Local Tile Map'
});
viewer.value.imageryLayers.addImageryProvider(localTileProvider);
// 设置默认视角
viewer.value.camera.setView({
destination: Cesium.Cartesian3.fromDegrees(116.4, 39.9, 1000000)
});
console.log('Cesium Viewer 初始化成功')
console.log('CesiumPlot:', CesiumPlot)
// 开启抗锯齿(推荐)
viewer.value.scene.postProcessStages.fxaa.enabled = true;
}
// 基本图形标绘
const drawPolygon = () => {
const geometry = new CesiumPlot.Polygon(Cesium, viewer.value, {
material: Cesium.Color.fromCssColorString('rgba(59, 178, 208, 0.5)'),
outlineMaterial: Cesium.Color.fromCssColorString('rgba(59, 178, 208, 1)'),
outlineWidth: 3,
})
setupGeometry(geometry, 'polygon', '多边形')
}
const drawRectangle = () => {
const geometry = new CesiumPlot.Reactangle(Cesium, viewer.value, {
material: Cesium.Color.fromCssColorString('rgba(255, 165, 0, 0.5)'),
outlineMaterial: Cesium.Color.fromCssColorString('rgba(255, 165, 0, 1)'),
outlineWidth: 2,
})
setupGeometry(geometry, 'rectangle', '矩形')
}
const drawCircle = () => {
const geometry = new CesiumPlot.Circle(Cesium, viewer.value, {
material: Cesium.Color.fromCssColorString('rgba(50, 205, 50, 0.4)'),
outlineMaterial: Cesium.Color.fromCssColorString('rgba(50, 205, 50, 1)'),
outlineWidth: 2,
})
setupGeometry(geometry, 'circle', '圆形')
}
const drawEllipse = () => {
const geometry = new CesiumPlot.Ellipse(Cesium, viewer.value, {
material: Cesium.Color.fromCssColorString('rgba(138, 43, 226, 0.4)'),
outlineMaterial: Cesium.Color.fromCssColorString('rgba(138, 43, 226, 1)'),
outlineWidth: 2,
})
setupGeometry(geometry, 'ellipse', '椭圆')
}
const drawTriangle = () => {
const geometry = new CesiumPlot.Triangle(Cesium, viewer.value, {
material: Cesium.Color.fromCssColorString('rgba(255, 99, 71, 0.5)'),
outlineMaterial: Cesium.Color.fromCssColorString('rgba(255, 99, 71, 1)'),
outlineWidth: 2,
})
setupGeometry(geometry, 'triangle', '三角形')
}
// 箭头标绘
const drawFineArrow = () => {
const geometry = new CesiumPlot.FineArrow(Cesium, viewer.value, {
material: Cesium.Color.fromCssColorString('rgba(255, 0, 0, 0.6)'),
outlineMaterial: Cesium.Color.fromCssColorString('rgba(255, 0, 0, 1)'),
outlineWidth: 3,
})
setupGeometry(geometry, 'fineArrow', '直箭头')
}
const drawAttackArrow = () => {
const geometry = new CesiumPlot.AttackArrow(Cesium, viewer.value, {
material: Cesium.Color.fromCssColorString('rgba(220, 20, 60, 0.6)'),
outlineMaterial: Cesium.Color.fromCssColorString('rgba(220, 20, 60, 1)'),
outlineWidth: 3,
})
setupGeometry(geometry, 'attackArrow', '进攻箭头')
}
const drawStraightArrow = () => {
const geometry = new CesiumPlot.StraightArrow(Cesium, viewer.value, {
material: Cesium.Color.fromCssColorString('rgba(30, 144, 255, 1)'),
lineWidth: 3,
})
setupGeometry(geometry, 'straightArrow', '细直箭头')
}
const drawCurvedArrow = () => {
const geometry = new CesiumPlot.CurvedArrow(Cesium, viewer.value, {
material: Cesium.Color.fromCssColorString('rgba(0, 191, 255, 1)'),
lineWidth: 3,
})
setupGeometry(geometry, 'curvedArrow', '曲线箭头')
}
const drawDoubleArrow = () => {
const geometry = new CesiumPlot.DoubleArrow(Cesium, viewer.value, {
material: Cesium.Color.fromCssColorString('rgba(255, 140, 0, 0.6)'),
outlineMaterial: Cesium.Color.fromCssColorString('rgba(255, 140, 0, 1)'),
outlineWidth: 3,
})
setupGeometry(geometry, 'doubleArrow', '双箭头')
}
// 军事标绘
const drawSquadCombat = () => {
const geometry = new CesiumPlot.SquadCombat(Cesium, viewer.value, {
material: Cesium.Color.fromCssColorString('rgba(0, 100, 0, 0.6)'),
outlineMaterial: Cesium.Color.fromCssColorString('rgba(0, 100, 0, 1)'),
outlineWidth: 3,
})
setupGeometry(geometry, 'squadCombat', '分队战斗')
}
const drawAssaultDirection = () => {
const geometry = new CesiumPlot.AssaultDirection(Cesium, viewer.value, {
material: Cesium.Color.fromCssColorString('rgba(139, 0, 0, 0.6)'),
outlineMaterial: Cesium.Color.fromCssColorString('rgba(139, 0, 0, 1)'),
outlineWidth: 3,
})
setupGeometry(geometry, 'assaultDirection', '突击方向')
}
const drawSector = () => {
const geometry = new CesiumPlot.Sector(Cesium, viewer.value, {
material: Cesium.Color.fromCssColorString('rgba(72, 61, 139, 0.5)'),
outlineMaterial: Cesium.Color.fromCssColorString('rgba(72, 61, 139, 1)'),
outlineWidth: 2,
})
setupGeometry(geometry, 'sector', '扇形')
}
const drawLune = () => {
const geometry = new CesiumPlot.Lune(Cesium, viewer.value, {
material: Cesium.Color.fromCssColorString('rgba(199, 21, 133, 0.5)'),
outlineMaterial: Cesium.Color.fromCssColorString('rgba(199, 21, 133, 1)'),
outlineWidth: 2,
})
setupGeometry(geometry, 'lune', '半月面')
}
// 自由绘制
const drawFreehandLine = () => {
const geometry = new CesiumPlot.FreehandLine(Cesium, viewer.value, {
material: Cesium.Color.fromCssColorString('rgba(255, 215, 0, 1)'),
lineWidth: 2,
})
setupGeometry(geometry, 'freehandLine', '自由线')
}
const drawFreehandPolygon = () => {
const geometry = new CesiumPlot.FreehandPolygon(Cesium, viewer.value, {
material: Cesium.Color.fromCssColorString('rgba(218, 165, 32, 0.5)'),
outlineMaterial: Cesium.Color.fromCssColorString('rgba(218, 165, 32, 1)'),
outlineWidth: 2,
})
setupGeometry(geometry, 'freehandPolygon', '自由面')
}
const drawCurve = () => {
const geometry = new CesiumPlot.Curve(Cesium, viewer.value, {
material: Cesium.Color.fromCssColorString('rgba(106, 90, 205, 1)'),
lineWidth: 2,
})
setupGeometry(geometry, 'curve', '曲线')
}
// 设置几何图形的事件监听
const setupGeometry = (geometry, type, name) => {
const plotData = {
id: `plot_${Date.now()}_${Math.random().toString(36).substr(2, 9)}`,
type: type,
name: name,
geometry: geometry,
visible: true
}
// 监听绘制完成事件
geometry.on('drawEnd', (points) => {
console.log(`${name} 绘制完成,关键点:`, points)
plotData.points = points
})
// 监听绘制开始事件
geometry.on('drawStart', () => {
console.log(`${name} 开始绘制`)
})
// 监听绘制更新事件
geometry.on('drawUpdate', (point) => {
// 可以在这里实时更新显示
})
// 添加到列表
plots.push(plotData)
selectedPlotIndex.value = plots.length - 1
console.log(`已添加 ${name} 标绘`)
}
// 动画控制
const showAll = () => {
plots.forEach((plot, index) => {
if (plot.geometry && !plot.visible) {
plot.geometry.show({
duration: 1000,
callback: () => {
plot.visible = true
console.log(`标绘 ${index} 显示完成`)
}
})
}
})
}
const hideAll = () => {
plots.forEach((plot, index) => {
if (plot.geometry && plot.visible) {
plot.geometry.hide({
duration: 1000,
callback: () => {
plot.visible = false
console.log(`标绘 ${index} 隐藏完成`)
}
})
}
})
}
const startGrowthAnimation = () => {
if (selectedPlotIndex.value >= 0) {
const plot = plots[selectedPlotIndex.value]
if (plot.geometry) {
plot.geometry.startGrowthAnimation({
duration: 2000,
callback: () => {
console.log(`${plot.name} 生长动画完成`)
}
})
}
} else {
alert('请先选择一个标绘')
}
}
// 操作单个标绘
const selectPlot = (index) => {
selectedPlotIndex.value = index
console.log(`选中标绘: ${plots[index].name}`)
}
const showPlot = (index) => {
const plot = plots[index]
if (plot.geometry) {
plot.geometry.show({
duration: 500,
callback: () => {
plot.visible = true
}
})
}
}
const hidePlot = (index) => {
const plot = plots[index]
if (plot.geometry) {
plot.geometry.hide({
duration: 500,
callback: () => {
plot.visible = false
}
})
}
}
const removePlot = (index) => {
const plot = plots[index]
if (plot.geometry) {
plot.geometry.remove()
plots.splice(index, 1)
if (selectedPlotIndex.value === index) {
selectedPlotIndex.value = -1
} else if (selectedPlotIndex.value > index) {
selectedPlotIndex.value--
}
console.log(`已删除标绘: ${plot.name}`)
}
}
// 工具函数
const clearAll = () => {
if (confirm('确定要清空所有标绘吗?')) {
plots.forEach(plot => {
if (plot.geometry) {
plot.geometry.remove()
}
})
plots.length = 0
selectedPlotIndex.value = -1
console.log('已清空所有标绘')
}
}
const exportData = () => {
const exportPlots = plots.map(plot => ({
id: plot.id,
type: plot.type,
name: plot.name,
points: plot.points,
visible: plot.visible
}))
const blob = new Blob([JSON.stringify(exportPlots, null, 2)], {
type: 'application/json'
})
const url = URL.createObjectURL(blob)
const a = document.createElement('a')
a.href = url
a.download = `military-plots-${Date.now()}.json`
document.body.appendChild(a)
a.click()
document.body.removeChild(a)
URL.revokeObjectURL(url)
console.log(`已导出 ${exportPlots.length} 个标绘`)
}
const getPlotTypeIcon = (type) => {
const icons = {
polygon: '⬢',
rectangle: '⬛',
circle: '⭕',
ellipse: '⬬',
triangle: '▲',
fineArrow: '➡️',
attackArrow: '⚔️',
straightArrow: '→',
curvedArrow: '↷',
doubleArrow: '⇄',
squadCombat: '⚔️',
assaultDirection: '⚡',
sector: '◠',
lune: '◑',
freehandLine: '✏️',
freehandPolygon: '🖍️',
curve: '〰️'
}
return icons[type] || '📍'
}
onMounted(() => {
initViewer()
})
onUnmounted(() => {
if (viewer.value) {
viewer.value.destroy()
}
})
</script>
<style scoped>
#cesiumContainer {
width: 100%;
height: 100vh;
position: relative;
}
.plot-toolbar {
position: absolute;
top: 10px;
left: 10px;
background: rgba(0, 20, 40, 0.95);
border: 1px solid #1a5fb4;
border-radius: 8px;
padding: 15px;
color: white;
z-index: 1000;
min-width: 280px;
max-height: 85vh;
overflow-y: auto;
box-shadow: 0 4px 12px rgba(0, 0, 0, 0.3);
}
.toolbar-header {
text-align: center;
font-size: 18px;
font-weight: bold;
color: #78aeff;
margin-bottom: 15px;
padding-bottom: 10px;
border-bottom: 1px solid #2d7ac0;
}
.tool-group {
margin-bottom: 15px;
padding: 12px;
background: rgba(30, 60, 90, 0.5);
border-radius: 6px;
border: 1px solid rgba(45, 122, 192, 0.3);
}
.tool-group h4 {
margin: 0 0 10px 0;
font-size: 14px;
color: #a0c8ff;
font-weight: bold;
}
.plot-toolbar button {
display: flex;
align-items: center;
width: 100%;
margin: 6px 0;
padding: 8px 12px;
background: linear-gradient(to bottom, rgba(45, 122, 192, 0.8), rgba(26, 95, 180, 0.8));
border: 1px solid #2d7ac0;
color: white;
border-radius: 4px;
cursor: pointer;
font-size: 13px;
transition: all 0.2s;
}
.plot-toolbar button:hover {
background: linear-gradient(to bottom, rgba(58, 139, 208, 0.9), rgba(45, 122, 192, 0.9));
transform: translateY(-1px);
}
.plot-toolbar button .icon {
margin-right: 8px;
font-size: 14px;
}
.plot-list {
margin-top: 15px;
padding-top: 15px;
border-top: 1px solid rgba(45, 122, 192, 0.3);
}
.plot-list h4 {
margin: 0 0 10px 0;
color: #78aeff;
font-size: 14px;
}
.list-item {
display: flex;
align-items: center;
justify-content: space-between;
padding: 8px;
margin: 4px 0;
background: rgba(40, 70, 100, 0.3);
border-radius: 4px;
border: 1px solid transparent;
cursor: pointer;
transition: all 0.2s;
}
.list-item:hover {
background: rgba(58, 139, 208, 0.2);
border-color: #3a8bd0;
}
.list-item.selected {
background: rgba(255, 102, 0, 0.2);
border-color: #ff6600;
}
.plot-type {
font-size: 16px;
margin-right: 8px;
}
.plot-name {
flex: 1;
font-size: 13px;
overflow: hidden;
text-overflow: ellipsis;
white-space: nowrap;
}
.plot-actions {
display: flex;
gap: 4px;
}
.plot-actions button {
padding: 2px 6px;
font-size: 12px;
background: rgba(255, 255, 255, 0.1);
border: 1px solid rgba(255, 255, 255, 0.2);
border-radius: 3px;
cursor: pointer;
}
.plot-actions button:hover {
background: rgba(255, 255, 255, 0.2);
}
/* 滚动条样式 */
.plot-toolbar::-webkit-scrollbar {
width: 8px;
}
.plot-toolbar::-webkit-scrollbar-track {
background: rgba(0, 20, 40, 0.5);
border-radius: 4px;
}
.plot-toolbar::-webkit-scrollbar-thumb {
background: #2d7ac0;
border-radius: 4px;
}
.plot-toolbar::-webkit-scrollbar-thumb:hover {
background: #3a8bd0;
}
</style>