1、前言
Qt中绘制曲线的方法
在Qt中绘制曲线可以通过多种方式实现,以下是几种常见的方法:
使用QPainter绘制贝塞尔曲线
通过QPainter的drawPath方法结合QPainterPath可以绘制贝塞尔曲线。需要创建QPainterPath对象,然后使用cubicTo或quadTo方法添加曲线段。
cpp
QPainterPath path;
path.moveTo(startPoint);
path.cubicTo(controlPoint1, controlPoint2, endPoint);
painter.drawPath(path);
使用QCustomPlot库
QCustomPlot是一个专门用于绘图的Qt第三方库,支持多种曲线类型。需要先下载并包含该库,然后创建QCPGraph对象来绘制曲线。
cpp
QCustomPlot *customPlot = new QCustomPlot(this);
customPlot->addGraph();
customPlot->graph(0)->setData(xData, yData);
customPlot->replot();
使用QSplineSeries(Qt Charts模块)
Qt Charts模块提供了QSplineSeries类,可以方便地绘制平滑曲线。需要在项目文件中添加QT += charts,并包含相关头文件。
cpp
QSplineSeries *series = new QSplineSeries();
series->append(points);
QChart *chart = new QChart();
chart->addSeries(series);
QChartView *chartView = new QChartView(chart);
使用OpenGL绘制曲线
对于高性能绘图需求,可以使用QOpenGLWidget和OpenGL着色器来绘制曲线。需要继承QOpenGLWidget并重写相关方法。
cpp
void MyGLWidget::paintGL() {
glBegin(GL_LINE_STRIP);
for (const QPointF &point : points) {
glVertex2f(point.x(), point.y());
}
glEnd();
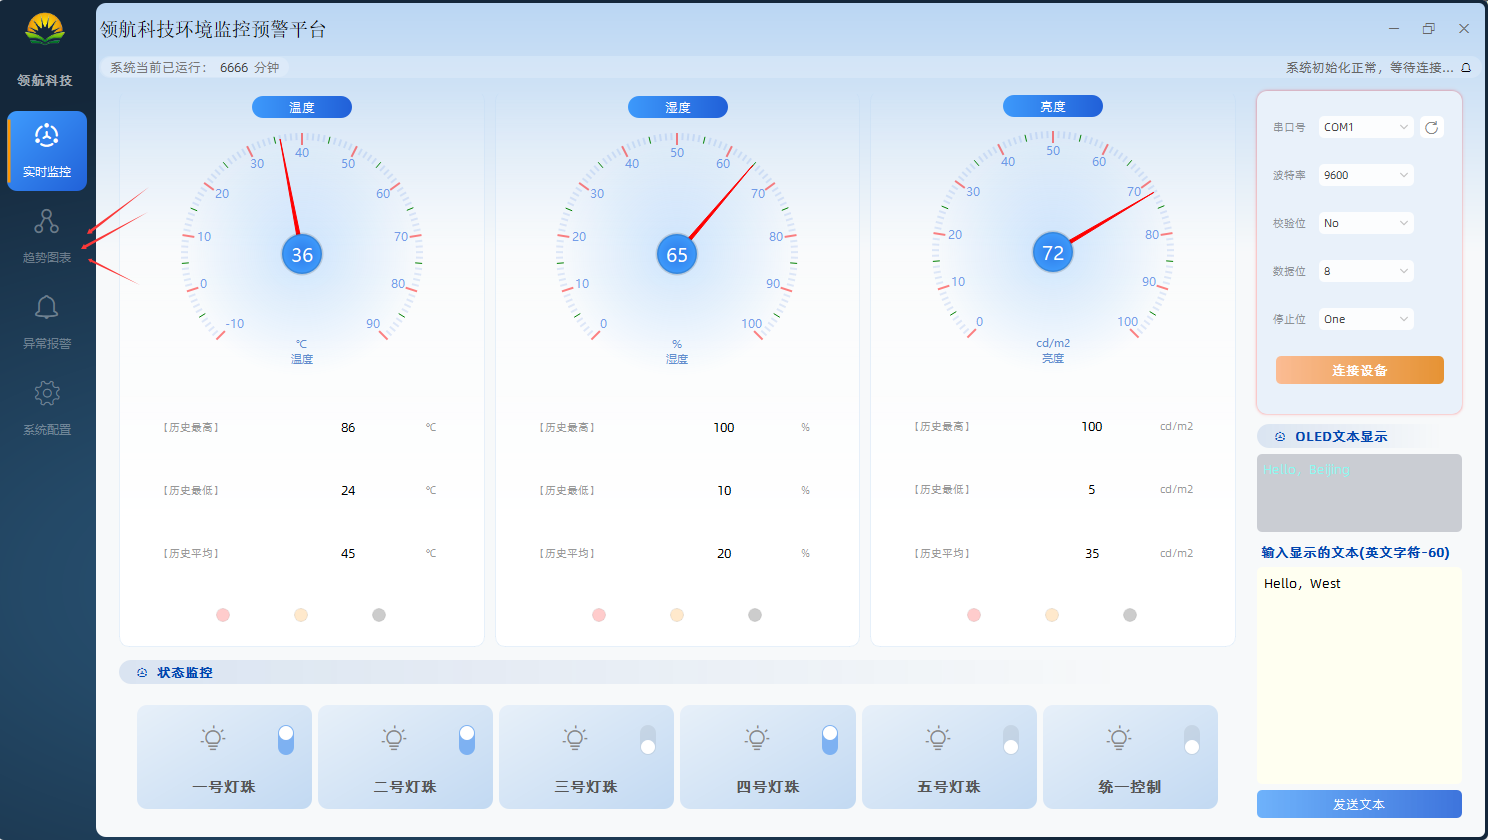
}2、我来干
1、修改代码
QSplineSeries 是 Qt Charts 模块中的一个类,用于绘制平滑的样条曲线(Spline)。它继承自 QLineSeries,通过插值算法将数据点连接为平滑曲线,适用于需要展示连续趋势的场景(如股票走势、传感器数据等)。
cpp
#include <QtCharts/QChartView>
#include <QtCharts/QSplineSeries>

int main(int argc, char *argv[]) {
    QApplication app(argc, argv);

    QSplineSeries *series = new QSplineSeries();
    series->append(0, 6);
    series->append(2, 4);
    series->append(3, 8);
    series->append(7, 4);

    QChart *chart = new QChart();
    chart->addSeries(series);
    chart->setTitle("Spline Chart");
    chart->createDefaultAxes();

    QChartView view(chart);
    view.resize(800, 600);
    view.show();

    return app.exec();
}

QChartView 是 Qt Charts 模块中的一个组件,用于显示图表(QChart)。它继承自 QGraphicsView,提供了一种简单的方式来嵌入和交互式展示数据可视化图表,如折线图、柱状图、饼图等。
cpp
#include <QtCharts>
int main(int argc, char *argv[]) {
QApplication app(argc, argv);
QLineSeries *series = new QLineSeries();
series->append(0, 6);
series->append(1, 3);
series->append(2, 7);
QChart *chart = new QChart();
chart->addSeries(series);
chart->createDefaultAxes();
QChartView *chartView = new QChartView(chart);
chartView->setRenderHint(QPainter::Antialiasing);
QMainWindow window;
window.setCentralWidget(chartView);
window.resize(400, 300);
window.show();
return app.exec();
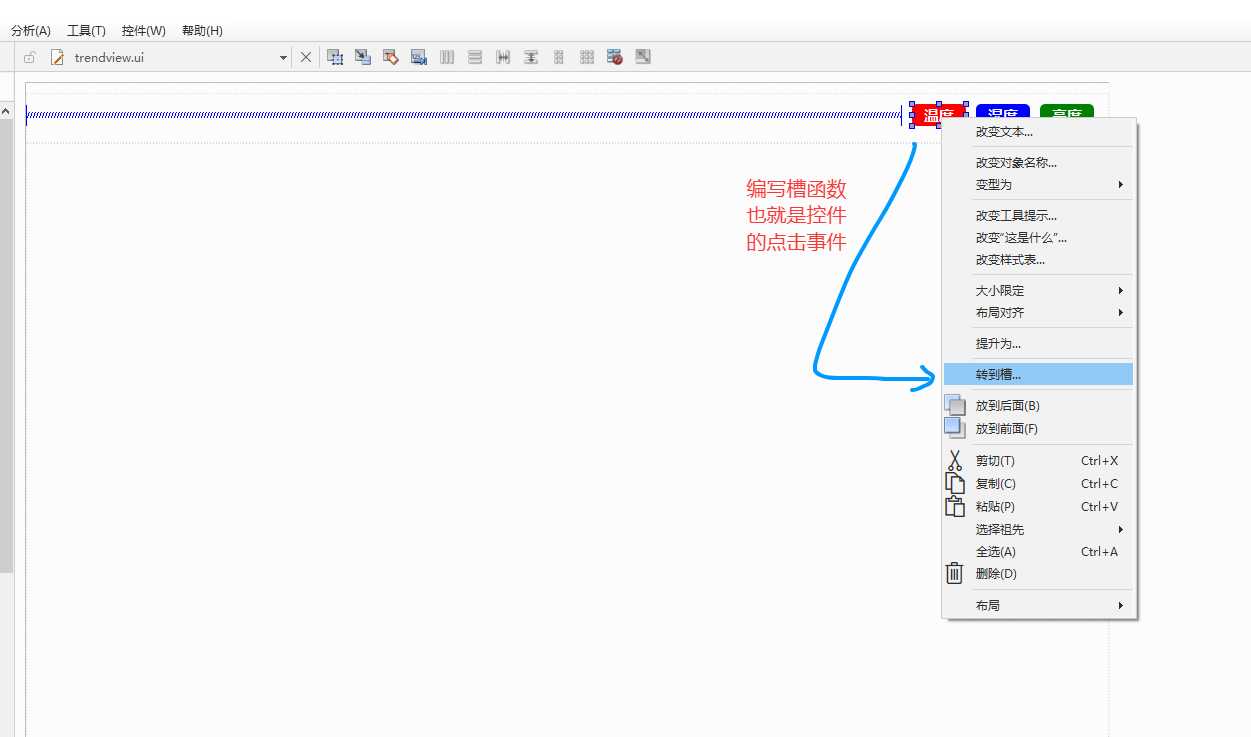
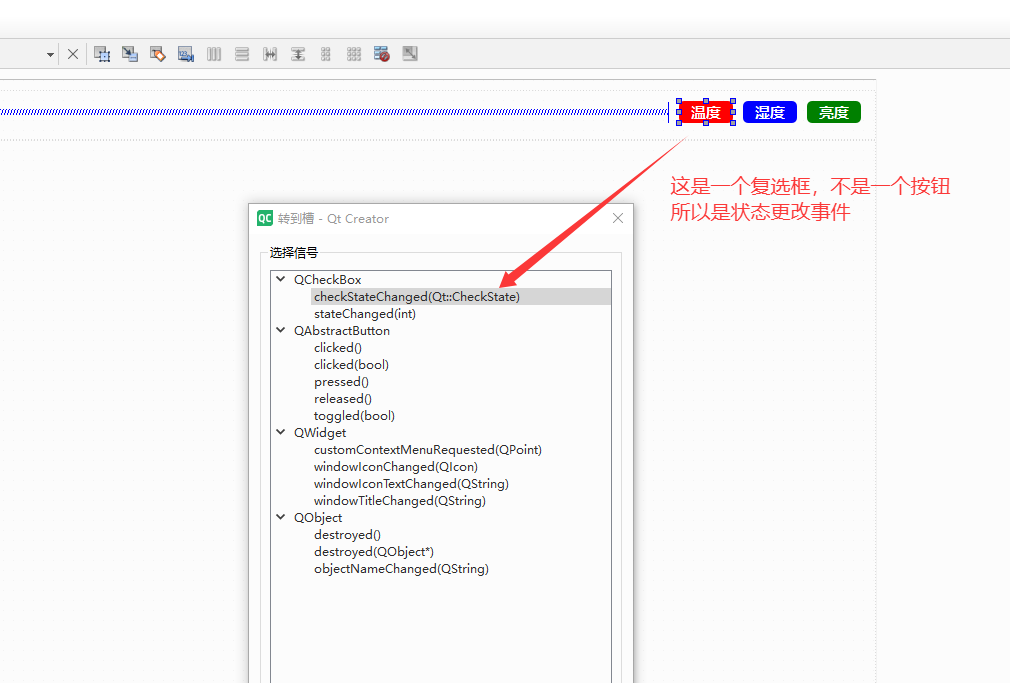
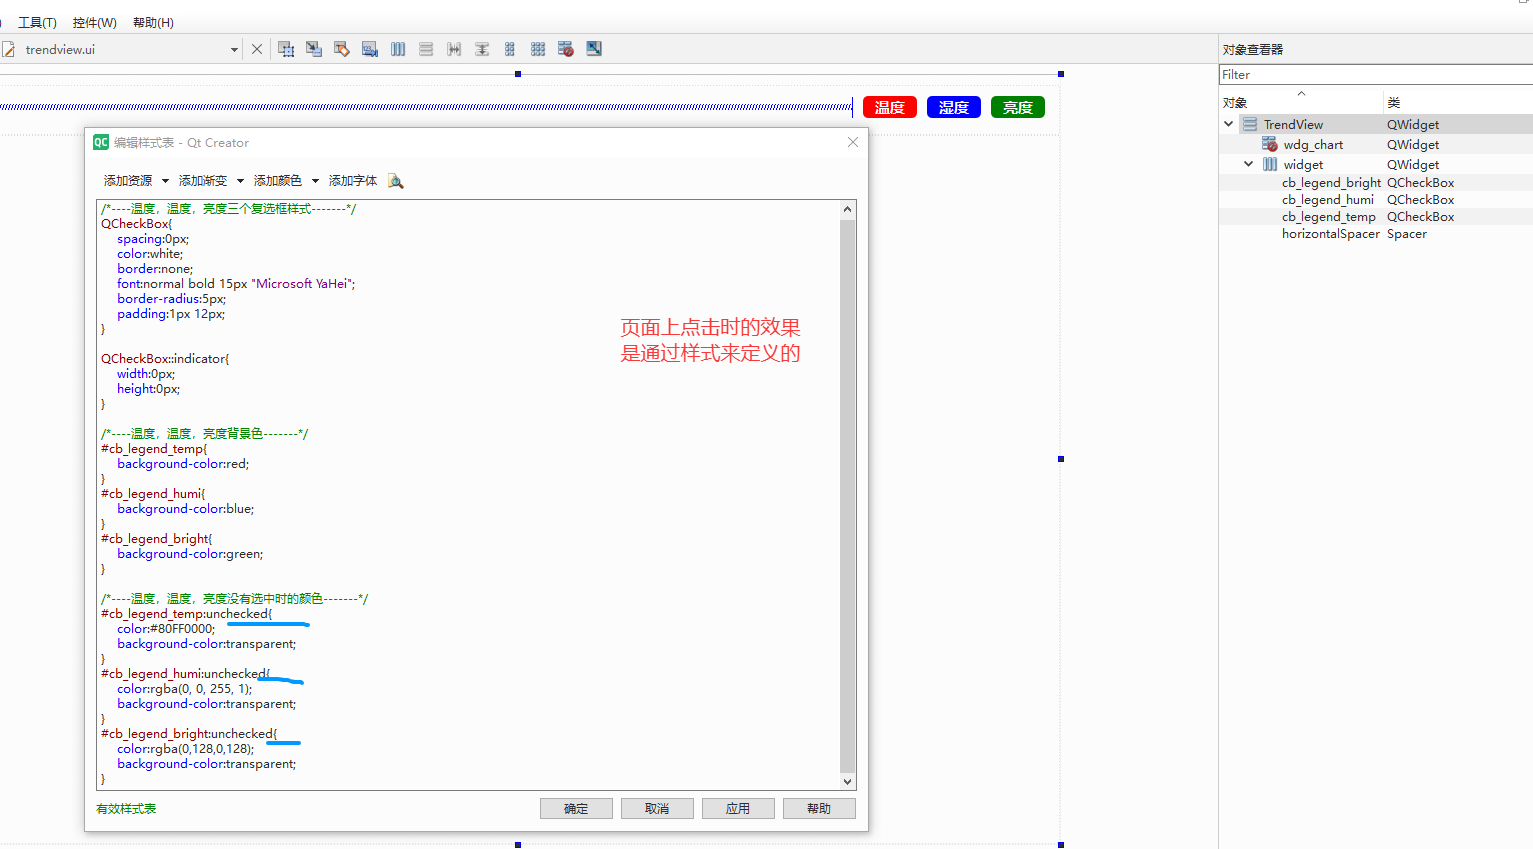
}2、点击事件
完整代码
cpp
#include "trendview.h"
#include "ui_trendview.h"
#include <QGridLayout>
#include <QtCharts/QChart>
#include <QtGlobal> // qrand() 必备
TrendView::TrendView(QWidget *parent)
: QWidget(parent)
, ui(new Ui::TrendView)
{
ui->setupUi(this);
//拆线图的初始化
// x轴(时间轴方式)
axisX = new QDateTimeAxis(); // x轴显示标题
axisX->setGridLineVisible(false); // 隐藏背景网格X轴框线
axisX->setFormat("HH:mm:ss"); // x轴格式
axisX->setLabelsAngle(0); // x轴显示的文字倾斜角度
axisX->setTickCount(20); // X轴上点的个数
axisX->setRange(curDateTime.addSecs(-20), curDateTime); // 范围
axisX->setLabelsColor(QColor(70,70,70,90)); //设置x轴的标签颜色,就是显示的文字颜色
axisX->setLinePen(QPen(Qt::lightGray, 1.6, Qt::SolidLine)); //设置X轴线的类型及颜色
axisX->setLabelsFont(QFont("YaHei",9));
// y轴
axisY = new QValueAxis();
axisY->setRange(-20, 110); // 范围
axisY->setTickCount(14); // y轴上点的个数
axisY->setGridLineVisible(true); // 不隐藏背景网格Y轴框线
axisY->setLabelsColor(QColor(70,70,70,90));//显示的文字颜色
axisY->setLineVisible(false);
axisY->setGridLinePen(QPen(QColor(0,0,0,40), 0.6, Qt::DashLine));
axisY->setLabelsFont(QFont("YaHei",9));//刻度标签的字体
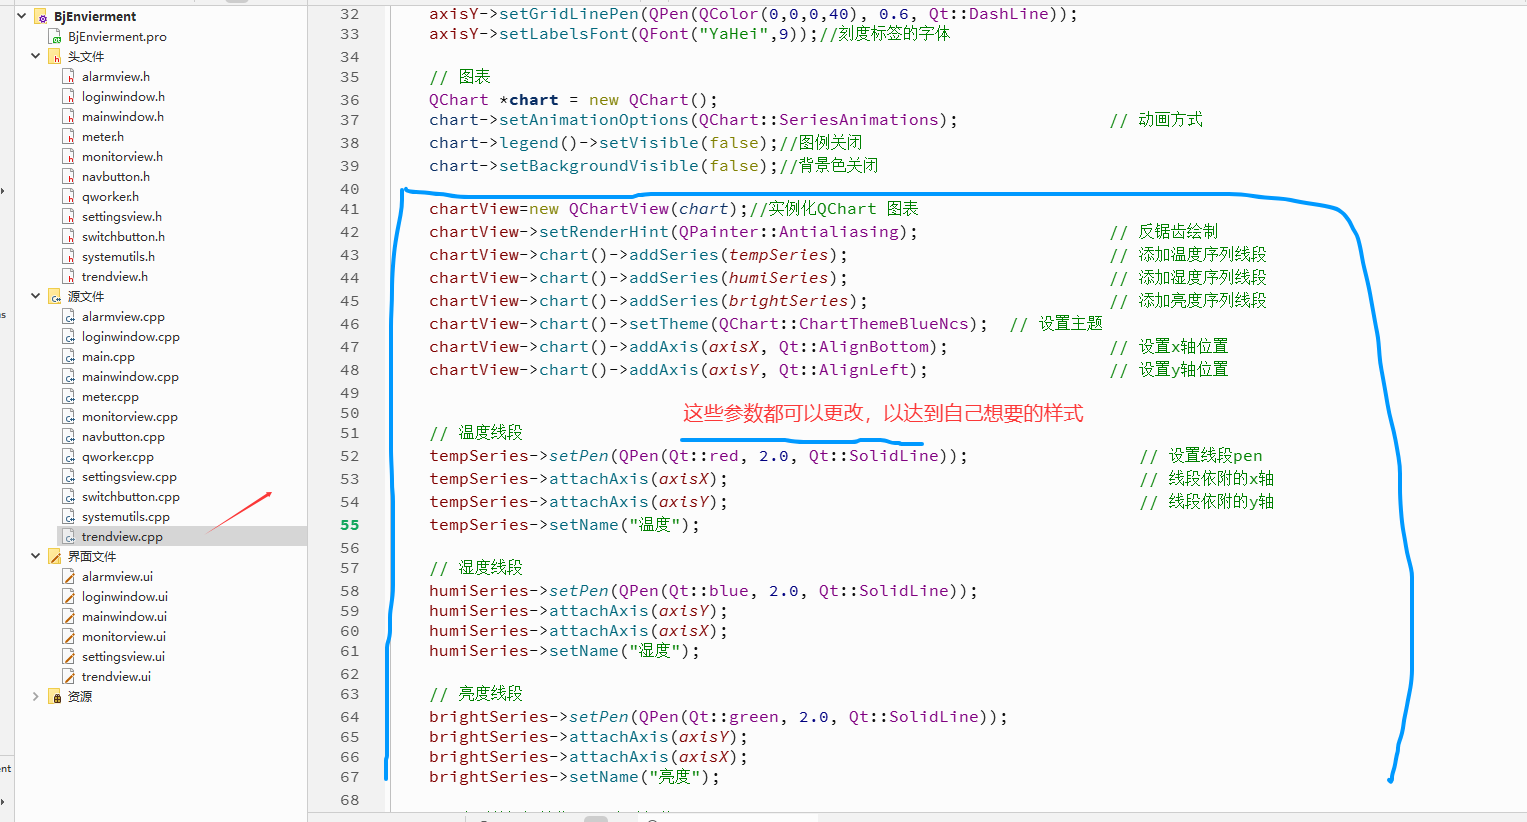
// 图表
QChart *chart = new QChart();
chart->setAnimationOptions(QChart::SeriesAnimations); // 动画方式
chart->legend()->setVisible(false);//图例关闭
chart->setBackgroundVisible(false);//背景色关闭
chartView=new QChartView(chart);//实例化QChart 图表
chartView->setRenderHint(QPainter::Antialiasing); // 反锯齿绘制
chartView->chart()->addSeries(tempSeries); // 添加温度序列线段
chartView->chart()->addSeries(humiSeries); // 添加湿度序列线段
chartView->chart()->addSeries(brightSeries); // 添加亮度序列线段
chartView->chart()->setTheme(QChart::ChartThemeBlueNcs); // 设置主题
chartView->chart()->addAxis(axisX, Qt::AlignBottom); // 设置x轴位置
chartView->chart()->addAxis(axisY, Qt::AlignLeft); // 设置y轴位置
// 温度线段
tempSeries->setPen(QPen(Qt::red, 2.0, Qt::SolidLine)); // 设置线段pen
tempSeries->attachAxis(axisX); // 线段依附的x轴
tempSeries->attachAxis(axisY); // 线段依附的y轴
tempSeries->setName("温度");
// 湿度线段
humiSeries->setPen(QPen(Qt::blue, 2.0, Qt::SolidLine));
humiSeries->attachAxis(axisY);
humiSeries->attachAxis(axisX);
humiSeries->setName("湿度");
// 亮度线段
brightSeries->setPen(QPen(Qt::green, 2.0, Qt::SolidLine));
brightSeries->attachAxis(axisY);
brightSeries->attachAxis(axisX);
brightSeries->setName("亮度");
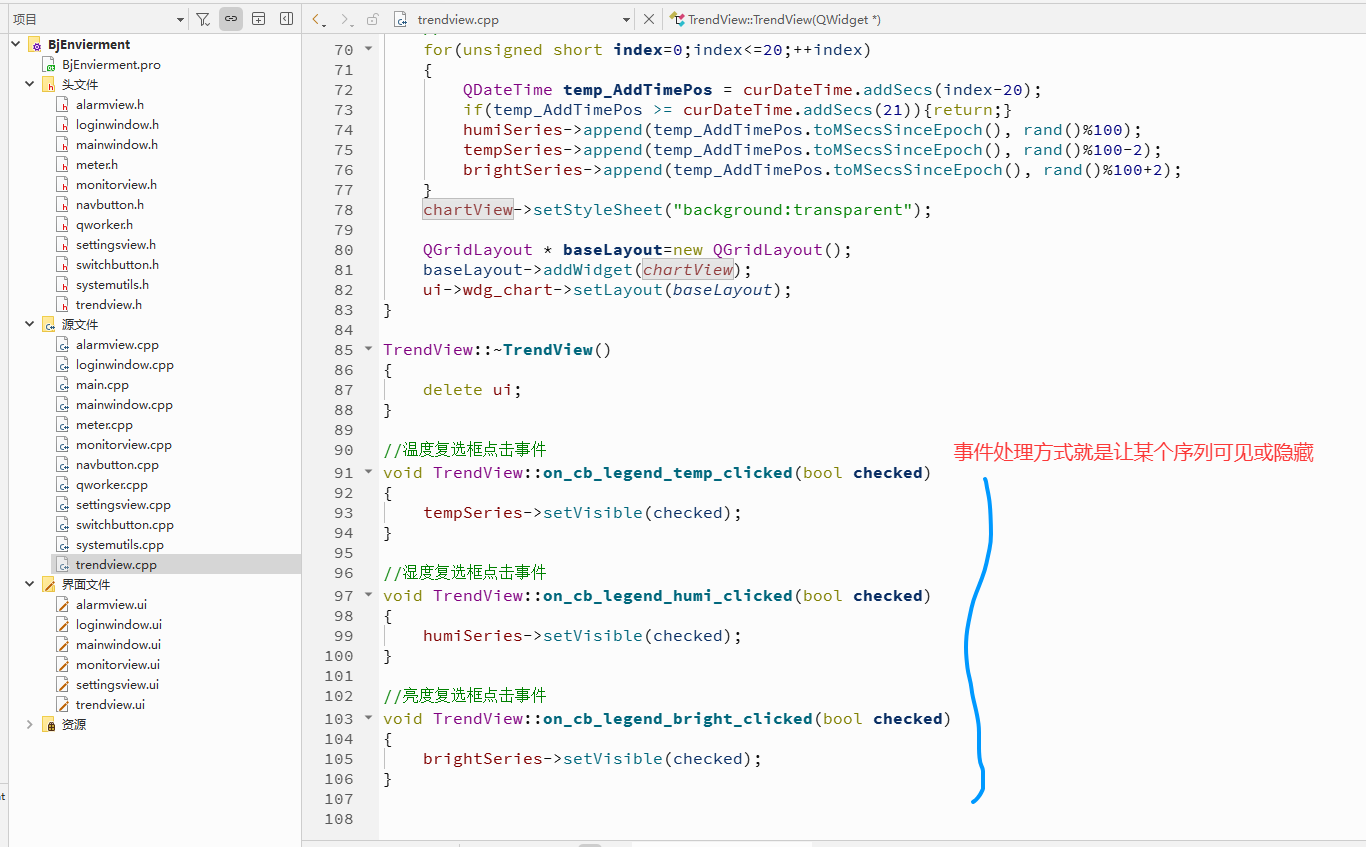
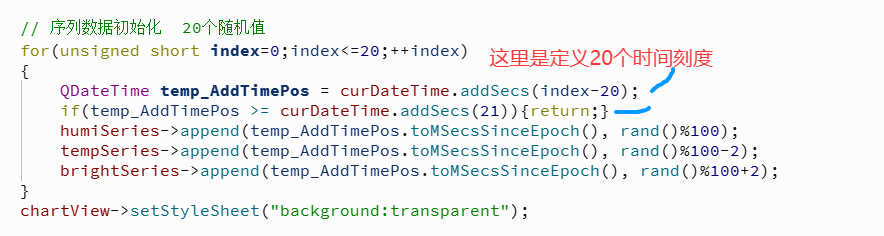
// 序列数据初始化 20个随机值
for(unsigned short index=0;index<=20;++index)
{
QDateTime temp_AddTimePos = curDateTime.addSecs(index-20);
if(temp_AddTimePos >= curDateTime.addSecs(21)){return;}
humiSeries->append(temp_AddTimePos.toMSecsSinceEpoch(), rand()%100);
tempSeries->append(temp_AddTimePos.toMSecsSinceEpoch(), rand()%100-2);
brightSeries->append(temp_AddTimePos.toMSecsSinceEpoch(), rand()%100+2);
}
chartView->setStyleSheet("background:transparent");
QGridLayout * baseLayout=new QGridLayout();
baseLayout->addWidget(chartView);
ui->wdg_chart->setLayout(baseLayout);
}
TrendView::~TrendView()
{
delete ui;
}
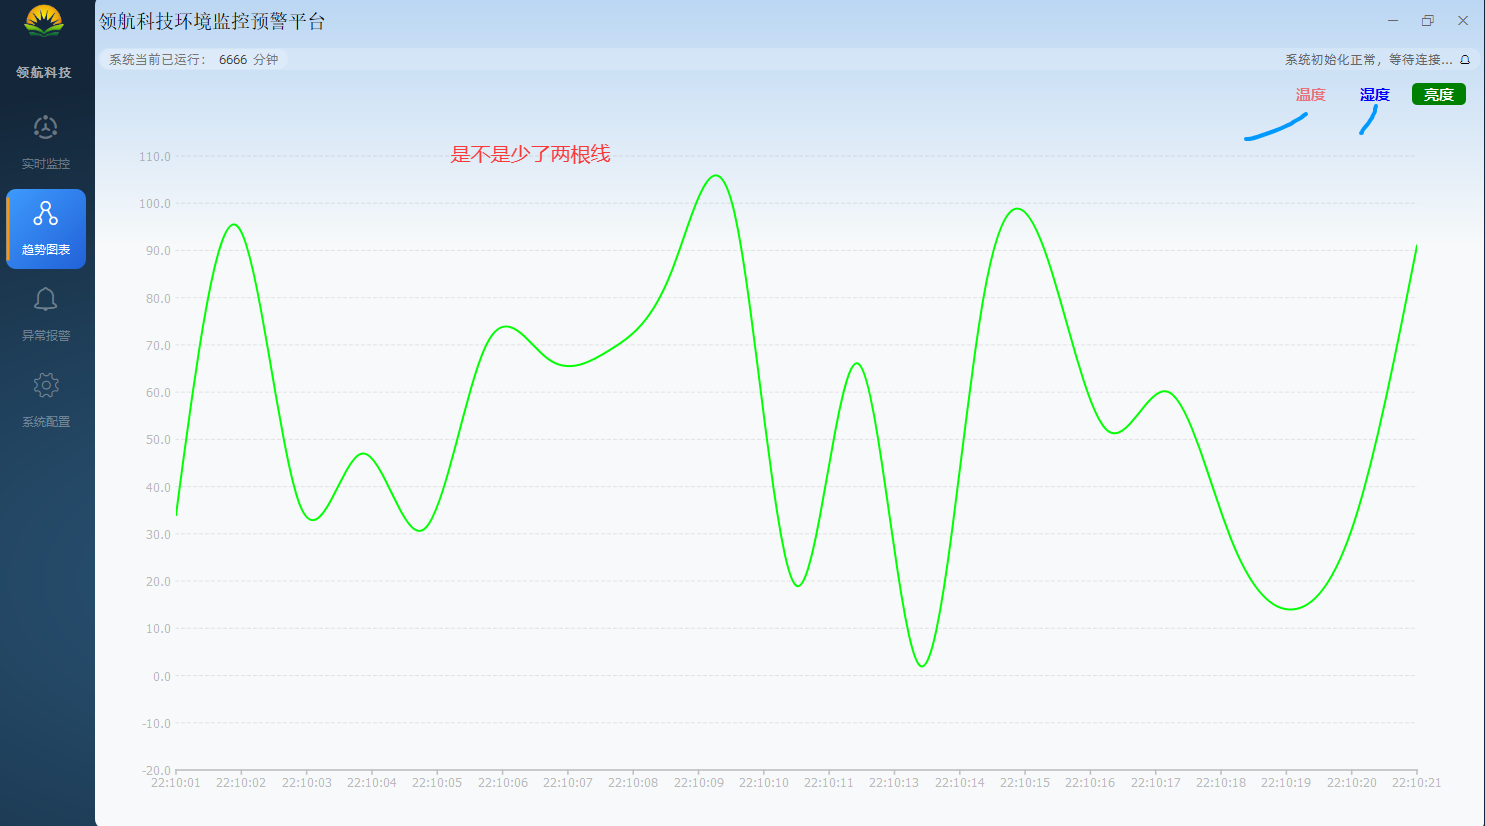
//温度复选框点击事件
void TrendView::on_cb_legend_temp_clicked(bool checked)
{
tempSeries->setVisible(checked);
}
//湿度复选框点击事件
void TrendView::on_cb_legend_humi_clicked(bool checked)
{
humiSeries->setVisible(checked);
}
//亮度复选框点击事件
void TrendView::on_cb_legend_bright_clicked(bool checked)
{
brightSeries->setVisible(checked);
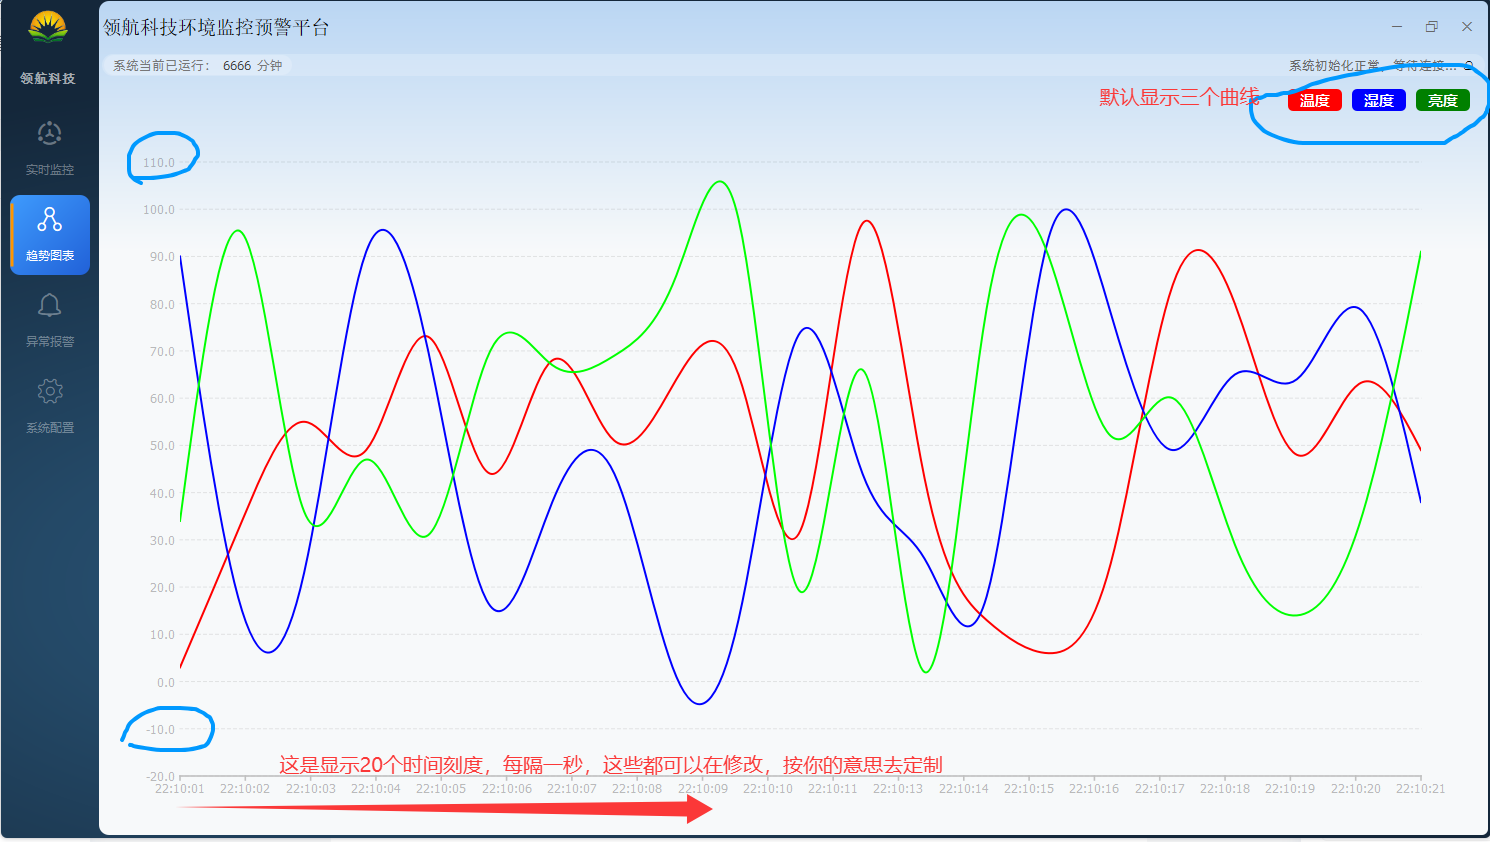
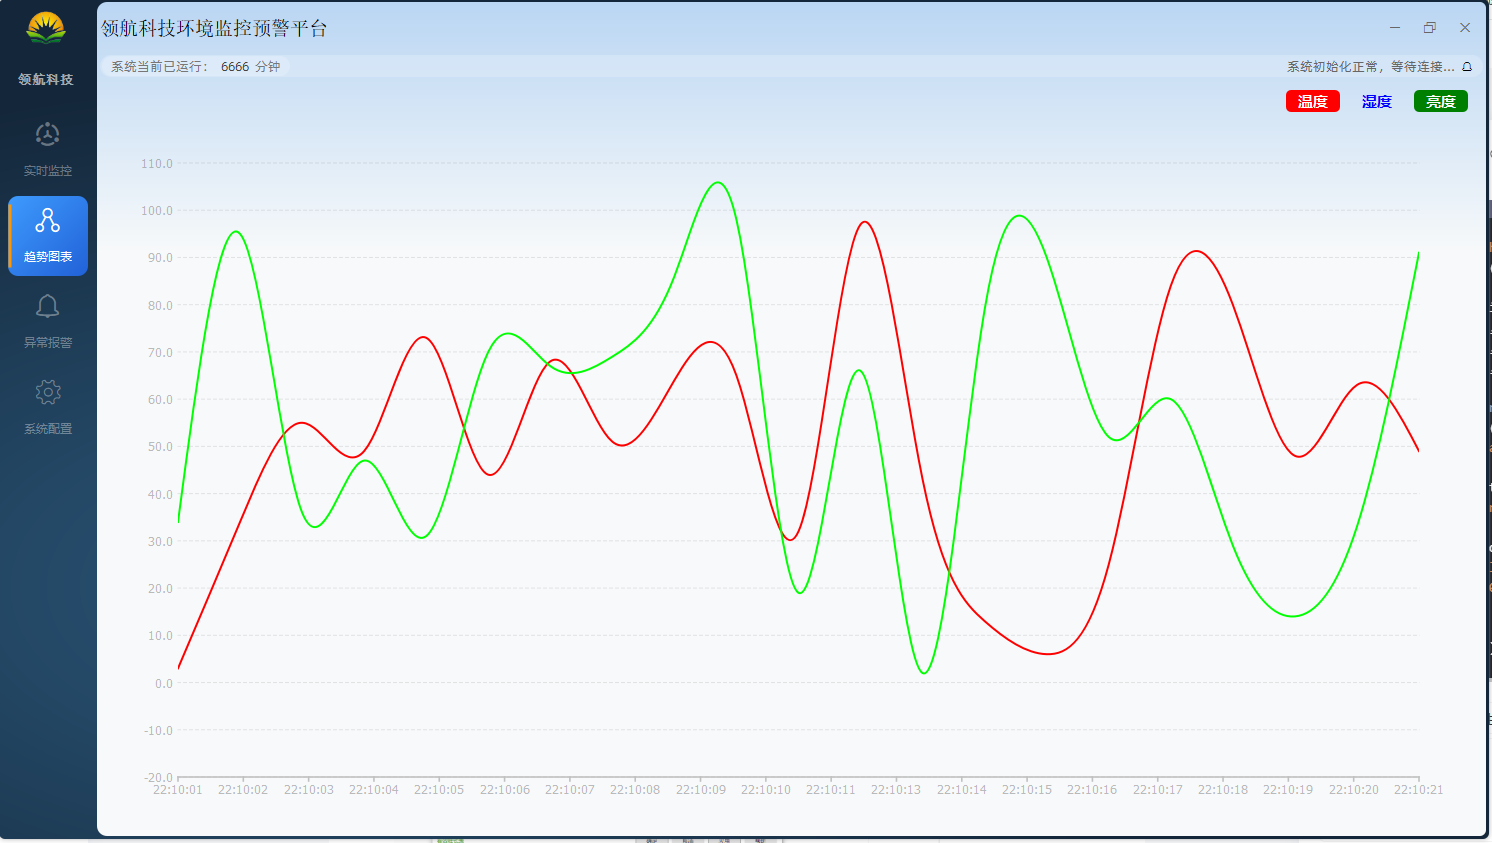
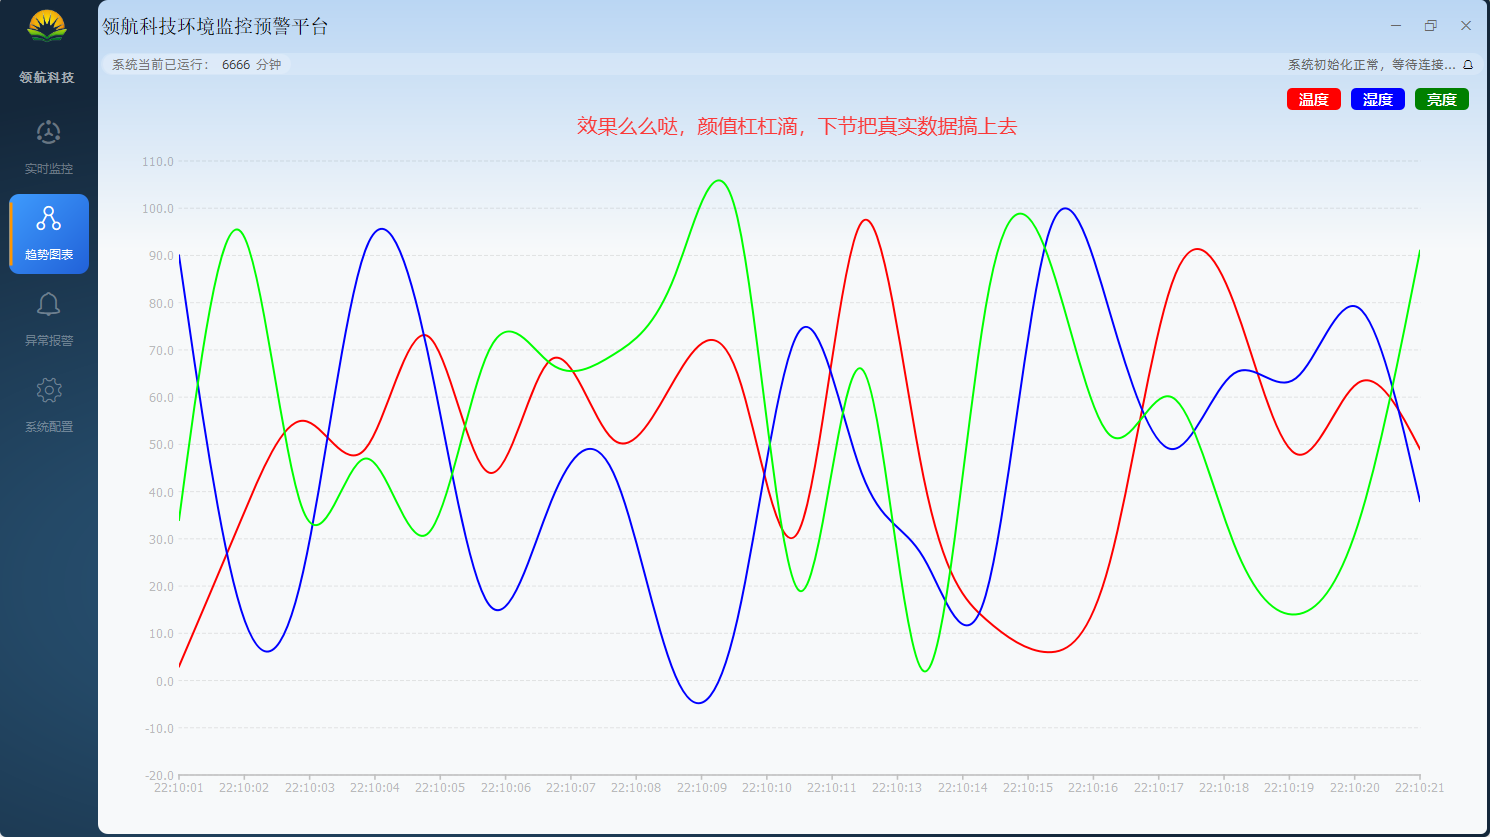
}3、运行测试
4、小结
QPainter 是 Qt 中最基础的绘图工具,可以通过 QPainterPath 绘制平滑曲线。
原创不易,打字不易,截图不易,撸码不易,整理不易,走过路过,不要错过,欢迎点赞,收藏,转载,复制,抄袭,留言,灌水,请动动你的金手指,祝您早日实现财务自由。