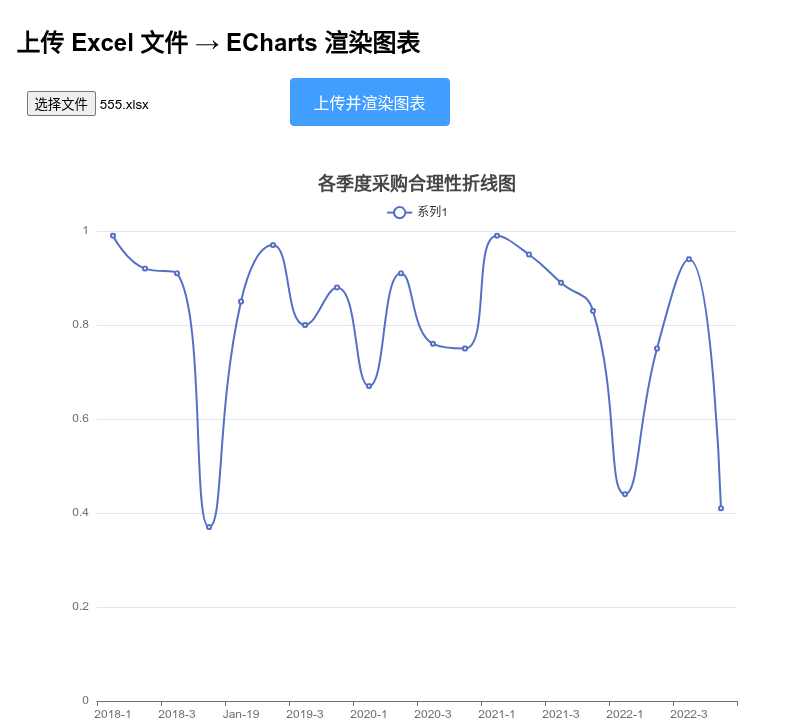
以下是完整的 Flask + Vue 3 前端模板 方案,实现 上传 Excel 文件 (不再用链接),后端解析 chart1.xml,返回结构化数据,前端用 ECharts 渲染图表。
项目结构
project/
├── app.py
├── templates/
│   └── index.html
1. 后端:app.py
python
import xml.etree.ElementTree as ET
import io
from zipfile import ZipFile, BadZipFile
from flask import Flask, render_template, request, jsonify
from flask_cors import CORS  # 可选,如果有跨域需求

app = Flask(__name__)
CORS(app)  # 允许跨域(同域其实不需要,但留着保险)

def parse_chart_from_bytes(file_data):
    res = {}
    result = {}
    try:
        archive = ZipFile(io.BytesIO(file_data))
        chart_data = archive.read('xl/charts/chart1.xml')

        res['code'] = 200
        res['msg'] = "获取图表信息成功"

        tree = ET.parse(io.BytesIO(chart_data))
        root = tree.getroot()

        ns = {
            'c': 'http://schemas.openxmlformats.org/drawingml/2006/chart',
            'a': 'http://schemas.openxmlformats.org/drawingml/2006/main'
        }

        # 图表类型
        type_mapping = [
            ('pieChart', '饼图', 'pie'),
            ('lineChart', '折线图', 'line'),
            ('barChart', '柱形图', 'bar'),
            ('areaChart', '面积图', 'line'),
            ('scatterChart', '散点图', 'scatter'),
            ('radarChart', '雷达图', 'radar'),
        ]
        chart_type_cn = '其它'
        echarts_type = 'line'
        is_area = False
        for tag, cn, en in type_mapping:
            if root.find(f'.//c:{tag}', ns) is not None:
                chart_type_cn = cn
                echarts_type = en
                if cn == '面积图':
                    is_area = True
                break

        result['chart_type_cn'] = chart_type_cn
        result['echarts_type'] = echarts_type
        result['is_area'] = is_area

        # 标题
        title_text = ""
        title_elem = root.find('.//c:title/c:tx/c:rich', ns)
        if title_elem is not None:
            for t in title_elem.iterfind('.//a:t', ns):
                if t.text:
                    title_text += t.text
        result['title'] = title_text.strip() or "无标题"

        # 系列数据
        series_list = []
        ser_elements = root.findall('.//c:ser', ns)

        for idx, ser in enumerate(ser_elements):
            # 系列名称
            name_elem = ser.find('c:tx/c:v', ns)
            name = name_elem.text if name_elem is not None else f"系列{idx + 1}"

            # 类别(X轴)
            cat_vs = ser.findall('c:cat//c:pt/c:v', ns)
            categories = [v.text for v in cat_vs if v.text is not None]

            # 数值(Y轴)
            val_vs = ser.findall('c:val//c:pt/c:v', ns)
            values = []
            for v in val_vs:
                if v.text:
                    try:
                        values.append(float(v.text))
                    except ValueError:
                        values.append(v.text)

            series_list.append({
                "name": name,
                "categories": categories,
                "data": values
            })

        # 共享类别轴(如果每个系列都没有独立类别)
        if series_list and all(len(s['categories']) == 0 for s in series_list):
            shared_vs = root.findall('.//c:cat//c:pt/c:v', ns)
            shared_cat = [v.text for v in shared_vs if v.text is not None]
            if shared_cat:
                for s in series_list:
                    s['categories'] = shared_cat

        # 饼图特殊处理
        if chart_type_cn == "饼图" and series_list:
            for s in series_list:
                pie_data = []
                cats = s['categories'] or [f"项{i+1}" for i in range(len(s['data']))]
                for i, val in enumerate(s['data']):
                    name = cats[i] if i < len(cats) else f"项{i+1}"
                    value = val if isinstance(val, (int, float)) else 0
                    pie_data.append({"name": name, "value": value})
                s['data'] = pie_data

        # 最终类别轴(非饼图)
        if chart_type_cn != "饼图" and series_list and series_list[0]['categories']:
            result['categories'] = series_list[0]['categories']
        else:
            result['categories'] = []

        # 系列(只保留 name 和 data)
        result['series'] = [{"name": s["name"], "data": s["data"]} for s in series_list]

        res['data'] = result

    except BadZipFile:
        res['code'] = 404
        res['msg'] = "无效的Excel文件"
    except KeyError:
        res['code'] = 404
        res['msg'] = "未找到图表信息(无chart1.xml)"
    except Exception as e:
        res['code'] = 500
        res['msg'] = f"解析失败: {str(e)}"

    return res


@app.route('/')
def index():
    return render_template('index.html')


@app.route('/api/upload_chart', methods=['POST'])
def upload_chart():
    if 'file' not in request.files:
        return jsonify({"code": 400, "msg": "没有上传文件"})

    file = request.files['file']
    if file.filename == '' or not file.filename.lower().endswith('.xlsx'):
        return jsonify({"code": 400, "msg": "请上传 .xlsx 文件"})

    file_data = file.read()
    return jsonify(parse_chart_from_bytes(file_data))


if __name__ == '__main__':
    app.run(host='127.0.0.1', port=5000, debug=True)
2. 前端模板:templates/index.html
html
<!DOCTYPE html>
<html lang="zh-CN">
<head>
  <meta charset="UTF-8">
  <title>上传 Excel → ECharts 渲染</title>
  <script src="https://cdn.jsdelivr.net/npm/vue@3.4.21/dist/vue.global.prod.js"></script>
  <script src="https://cdn.jsdelivr.net/npm/echarts@5.5.0/dist/echarts.min.js"></script>
  <style>
    body { font-family: Arial, sans-serif; padding: 20px; background: #f5f5f5; }
    .container { max-width: 800px; margin: auto; background: white; padding: 30px; border-radius: 8px; box-shadow: 0 2px 10px rgba(0,0,0,0.1); }
    input[type="file"] { padding: 10px; margin-bottom: 15px; }
    button { padding: 12px 24px; font-size: 16px; background: #409eff; color: white; border: none; border-radius: 4px; cursor: pointer; }
    button:hover { background: #66b1ff; }
    button:disabled { background: #a0cfff; cursor: not-allowed; }
    #chart { width: 100%; height: 600px; margin-top: 30px; }
    .msg { margin: 15px 0; font-weight: bold; color: #e6a23c; }
  </style>
</head>
<body>
<div id="app" class="container">
  <h2>上传 Excel 文件 → ECharts 渲染图表</h2>
  <input type="file" accept=".xlsx" @change="onFileChange" />
  <button @click="uploadAndRender" :disabled="!selectedFile">上传并渲染图表</button>
  <div class="msg">{{ message }}</div>
  <div ref="chartRef" id="chart"></div>
</div>

<script>
const { createApp, ref, onMounted, nextTick } = Vue;

createApp({
  setup() {
    const selectedFile = ref(null);
    const message = ref('请选择一个包含图表的 .xlsx 文件');
    const chartRef = ref(null);
    let myChart = null;

    onMounted(() => {
      myChart = echarts.init(chartRef.value);
    });

    const onFileChange = (e) => {
      const file = e.target.files[0];
      if (file && file.name.endsWith('.xlsx')) {
        selectedFile.value = file;
        message.value = `已选择文件:${file.name}`;
      } else {
        selectedFile.value = null;
        message.value = '请上传 .xlsx 文件';
      }
    };

    const uploadAndRender = async () => {
      if (!selectedFile.value) return;

      message.value = '正在上传并解析...';

      const formData = new FormData();
      formData.append('file', selectedFile.value);

      try {
        const response = await fetch('/api/upload_chart', {
          method: 'POST',
          body: formData
        });

        const json = await response.json();

        if (json.code !== 200) {
          message.value = `错误:${json.msg}`;
          return;
        }

        const data = json.data;

        const option = {
          title: { text: data.title, left: 'center', textStyle: { fontSize: 18 } },
          tooltip: { trigger: data.echarts_type === 'pie' ? 'item' : 'axis' },
          legend: { data: data.series.map(s => s.name), top: 30 }
        };

        if (data.echarts_type === 'pie') {
          option.series = data.series.map(s => ({
            type: 'pie',
            name: s.name,
            radius: '55%',
            center: ['50%', '60%'],
            data: s.data,
            emphasis: { itemStyle: { shadowBlur: 10, shadowOffsetX: 0, shadowColor: 'rgba(0, 0, 0, 0.5)' } }
          }));
        } else if (data.echarts_type === 'radar') {
          const maxVal = Math.max(...data.series.flatMap(s => s.data.filter(v => typeof v === 'number')), 100);
          option.radar = {
            indicator: data.categories.map(name => ({ name, max: maxVal * 1.2 }))
          };
          option.series = [{
            type: 'radar',
            data: data.series.map(s => ({ name: s.name, value: s.data }))
          }];
        } else {
          option.xAxis = { type: 'category', data: data.categories };
          option.yAxis = { type: 'value' };
          option.series = data.series.map(s => ({
            type: data.echarts_type,
            name: s.name,
            data: s.data,
            areaStyle: data.is_area ? { opacity: 0.3 } : undefined,
            smooth: data.echarts_type === 'line' ? true : false
          }));
        }

        await nextTick();
        myChart.setOption(option, true);
        message.value = `渲染成功!图表类型:${data.chart_type_cn}(${data.series.length} 个系列)`;

      } catch (err) {
        message.value = '上传或解析失败:' + err.message;
        console.error(err);
      }
    };

    return { selectedFile, message, chartRef, onFileChange, uploadAndRender };
  }
}).mount('#app');
</script>
</body>
</html>
使用方式
-
安装依赖:
bashpip install flask flask-cors -
把上面的文件按结构放好。
-
运行:
bashpython app.py -
浏览器打开
http://127.0.0.1:5000 -
选择一个包含图表(chart1)的
.xlsx文件 → 点击"上传并渲染图表"
功能特点
- 支持上传本地 Excel 文件解析(安全,只读内存)。
- 支持单/多系列图表。
- 饼图、折线、柱形、面积、散点、雷达图基本还原。
- 前端美化了些样式和交互。
相关文章
Python 使用 openpyxl 从 URL 读取 Excel 并获取 Sheet 及单元格样式信息
Python 解析 Excel 图表(Chart)信息实战:从 xlsx 中提取标题、字体和数据