可观测性 的重要性。
当你想知道"接口为什么变慢了?"、"哪个数据库查询是性能瓶颈?"时,一个强大的APM(应用性能监控)工具就成了刚需。
使用 Docker 部署 SkyWalking 9.4.0 并成功接入 Spring Boot 应用 的全过程。
我们的目标:SkyWalking 是什么?
简单来说,SkyWalking 就像是你应用的“随身医生”和“GPS导航”。它能帮你:

(1).看清服务链路:一个前端请求过来,经过了哪些后端服务,调用了哪些数据库、Redis、MQ,一目了然,形成一张拓扑图。
(2).定位性能瓶颈:告诉你每个环节花了多长时间,哪个接口慢,哪条SQL查询是罪魁祸首。
(3).监控健康状况:实时查看应用的QPS(每秒请求数)、响应时间、错误率以及JVM的内存、CPU、线程等状态。

我们要部署的SkyWalking主要由三部分构成:
OAP (后端服务):数据处理中心,负责接收、分析和存储监控数据。
UI (Web界面):一个帅气的仪表盘,用来可视化地展示OAP处理后的数据。
Agent (探针):一个无侵入的Java代理,需要“挂载”到我们的Java应用上,负责自动收集数据并发送给OAP。


官网:https://skywalking.apache.org/
GitHub:https://github.com/apache/skywalking
官网文档:https://skywalking.apache.org/docs/main/v9.4.0/readme/
中文文档:https://skyapm.github.io/document-cn-translation-of-skywalking/
教程开始: 安装 Docker 和 Docker Compose
~~~~略过 看我发布的文章 搜索 “安装docker”个人有强迫症,首先创建个目录以及可选环境变量文件:
mkdir -p /soft/SkyWaing/ && cd /soft/SkyWaing/

# 创建 .env 文件
cat > .env << EOF
# Elasticsearch 镜像(可以使用更新的版本)
ELASTICSEARCH_IMAGE=docker.elastic.co/elasticsearch/elasticsearch-oss:7.4.0

# SkyWalking 镜像版本
OAP_IMAGE=ghcr.io/apache/skywalking/oap:latestUI_IMAGE=ghcr.io/apache/skywalking/ui:latest
# 可选:增加 Elasticsearch 内存
ES_JAVA_OPTS=-Xms2g -Xmx4g
# 可选:增加 OAP 内存
OAP_JAVA_OPTS=-Xms4g -Xmx8g
EOF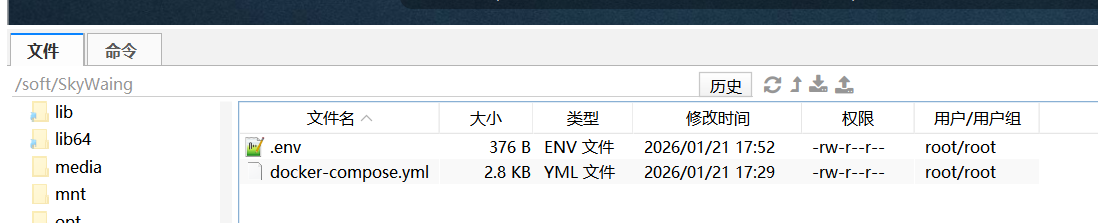
下载 docker-compose.yml 文件
- 你可以从 SkyWalking 的 GitHub 仓库中获取最新的 docker-compose.yml 文件。
https://github.com/apache/skywalking/blob/master/docker/docker-compose.yml编写 docker-compose.yml 文件(此处是原始的yml 进行了注释)
# Licensed to the Apache Software Foundation (ASF) under one
# or more contributor license agreements.  See the NOTICE file
# distributed with this work for additional information
# regarding copyright ownership.  The ASF licenses this file
# to you under the Apache License, Version 2.0 (the
# "License"); you may not use this file except in compliance
# with the License.  You may obtain a copy of the License at
#
#     http://www.apache.org/licenses/LICENSE-2.0
#
# Unless required by applicable law or agreed to in writing, software
# distributed under the License is distributed on an "AS IS" BASIS,
# WITHOUT WARRANTIES OR CONDITIONS OF ANY KIND, either express or implied.
# See the License for the specific language governing permissions and
# limitations under the License.

version: '3.8'

services:
  # Elasticsearch 服务 - 提供 SkyWalking 数据存储(可选存储方案)
  elasticsearch:
    # profiles 标签定义服务分组,可以通过 --profile 参数选择性启动
    profiles:
      - "elasticsearch"  # 当指定 --profile elasticsearch 时启动此服务
    # 使用 Elasticsearch 开源版本镜像,支持环境变量覆盖
    image: ${ELASTICSEARCH_IMAGE:-docker.elastic.co/elasticsearch/elasticsearch-oss:7.4.2}
    container_name: elasticsearch  # 容器名称
    ports:
      - "9200:9200"  # 暴露 HTTP API 端口
    networks:
      - demo  # 加入 demo 网络
    # 健康检查配置,确保服务完全启动后才依赖其他服务
    healthcheck:
      test: [ "CMD-SHELL", "curl --silent --fail localhost:9200/_cluster/health || exit 1" ]
      interval: 30s  # 检查间隔
      timeout: 10s   # 超时时间
      retries: 3     # 重试次数
      start_period: 10s  # 容器启动后等待时间
    environment:
      - discovery.type=single-node  # 单节点模式,简化配置
      - bootstrap.memory_lock=true  # 锁定内存,防止内存交换影响性能
      - "ES_JAVA_OPTS=-Xms512m -Xmx512m"  # JVM 堆内存设置(最小512M,最大512M)
    ulimits:
      memlock:
        soft: -1  # 软限制:无限制
        hard: -1  # 硬限制:无限制

  # BanyanDB 服务 - SkyWalking 原生数据库(可选存储方案)
  banyandb:
    profiles:
      - "banyandb"  # 当指定 --profile banyandb 时启动此服务
    # BanyanDB 是 SkyWalking 自研的时序数据库,专为 APM 数据优化
    image: ${BANYANDB_IMAGE:-ghcr.io/apache/skywalking-banyandb:a091ac0c3efa7305288ae9fb8853bffb2186583a}
    container_name: banyandb  # 容器名称
    networks:
      - demo  # 加入 demo 网络
    expose:
      - 17912  # 内部暴露 gRPC 端口(仅容器间访问)
    ports:
      - 17913:17913  # 映射 HTTP 端口到主机
    command: standalone --stream-root-path /tmp/stream-data --measure-root-path /tmp/measure-data
    healthcheck:
      test: [ "CMD", "sh", "-c", "nc -nz 127.0.0.1 17912" ]  # 检查端口是否可连接
      interval: 5s    # 检查间隔较短,等待启动
      timeout: 60s    # 超时时间较长
      retries: 120    # 重试次数较多

  # OAP 服务基础配置(抽象配置,不直接启动)
  oap-base: &oap-base
    profiles: [ "none" ]  # 不直接启动,作为模板
    image: ${OAP_IMAGE:-ghcr.io/apache/skywalking/oap:latest}  # OAP 后端服务
    ports:
      - "11800:11800"  # gRPC 端口,用于接收 agent 数据
      - "12800:12800"  # HTTP 端口,用于 REST API 查询
    networks:
      - demo  # 加入 demo 网络
    healthcheck:
      test: [ "CMD-SHELL", "curl http://localhost:12800/internal/l7check" ]  # 内部健康检查
      interval: 30s
      timeout: 10s
      retries: 3
      start_period: 10s
    environment: &oap-env  # 定义环境变量锚点,便于复用
      SW_HEALTH_CHECKER: default  # 健康检查器
      SW_TELEMETRY: prometheus    # 遥测数据使用 Prometheus 格式
      JAVA_OPTS: "-Xms2048m -Xmx2048m"  # JVM 堆内存设置(2GB)

  # OAP 服务 - Elasticsearch 存储版本
  oap-es:
    <<: *oap-base  # 继承 oap-base 的所有配置
    profiles:
      - "elasticsearch"  # 属于 elasticsearch 配置文件组
    container_name: oap  # 容器名称
    depends_on:
      elasticsearch:
        condition: service_healthy  # 等待 elasticsearch 健康后才启动
    environment:
      <<: *oap-env  # 继承基础环境变量
      SW_STORAGE: elasticsearch  # 存储类型:Elasticsearch
      SW_STORAGE_ES_CLUSTER_NODES: elasticsearch:9200  # ES 连接地址

  # OAP 服务 - BanyanDB 存储版本
  oap-bdb:
    <<: *oap-base  # 继承 oap-base 的所有配置
    profiles:
      - "banyandb"  # 属于 banyandb 配置文件组
    container_name: oap  # 容器名称
    depends_on:
      banyandb:
        condition: service_healthy  # 等待 banyandb 健康后才启动
    environment:
      <<: *oap-env  # 继承基础环境变量
      SW_STORAGE: banyandb  # 存储类型:BanyanDB
      SW_STORAGE_BANYANDB_TARGETS: banyandb:17912  # BanyanDB gRPC 连接地址

  # SkyWalking UI 服务 - 可视化界面
  ui:
    image: ${UI_IMAGE:-ghcr.io/apache/skywalking/ui:latest}
    container_name: ui  # 容器名称
    ports:
      - "8080:8080"  # Web 界面访问端口
    networks:
      - demo  # 加入 demo 网络
    environment:
      SW_OAP_ADDRESS: http://oap:12800  # 连接 OAP 服务的地址
      SW_ZIPKIN_ADDRESS: http://oap:9412  # Zipkin 格式数据接收地址

# 网络配置
networks:
  demo:  # 创建名为 demo 的桥接网络,所有服务在同一网络内可相互访问
修改后:使用 Elasticsearch 7.4.0 (8.x以后增加了安全认证机制,需要改动)
version: '3.8'

services:
  # Elasticsearch 服务 - SkyWalking 数据存储
  elasticsearch:
    image: ${ELASTICSEARCH_IMAGE:-docker.elastic.co/elasticsearch/elasticsearch-oss:7.4.0}
    container_name: elasticsearch
    ports:
      - "9200:9200"  # HTTP API 端口
    networks:
      - sky
    healthcheck:
      test: [ "CMD-SHELL", "curl --silent --fail localhost:9200/_cluster/health || exit 1" ]
      interval: 30s
      timeout: 10s
      retries: 3
      start_period: 10s
    environment:
      - discovery.type=single-node  # 单节点模式
      - bootstrap.memory_lock=true  # 锁定内存
      - "ES_JAVA_OPTS=-Xms2m -Xmx4m"  # JVM 内存设置
      # 新增配置:允许跨域访问,便于 elasticsearch-head 等工具连接
      - http.cors.enabled=true
      - http.cors.allow-origin=*
      - http.cors.allow-headers=X-Requested-With,Content-Type,Content-Length,Authorization
    ulimits:
      memlock:
        soft: -1
        hard: -1
    volumes:
      - es-data:/usr/share/elasticsearch/data  # 持久化数据卷

  # SkyWalking OAP 服务(使用 Elasticsearch 存储)
  oap:
    image: ${OAP_IMAGE:-ghcr.io/apache/skywalking/oap:latest}
    container_name: oap
    ports:
      - "11800:11800"  # gRPC 端口,接收 agent 数据
      - "12800:12800"  # HTTP 端口,REST API
    networks:
      - sky
    depends_on:
      elasticsearch:
        condition: service_healthy  # 等待 Elasticsearch 健康后再启动
    healthcheck:
      test: [ "CMD-SHELL", "curl http://localhost:12800/internal/l7check" ]
      interval: 30s
      timeout: 10s
      retries: 3
      start_period: 10s
    environment:
      SW_HEALTH_CHECKER: default
      SW_TELEMETRY: prometheus
      JAVA_OPTS: "-Xms4096m -Xmx4096m"
      # Elasticsearch 存储配置
      SW_STORAGE: elasticsearch
      SW_STORAGE_ES_CLUSTER_NODES: elasticsearch:9200
      # 可选:索引前缀,避免与其他应用冲突
      # SW_STORAGE_ES_INDEX_PREFIX: skywalking
      # 可选:批量处理设置
      # SW_STORAGE_ES_BULK_ACTIONS: 1000
      # SW_STORAGE_ES_BULK_SIZE: 10
      # SW_STORAGE_ES_FLUSH_INTERVAL: 10

  # SkyWalking UI 服务
  ui:
    image: ${UI_IMAGE:-ghcr.io/apache/skywalking/ui:latest}
    container_name: ui
    ports:
      - "8080:8080"  # Web 界面
    networks:
      - sky
    depends_on:
      - oap  # 依赖 OAP 服务
    environment:
      SW_OAP_ADDRESS: http://oap:12800
      SW_ZIPKIN_ADDRESS: http://oap:9412

  # Elasticsearch-head 管理界面(可选,用于查看 ES 数据)
  elasticsearch-head:
    image: mobz/elasticsearch-head:5
    container_name: elasticsearch-head
    ports:
      - "9101:9101"  # 管理界面端口
    networks:
      - sky
    depends_on:
      - elasticsearch
    restart: unless-stopped

# 卷定义
volumes:
  es-data:  # Elasticsearch 数据持久化

# 网络定义
networks:
  sky:
    driver: bridge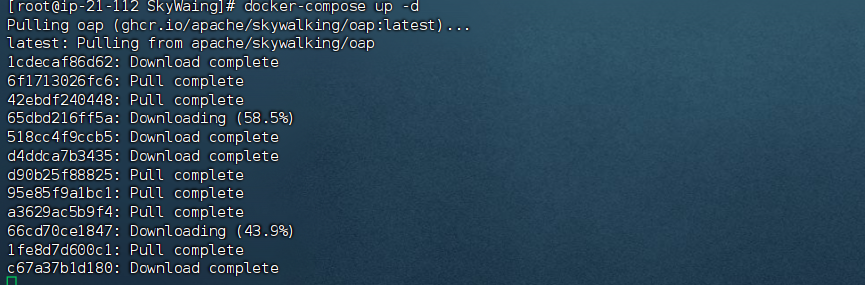
启动 SkyWalking 服务
在包含 docker-compose.yml 文件的目录中运行以下命令来启动所有服务:
# 启动前检查端口:
ss -tuln | grep -E ':9101 |:8080 |:12800 |:9412 |:9200 |:11800 '

# 方式1:启动 Elasticsearch + OAP-ES + UI(全套)
docker-compose up -d

# 方式2:仅启动 Elasticsearch 存储方案
docker-compose --profile elasticsearch up -d

# 方式3:仅启动 BanyanDB 存储方案
docker-compose --profile banyandb up -d

# 方式4:启动 BanyanDB 存储方案 + UI
docker-compose --profile banyandb --profile ui up -d解释:
OAP (Observability Analysis Platform) - 数据分析平台,处理遥测数据
UI - 可视化界面,展示监控数据
Elasticsearch/BanyanDB - 数据存储层,二选一即可
存储方案选择:
Elasticsearch:成熟稳定,功能丰富
BanyanDB:SkyWalking 原生数据库,性能优化
Elasticsearch-head 管理界面 Elasticsearch工具验证部署
日志检查:
docker-compose logs -f

打开浏览器,访问 http://localhost:8080,你应该能看到 SkyWalking UI 的登录界面,
默认用户名和密码都是 admin。
访问 http://localhost:12800/graph 来确认 OAP 服务器正在运行(返回 JSON 数据)。
停止服务
如果需要停止这些容器,可以使用以下命令:
docker-compose down如果遇到问题,检查配置:
# 1. 检查 Elasticsearch 是否正常
curl http://localhost:9200

# 2. 检查 OAP 是否正常
curl http://localhost:12800/internal/l7check

# 3. 检查索引创建情况
curl http://localhost:9200/_cat/indices?v

# 4. 重启服务
docker-compose restart oap

# 5. 清理并重新启动(会删除数据)
docker-compose down -v
docker-compose up -d