一、下载兴趣基因的mRNA文件
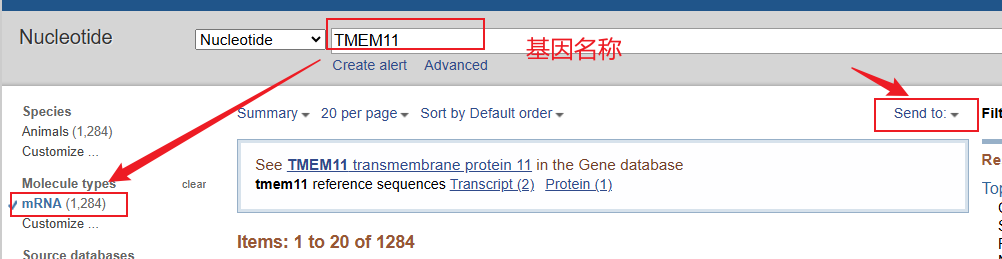
NCBI下载基因mRNA序列
二、分析
RNAlocater
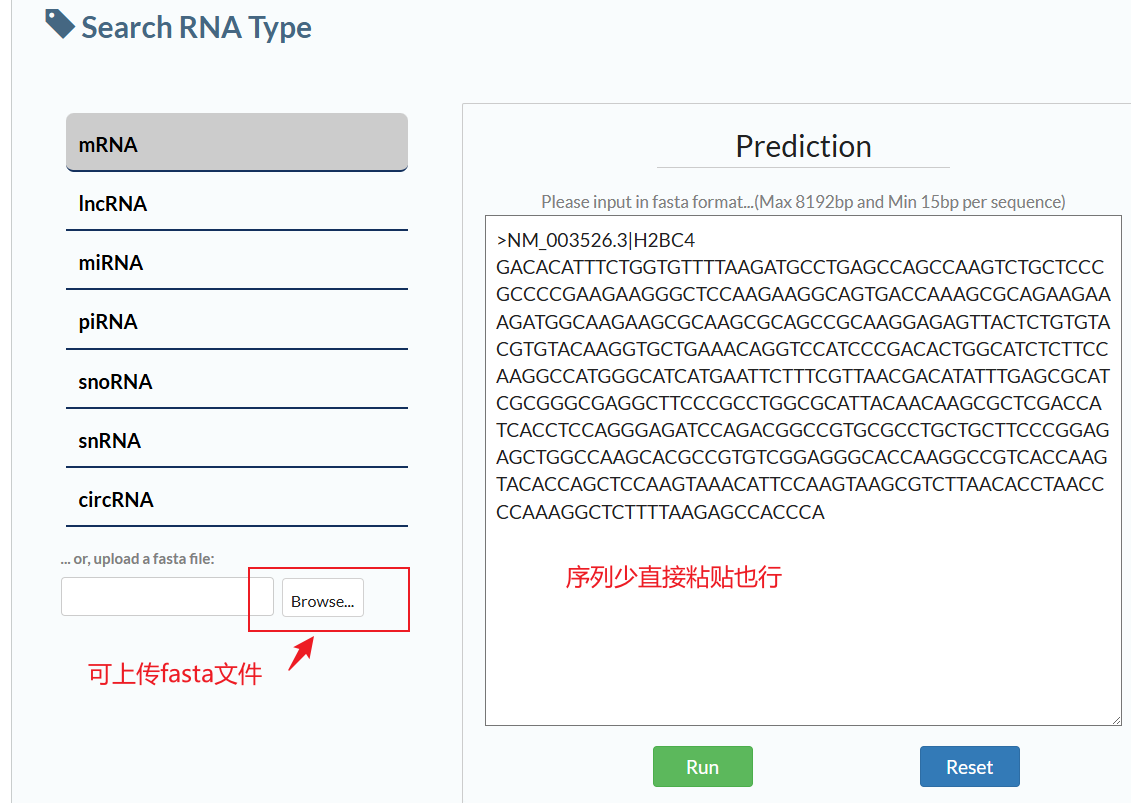
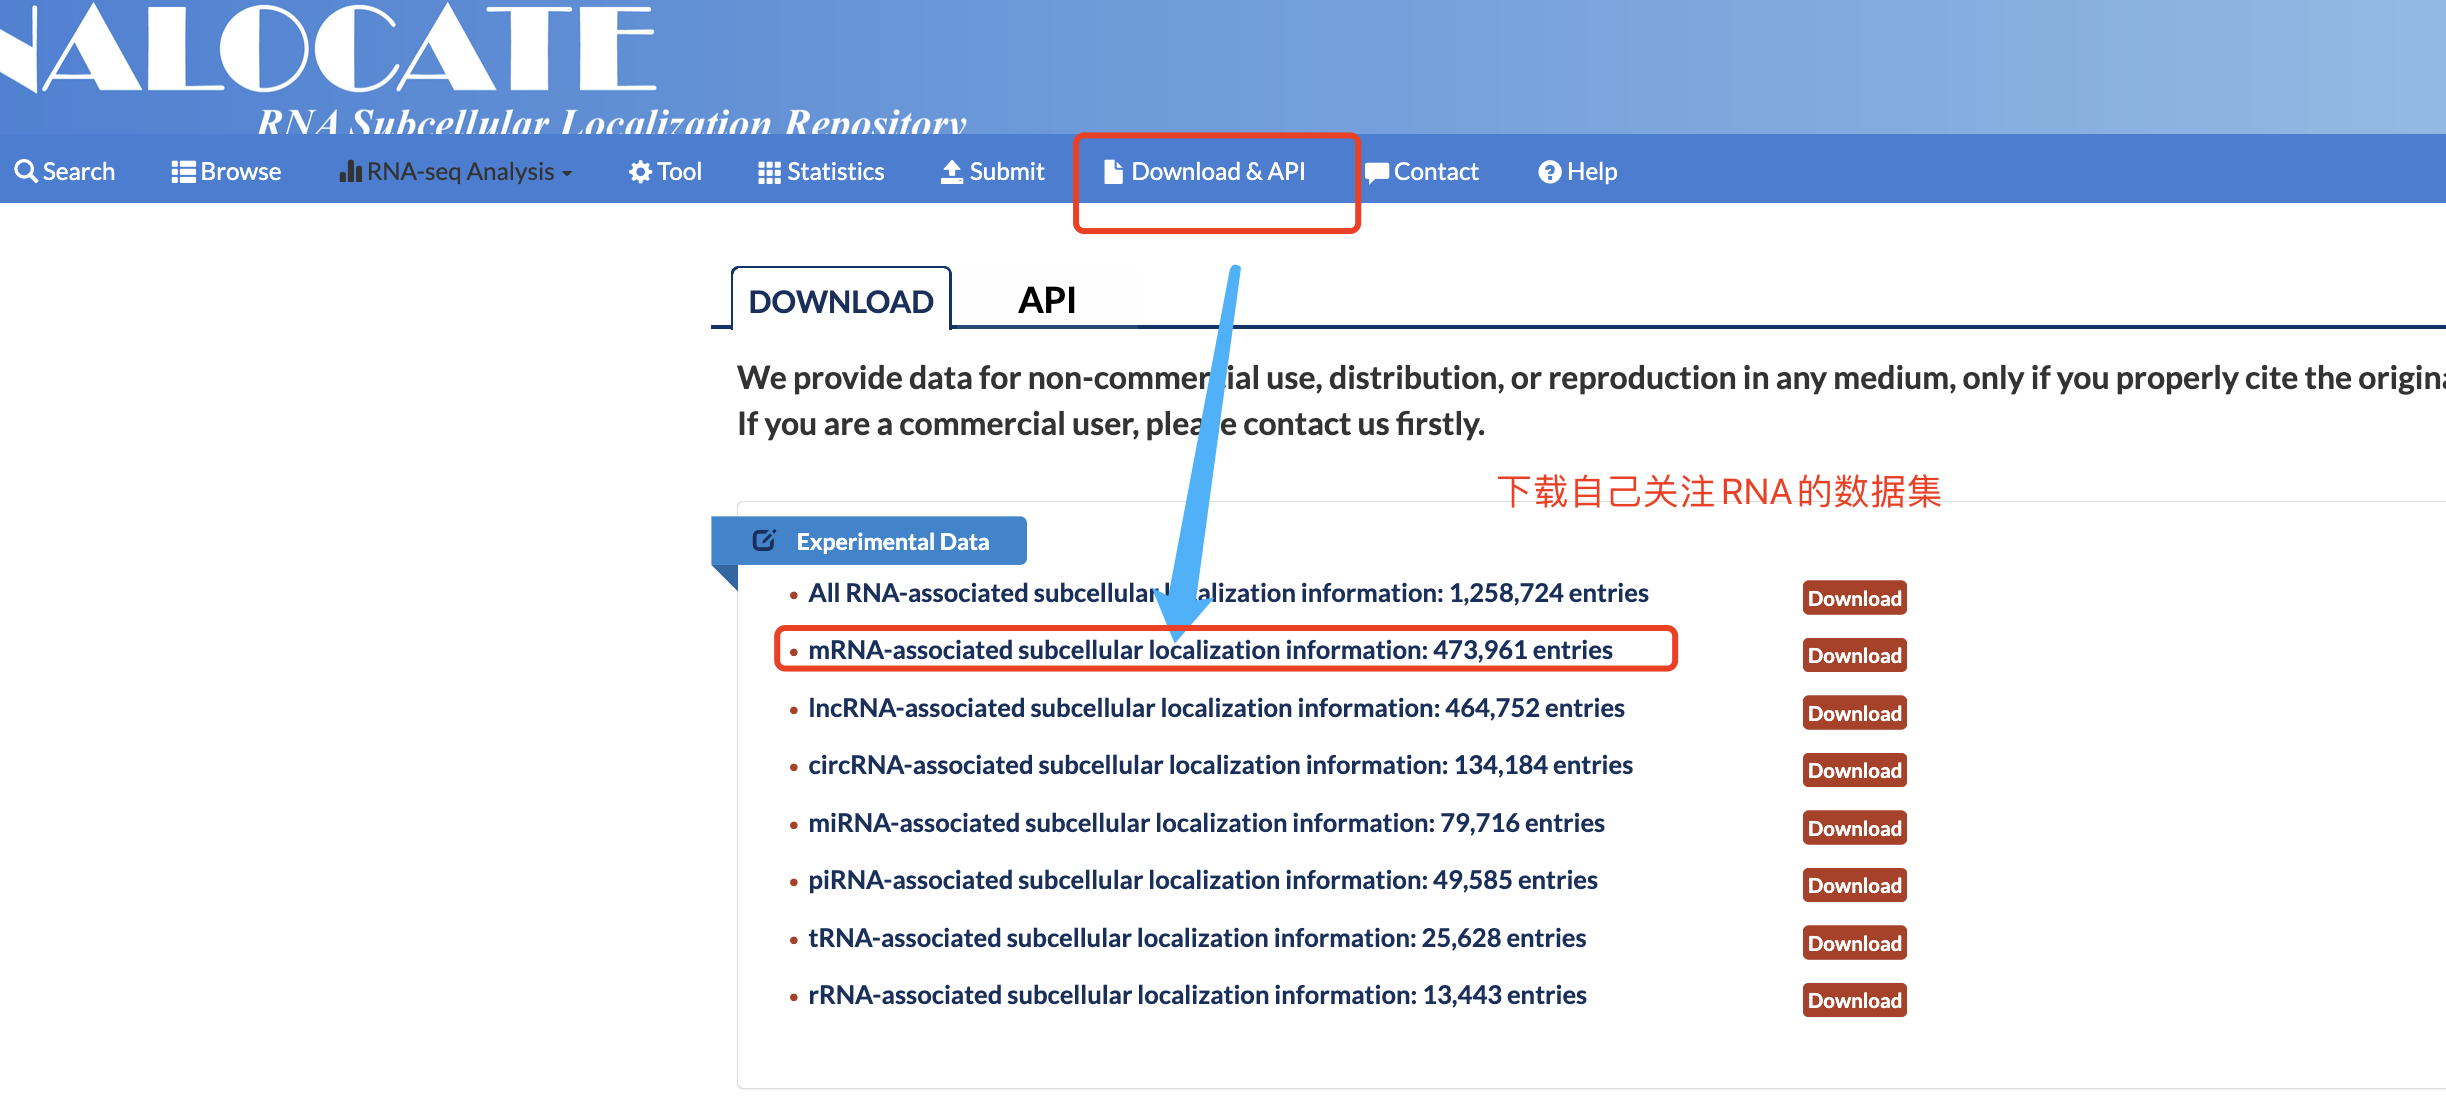
第二种方式获取预测结果
由于使用上述方式预测,提示fasta文件太大,无法预测,因此,更换另一种方式,比如我们的需要分析的基因为TMEM11
直接从这里下载自己所需的RNA的数据库,下载之后需要可以通过搜索获取自己所需要的信息
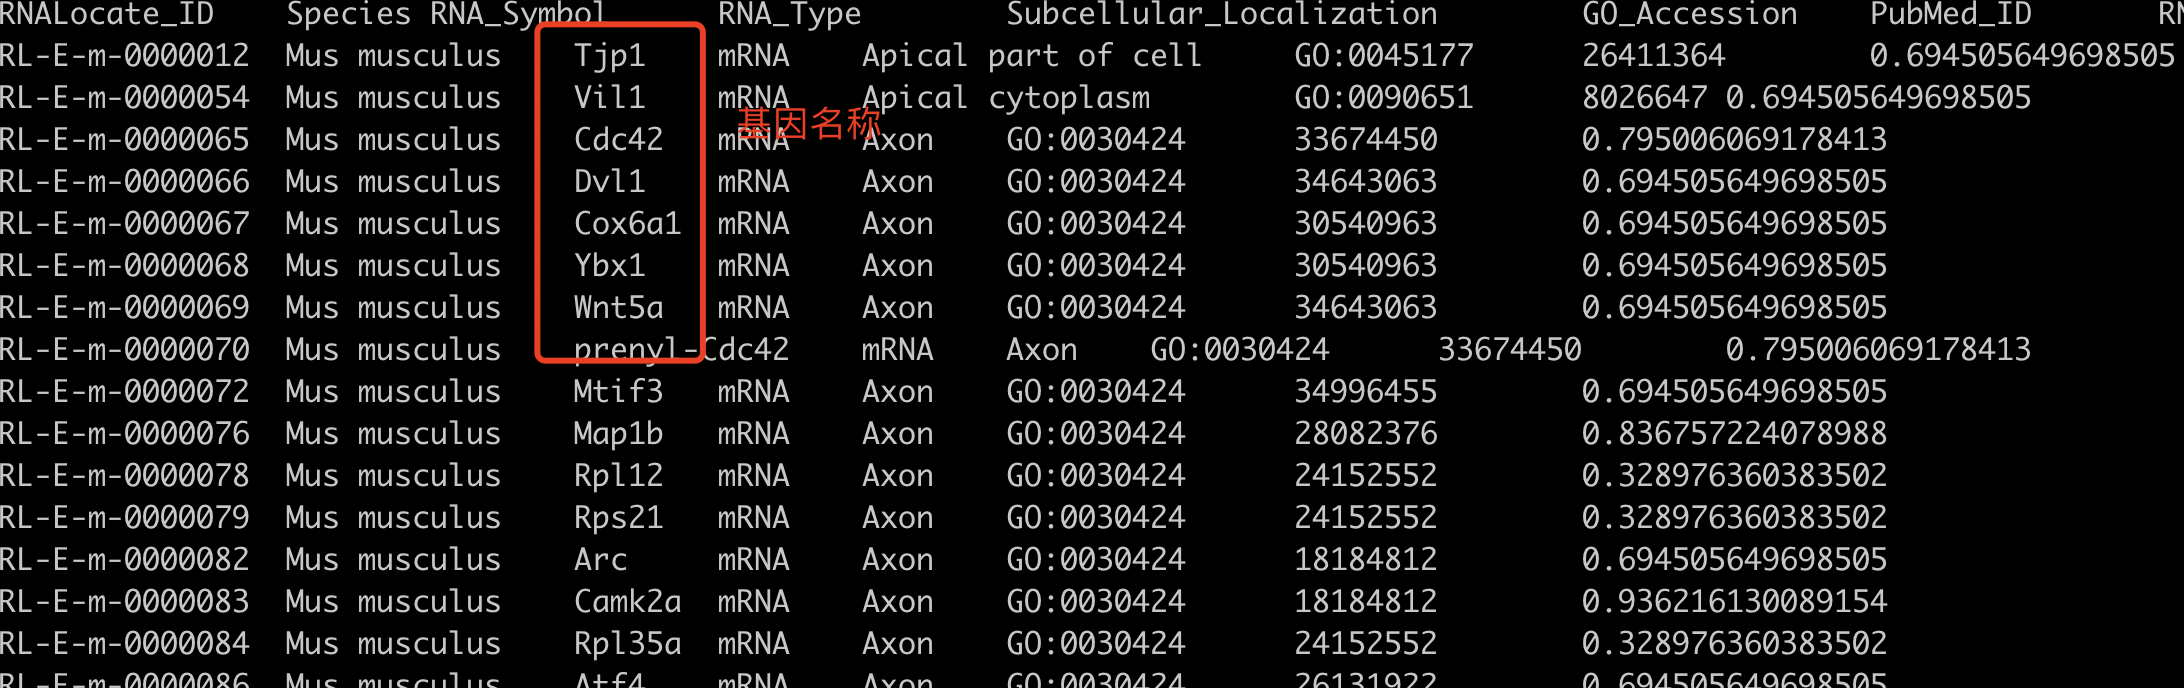
这样就可以获取到亚细胞定位相关的结果了
如果需进一步可视化,可参考如下代码
R
library(ggplot2)

workdir <- "path/Subcellular_Localization"
if(!dir.exists(workdir)){
  dir.create(workdir, recursive = T)
}
setwd(workdir)
loca_file <- "subcellular_localization.xls"

loca_df <- read.delim(loca_file, header = T, sep = "\t")

df_agg <- loca_df %>%
  group_by(RNA_Symbol, Subcellular_Localization) %>%
  summarise(Score = mean(RNALocate_Score), .groups = "drop")

df_plot <- df_agg %>%
  mutate(Localization_simple = case_when(
    grepl("nucleus|nucleoplasm|nucleolus", Subcellular_Localization, ignore.case = TRUE) ~ "Nucleus",
    grepl("cytosol", Subcellular_Localization, ignore.case = TRUE) ~ "Cytosol",
    grepl("extracellular|exosome|microvesicle|vesicle", Subcellular_Localization, ignore.case = TRUE) ~ "Extracellular Vesicles",
    grepl("mitochondrion", Subcellular_Localization, ignore.case = TRUE) ~ "Mitochondria",
    grepl("chromatin", Subcellular_Localization, ignore.case = TRUE) ~ "Chromatin",
    grepl("ribosome", Subcellular_Localization, ignore.case = TRUE) ~ "Ribosome",
    grepl("membrane", Subcellular_Localization, ignore.case = TRUE) ~ "Membrane",
    TRUE ~ "Other"
  )) %>%
  group_by(RNA_Symbol, Localization_simple) %>%
  summarise(Score = sum(Score), .groups = "drop") %>%
  filter(Localization_simple != "Other")


df_plot <- df_plot %>%
  arrange(RNA_Symbol, desc(Score))
write.table(df_plot, file = "plot_bar.xls", sep = "\t", quote = F, row.names = F)

p <- ggplot(df_plot, aes(x = RNA_Symbol, y = Score, fill = Localization_simple)) +
  geom_bar(stat = "identity", width = 0.7) +
  scale_fill_brewer(palette = "Set3") +
  labs(
    x ="",
    y = "Prediction Score"
  ) +
  theme_minimal() +
  theme(
    plot.background = element_rect(fill = "white", color = NA),
    panel.background = element_rect(fill = "white", color = NA),
    panel.grid = element_blank(),
    legend.title = element_text(size = 10),
    legend.text = element_text(size = 8),
    axis.line  = element_line(linewidth = 0.4, colour = "black"),
    axis.ticks.y = element_line(linewidth = 0.4, colour = "black"))+
  scale_y_continuous(expand = c(0,0))


ggsave(filename = "Location_bar.png", p, width = 6, height = 4, dpi=300)
ggsave(filename = "Location_bar.pdf", p, width = 6, height = 4, dpi=300)
以上就是亚细胞定位过程。