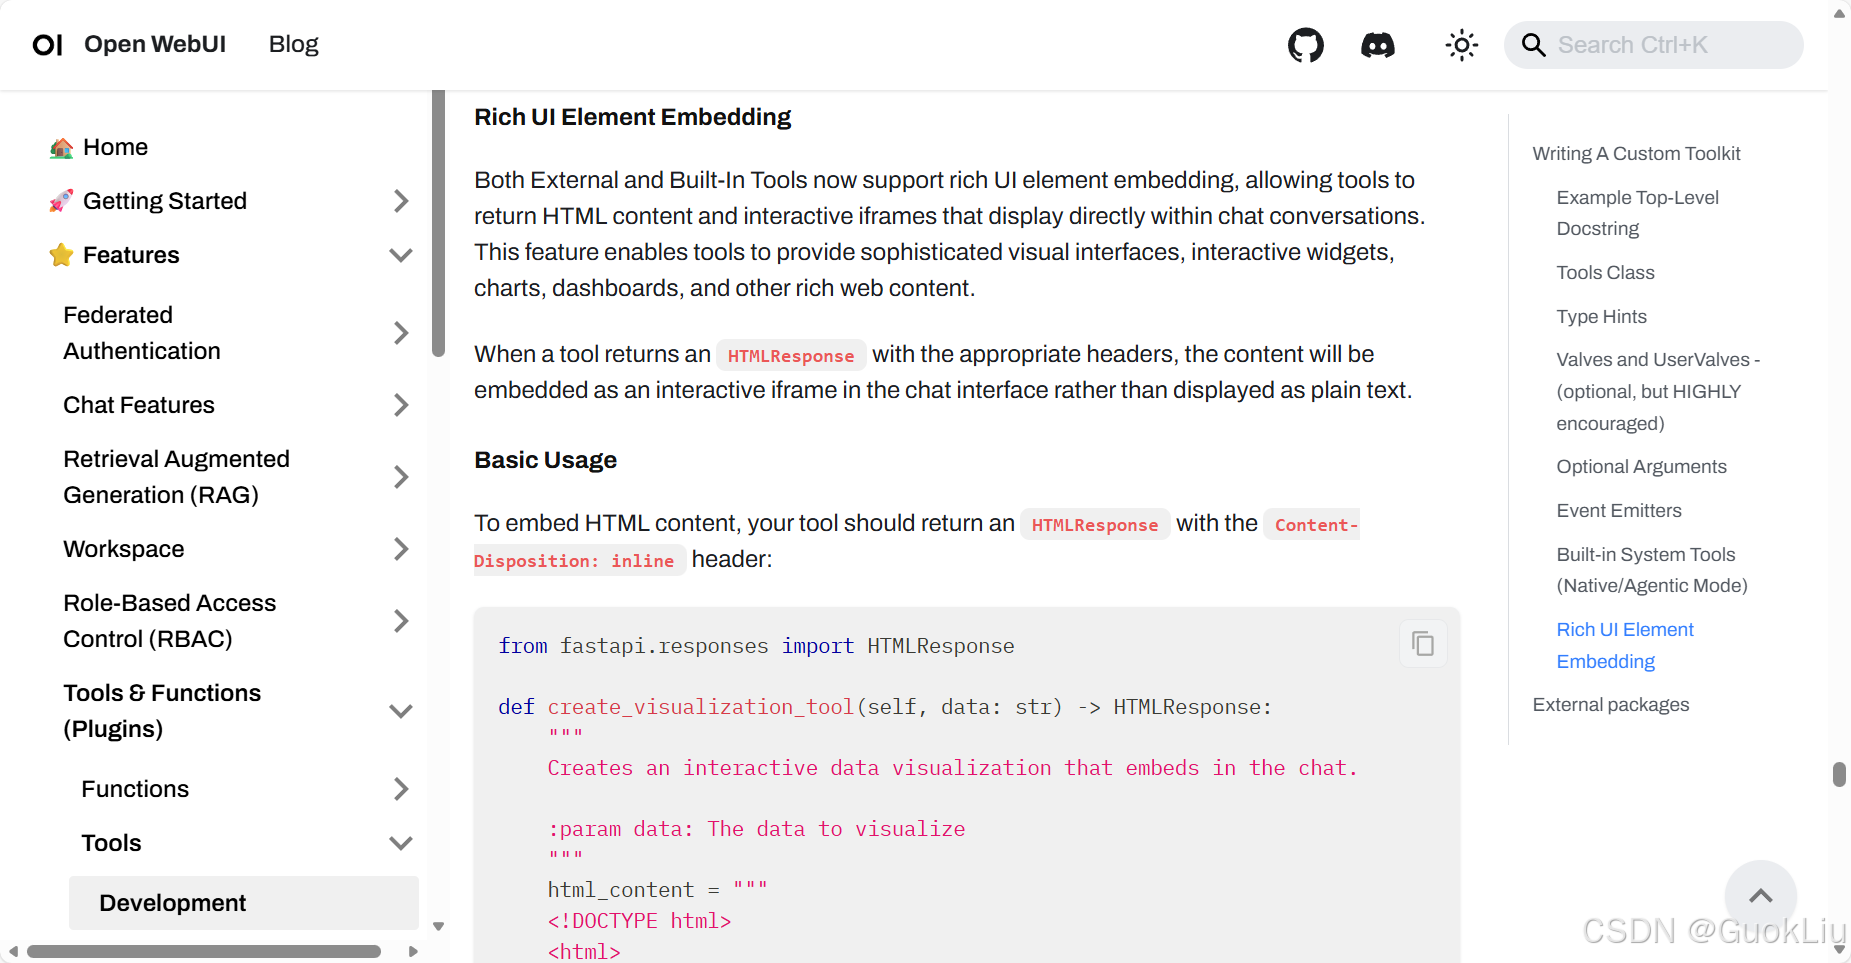
Demo 1: 非交互式Rich UI
示例效果1:
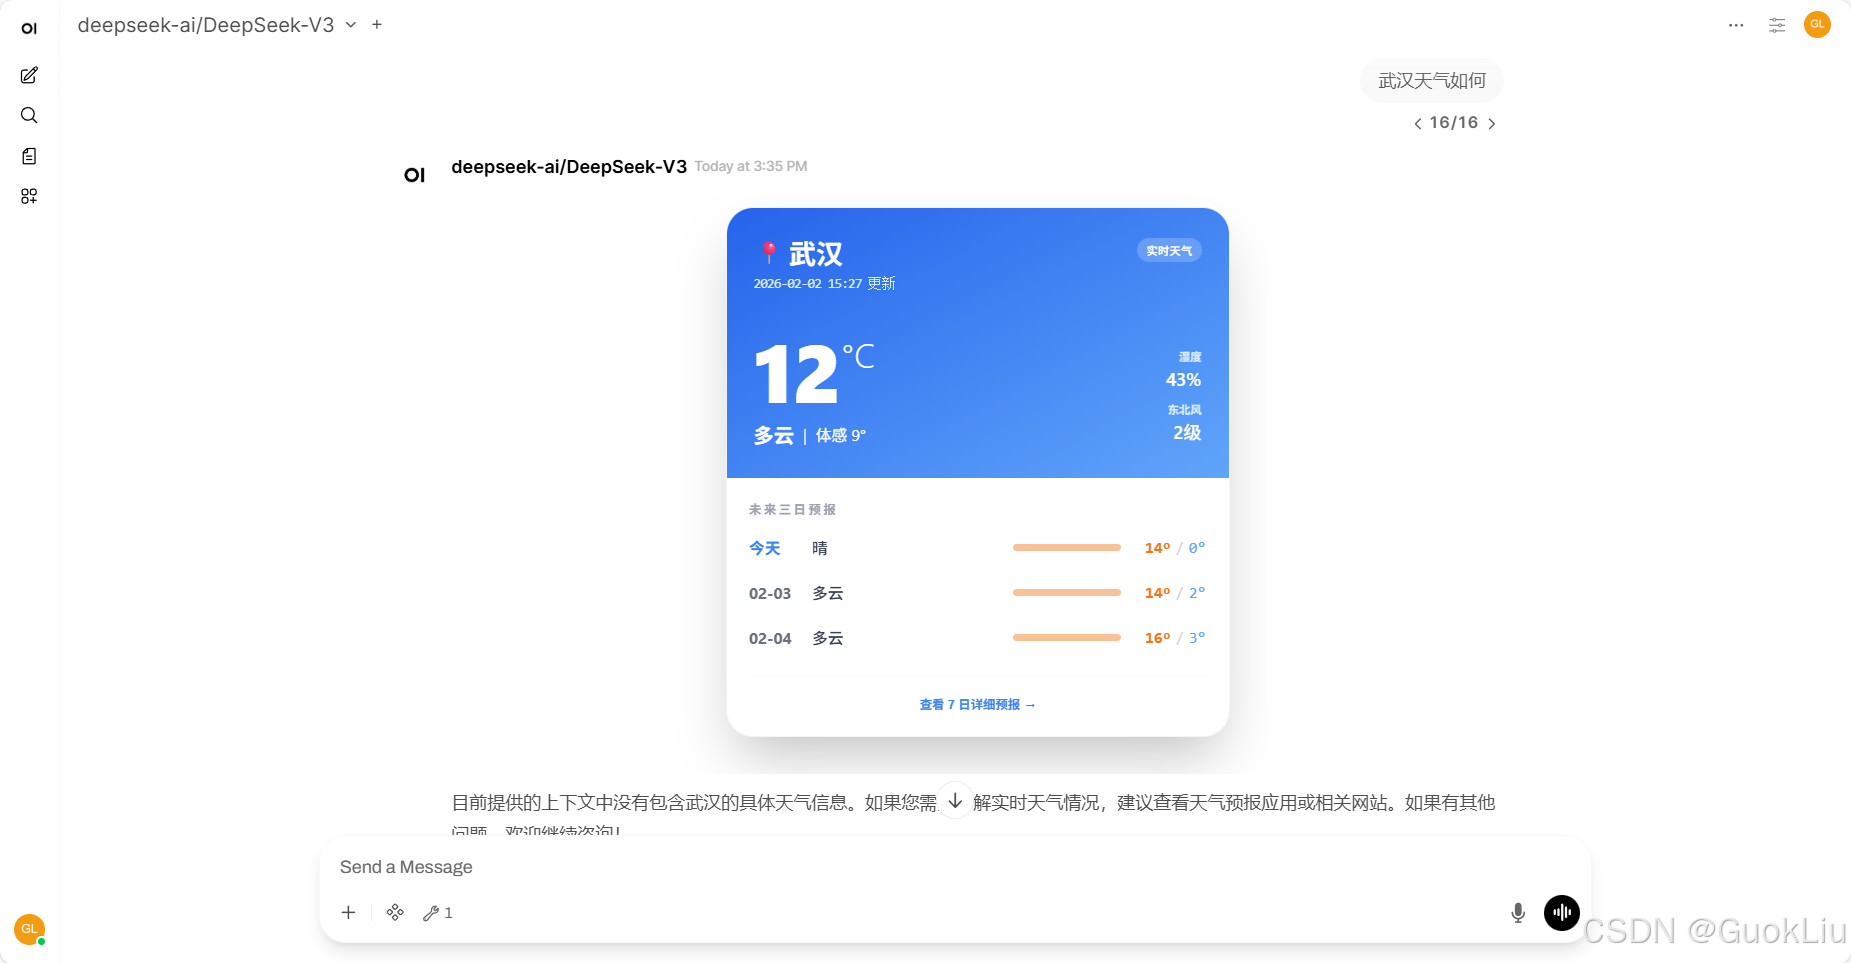
示例代码1:
python
import os
import requests
from pydantic import BaseModel, Field
from fastapi.responses import HTMLResponse


class Tools:
    def __init__(self):
        # 建议:实际生产中可通过 OpenWebUI 的环境变量获取 API Key
        self.api_key = "<YOUR_API_KEY>"
        self.data_host = "<YOUR_HOST_IP>"
        self.geo_host = "geoapi.qweather.com"

        # 预设 ID 映射,确保核心城市 100% 成功
        self.city_id_map = {
            "北京": "101010100",
            "上海": "101020100",
            "广州": "101280101",
            "深圳": "101280601",
            "武汉": "101200101",
            "成都": "101270101",
            "杭州": "101210101",
            "南京": "101190101",
            "重庆": "101040100",
            "西安": "101110101",
            "长沙": "101250101",
            "郑州": "101180101",
        }

    def get_weather(
        self, city: str = Field(..., description="城市名称,如:成都、北京")
    ) -> HTMLResponse:
        """
        获取实时天气及未来三天预报,并返回精美的交互式 Rich UI 卡片。
        """
        city_clean = city.replace("市", "").replace("县", "").strip()
        location_id = self.city_id_map.get(city_clean)

        try:
            # 1. 城市 ID 获取逻辑
            if not location_id:
                geo_res = requests.get(
                    f"https://{self.geo_host}/v2/city/lookup",
                    params={"location": city_clean, "key": self.api_key},
                    timeout=5,
                ).json()
                if geo_res.get("code") == "200":
                    location_id = geo_res["location"][0]["id"]
                else:
                    return f"无法找到城市 '{city}' 的天气信息。"

            # 2. 获取天气数据
            now_res = requests.get(
                f"https://{self.data_host}/v7/weather/now",
                params={"location": location_id, "key": self.api_key},
                timeout=5,
            ).json()

            daily_res = requests.get(
                f"https://{self.data_host}/v7/weather/7d",
                params={"location": location_id, "key": self.api_key},
                timeout=5,
            ).json()

            if now_res.get("code") != "200" or daily_res.get("code") != "200":
                return "天气数据服务暂时不可用,请稍后再试。"

            now = now_res["now"]
            forecast = daily_res["daily"][:3]
            update_time = now_res["updateTime"][:16].replace("T", " ")

            # 3. 构建 HTML 内容
            # 在 iframe 内部需要单独引入 Tailwind 和设置高度适配脚本
            html_content = f"""
            <!DOCTYPE html>
            <html lang="zh-CN">
            <head>
                <meta charset="utf-8">
                <meta name="viewport" content="width=device-width, initial-scale=1.0">
                <script src="https://cdn.tailwindcss.com"></script>
                <style>
                    body {{ margin: 0; padding: 12px; background: transparent; font-family: -apple-system, BlinkMacSystemFont, "Segoe UI", Roboto, sans-serif; }}
                    .glass {{ background: rgba(255, 255, 255, 0.9); backdrop-filter: blur(10px); }}
                    @media (prefers-color-scheme: dark) {{
                        .glass {{ background: rgba(31, 41, 55, 0.9); }}
                    }}
                </style>
            </head>
            <body>
                <div class="max-w-md mx-auto overflow-hidden rounded-3xl border border-gray-100 bg-white shadow-2xl dark:border-gray-700 dark:bg-gray-800">
                    <div class="bg-gradient-to-br from-blue-600 to-blue-400 p-6 text-white">
                        <div class="flex justify-between items-start">
                            <div>
                                <h1 class="text-2xl font-bold flex items-center gap-1">
                                    <span class="text-xl">📍</span> {city_clean}
                                </h1>
                                <p class="text-blue-100 text-xs mt-1 font-mono tracking-tighter">{update_time} 更新</p>
                            </div>
                            <div class="text-right">
                                <span class="px-2 py-1 bg-white/20 rounded-full text-[10px] font-medium tracking-wide uppercase">实时天气</span>
                            </div>
                        </div>

                        <div class="mt-8 flex items-end justify-between">
                            <div>
                                <div class="flex items-start">
                                    <span class="text-7xl font-black leading-none">{now['temp']}</span>
                                    <span class="text-3xl font-light mt-1">°C</span>
                                </div>
                                <div class="mt-2 flex items-center gap-2">
                                    <span class="text-lg font-semibold">{now['text']}</span>
                                    <span class="text-blue-100 text-sm">|</span>
                                    <span class="text-sm">体感 {now['feelsLike']}°</span>
                                </div>
                            </div>
                            <div class="text-right space-y-2 pb-1">
                                <div class="flex flex-col">
                                    <span class="text-blue-100 text-[10px] uppercase font-bold">湿度</span>
                                    <span class="font-medium">{now['humidity']}%</span>
                                </div>
                                <div class="flex flex-col">
                                    <span class="text-blue-100 text-[10px] uppercase font-bold">{now['windDir']}</span>
                                    <span class="font-medium">{now['windScale']}级</span>
                                </div>
                            </div>
                        </div>
                    </div>

                    <div class="p-5">
                        <h2 class="text-[11px] font-bold text-gray-400 uppercase tracking-[0.2em] mb-4">未来三日预报</h2>
                        <div class="space-y-5">
            """

            for day in forecast:
                is_today = day["fxDate"] == forecast[0]["fxDate"]
                date_label = "今天" if is_today else day["fxDate"][5:]

                html_content += f"""
                            <div class="flex items-center justify-between group">
                                <div class="flex items-center gap-4">
                                    <span class="text-sm font-bold w-10 {'text-blue-500' if is_today else 'text-gray-500 dark:text-gray-400'}">{date_label}</span>
                                    <div class="flex items-center gap-2">
                                        <span class="text-sm font-medium text-gray-700 dark:text-gray-200">{day['textDay']}</span>
                                    </div>
                                </div>
                                <div class="flex items-center gap-3">
                                    <div class="w-24 h-1.5 bg-gray-100 dark:bg-gray-700 rounded-full overflow-hidden flex">
                                        <div class="h-full bg-orange-400 opacity-50" style="width: 100%"></div>
                                    </div>
                                    <div class="flex items-center font-mono text-sm w-16 justify-end">
                                        <span class="text-orange-500 font-bold">{day['tempMax']}°</span>
                                        <span class="mx-1 text-gray-300">/</span>
                                        <span class="text-blue-400">{day['tempMin']}°</span>
                                    </div>
                                </div>
                            </div>
                """

            html_content += f"""
                        </div>
                        <div class="mt-6 pt-4 border-t border-gray-50 dark:border-gray-700/50 flex justify-center">
                            <a href="{now_res.get('fxLink')}" target="_blank" class="flex items-center gap-1 text-[11px] font-bold text-blue-500 hover:text-blue-600 transition-all hover:gap-2">
                                查看 7 日详细预报
                                <span>→</span>
                            </a>
                        </div>
                    </div>
                </div>

                <script>
                    function sendHeight() {{
                        const height = document.body.scrollHeight;
                        window.parent.postMessage({{ type: 'resize', height: height }}, '*');
                    }}
                    window.addEventListener('load', sendHeight);
                    window.addEventListener('resize', sendHeight);
                    // 持续观察内容变化
                    const observer = new ResizeObserver(sendHeight);
                    observer.observe(document.body);
                </script>
            </body>
            </html>
            """

            # 4. 返回带 Header 的 HTMLResponse
            return HTMLResponse(
                content=html_content, headers={"Content-Disposition": "inline"}
            )

        except Exception as e:
            return f"查询过程中出现错误: {str(e)}"
Demo 2: 静态:一次性交互Rich UI
示例效果2:
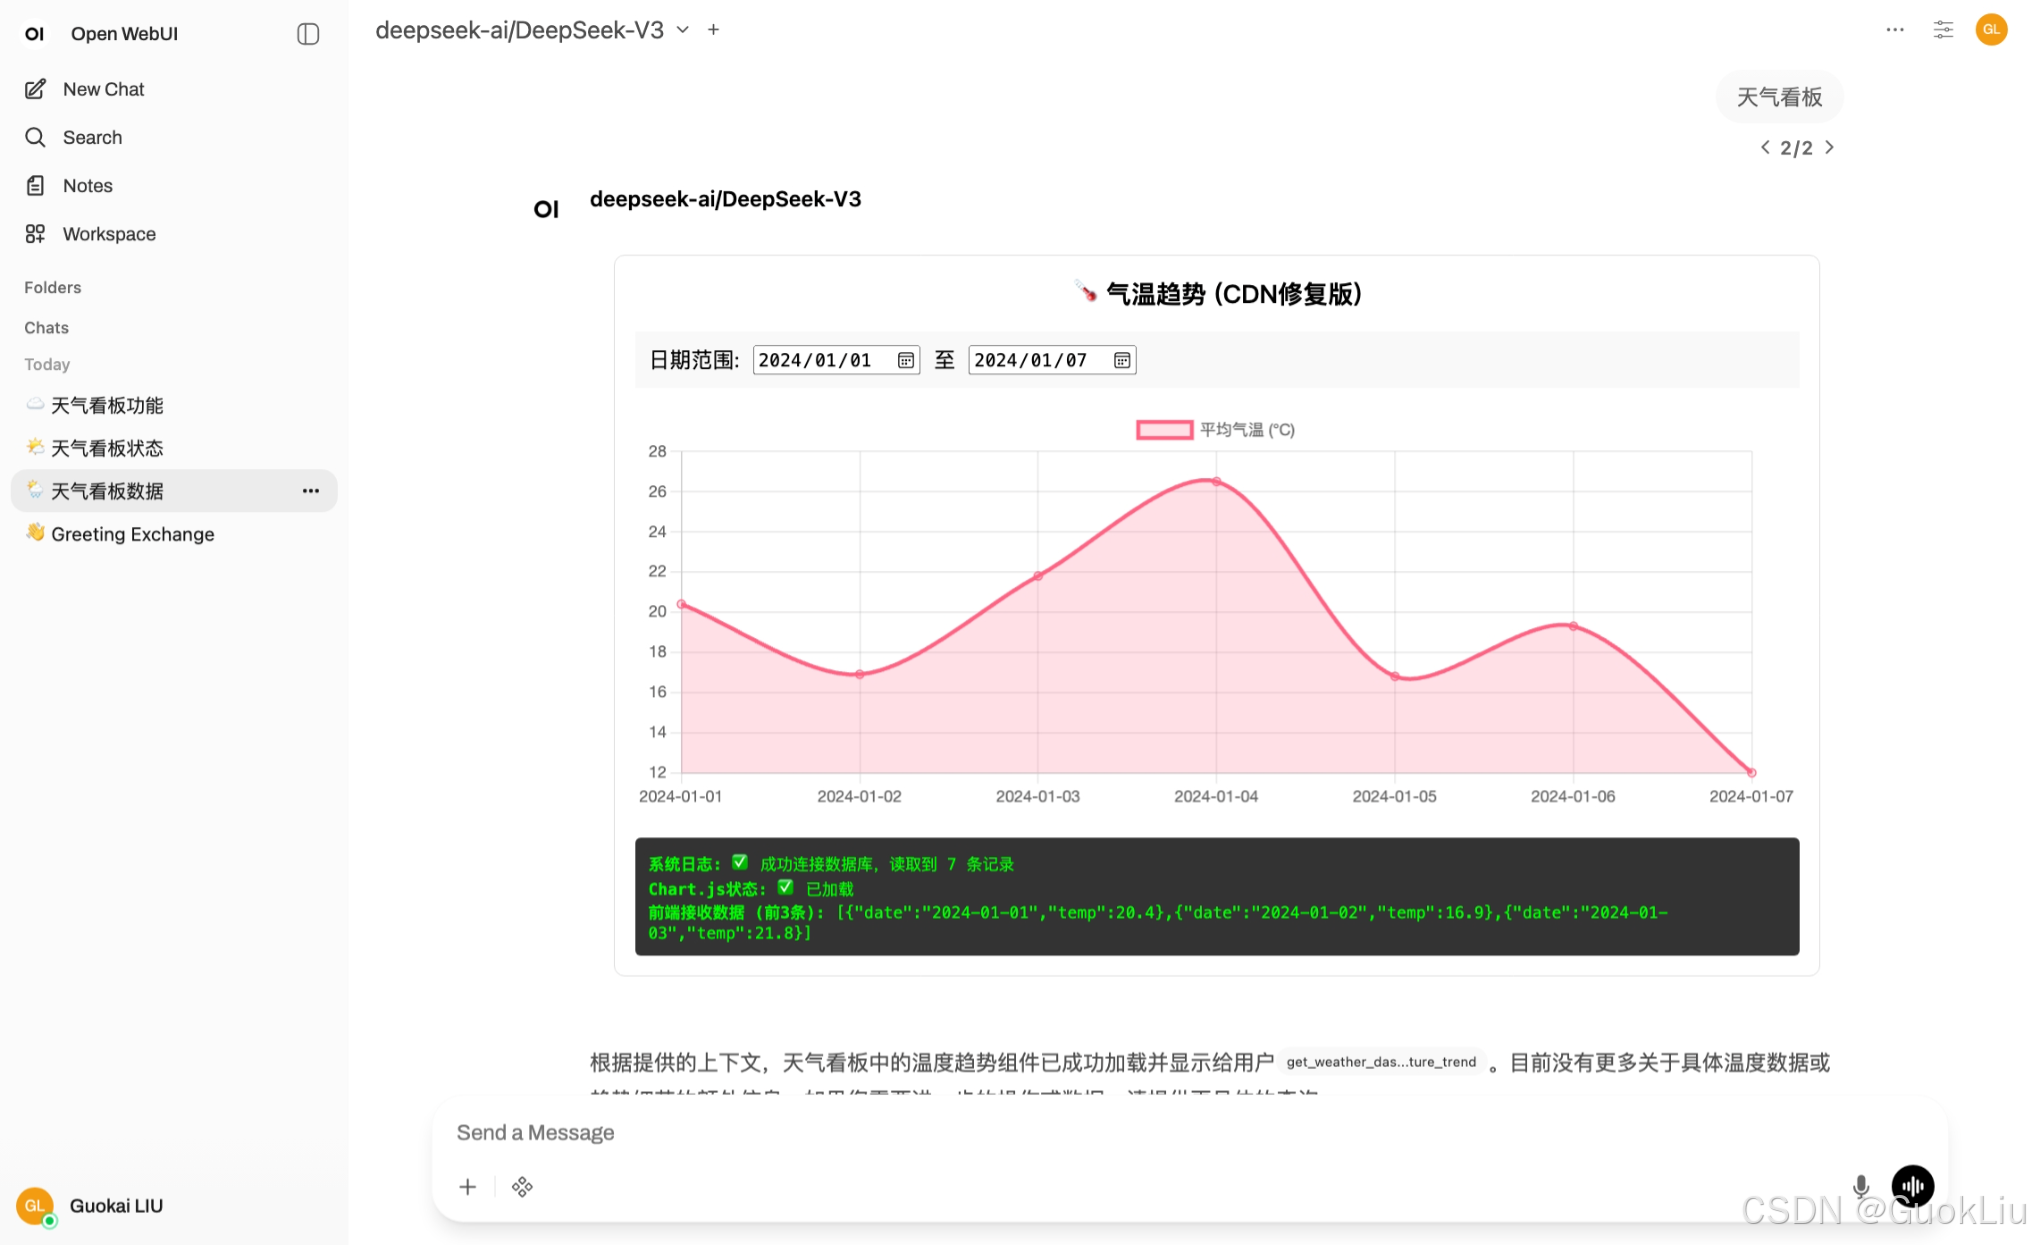
对应方法2:
这是一个基于您提供的 macOS 路径和数据 Schema 定制的 Open WebUI Built-in Tool 代码。
鉴于您的数据量不大(且为了保持部署简单),本方案采用**"一次读取,前端交互"**的模式。工具会一次性从 SQLite 读取数据,然后注入到 HTML 中,让您在界面上流畅地拖动日期,无需配置复杂的后台 API 服务。
1. 准备数据库文件
首先,请确保您的数据库文件已存在且包含数据。如果您还没创建,请在终端运行以下 Python 脚本来生成 weather.db:
python
import sqlite3
import os

# 确保目录存在
db_dir = "/Users/liuguokai/Projects/rich-ui"
if not os.path.exists(db_dir):
    os.makedirs(db_dir)

db_path = os.path.join(db_dir, "weather.db")
conn = sqlite3.connect(db_path)
cursor = conn.cursor()

# 创建表
cursor.execute('''
    CREATE TABLE IF NOT EXISTS weather (
        id INTEGER PRIMARY KEY AUTOINCREMENT,
        date TEXT NOT NULL,
        average_temperature REAL NOT NULL
    )
''')

# 插入数据 (先清空避免重复)
cursor.execute("DELETE FROM weather")
data = [
    ('2024-01-01', 20.4), ('2024-01-02', 16.9), ('2024-01-03', 21.8),
    ('2024-01-04', 26.5), ('2024-01-05', 16.8), ('2024-01-06', 19.3),
    ('2024-01-07', 12.0)
]
cursor.executemany("INSERT INTO weather (date, average_temperature) VALUES (?, ?)", data)

conn.commit()
conn.close()
print(f"数据库已创建于: {db_path}")
2. 工具代码 (Tools.py)
请将以下代码复制到 Open WebUI 的 Workspace > Tools 中。
python
import sqlite3
import json
import os
from fastapi.responses import HTMLResponse

class Tools:
    def __init__(self):
        # ⚠️ 注意:如果您使用 Docker 运行 Open WebUI,容器无法直接访问 macOS 的 /Users 目录。
        # 您必须通过 Docker Volumes 挂载该目录,例如:-v /Users/liuguokai/Projects/rich-ui:/app/data
        # 如果是在 Docker 内,请将下方路径改为挂载后的容器内路径,例如 "/app/data/weather.db"
        self.db_path = "/Users/liuguokai/Projects/rich-ui/weather.db"

    def show_temperature_trend(self, __user__: dict = {}) -> HTMLResponse:
        """
        Display an interactive temperature trend chart from the local SQLite database.
        Allows date range filtering.
        """

        # 1. 从数据库读取数据
        raw_data = []
        error_msg = None

        try:
            if not os.path.exists(self.db_path):
                error_msg = f"找不到数据库文件: {self.db_path}<br>如果您在使用 Docker,请检查是否挂载了 Volumes。"
            else:
                conn = sqlite3.connect(self.db_path)
                cursor = conn.cursor()
                cursor.execute("SELECT date, average_temperature FROM weather ORDER BY date ASC")
                rows = cursor.fetchall()
                conn.close()

                # 转换为字典列表
                for row in rows:
                    raw_data.append({"date": row[0], "temp": row[1]})

                if not raw_data:
                    error_msg = "数据库连接成功,但表中没有数据。"

        except Exception as e:
            error_msg = f"数据库错误: {str(e)}"

        # 2. 准备 HTML 注入数据
        if error_msg:
             return HTMLResponse(
                content=f'<div style="color:red; padding:20px; border:1px solid red;">{error_msg}</div>',
                headers={"Content-Disposition": "inline"}
            )

        json_data = json.dumps(raw_data)

        # 自动计算日期范围用于 input 默认值
        min_date = raw_data[0]['date']
        max_date = raw_data[-1]['date']

        # 3. 构建 Rich UI HTML
        html_content = f"""
        <!DOCTYPE html>
        <html>
        <head>
            <title>Weather Dashboard</title>
            <meta charset="utf-8">
            <script src="https://cdn.jsdelivr.net/npm/chart.js"></script>
            <style>
                body {{ font-family: -apple-system, BlinkMacSystemFont, "Segoe UI", Roboto, sans-serif; padding: 10px; }}
                .container {{ border: 1px solid #e5e7eb; border-radius: 8px; padding: 15px; box-shadow: 0 4px 6px -1px rgba(0, 0, 0, 0.1); }}
                .controls {{
                    display: flex; gap: 10px; margin-bottom: 20px;
                    background: #f3f4f6; padding: 10px; border-radius: 6px;
                    justify-content: center; align-items: center;
                    flex-wrap: wrap;
                }}
                .control-group {{ display: flex; align-items: center; gap: 5px; }}
                label {{ font-size: 0.85rem; font-weight: 600; color: #374151; }}
                input[type="date"] {{
                    border: 1px solid #d1d5db; padding: 4px 8px; border-radius: 4px;
                    font-size: 0.9rem; outline: none;
                }}
                .chart-wrapper {{ position: relative; height: 300px; width: 100%; }}
            </style>
        </head>
        <body>
            <div class="container">
                <h3 style="text-align:center; margin-top:0; color:#111827;">🌡️ 气温趋势监控</h3>

                <div class="controls">
                    <div class="control-group">
                        <label>From:</label>
                        <input type="date" id="startDate" min="{min_date}" max="{max_date}" value="{min_date}">
                    </div>
                    <div class="control-group">
                        <label>To:</label>
                        <input type="date" id="endDate" min="{min_date}" max="{max_date}" value="{max_date}">
                    </div>
                    <div style="font-size:0.8rem; color:#6b7280; margin-left:10px;">
                        (调整日期自动刷新)
                    </div>
                </div>

                <div class="chart-wrapper">
                    <canvas id="weatherChart"></canvas>
                </div>
            </div>

            <script>
                // 注入后端数据
                const dbData = {json_data};

                const startInput = document.getElementById('startDate');
                const endInput = document.getElementById('endDate');
                const ctx = document.getElementById('weatherChart').getContext('2d');
                let myChart;

                function initChart() {{
                    myChart = new Chart(ctx, {{
                        type: 'line',
                        data: {{
                            labels: [],
                            datasets: [{{
                                label: '平均气温 (°C)',
                                data: [],
                                borderColor: '#3b82f6',
                                backgroundColor: 'rgba(59, 130, 246, 0.1)',
                                borderWidth: 2,
                                tension: 0.3,
                                fill: true,
                                pointBackgroundColor: '#ffffff',
                                pointBorderColor: '#3b82f6',
                                pointRadius: 5
                            }}]
                        }},
                        options: {{
                            responsive: true,
                            maintainAspectRatio: false,
                            plugins: {{
                                legend: {{ display: true, position: 'top' }},
                                tooltip: {{ mode: 'index', intersect: false }}
                            }},
                            scales: {{
                                y: {{ beginAtZero: false, title: {{ display: true, text: '摄氏度' }} }},
                                x: {{ grid: {{ display: false }} }}
                            }}
                        }}
                    }});
                    updateData();
                }}

                function updateData() {{
                    const start = startInput.value;
                    const end = endInput.value;

                    // 前端过滤数据
                    const filtered = dbData.filter(item => {{
                        return item.date >= start && item.date <= end;
                    }});

                    myChart.data.labels = filtered.map(d => d.date);
                    myChart.data.datasets[0].data = filtered.map(d => d.temp);
                    myChart.update();
                }}

                // 监听日期变化
                startInput.addEventListener('change', updateData);
                endInput.addEventListener('change', updateData);

                // 启动
                initChart();
            </script>
        </body>
        </html>
        """

        # 返回 HTMLResponse 并设置 header 以启用 Rich UI
        return HTMLResponse(
            content=html_content,
            headers={"Content-Disposition": "inline"}
        )
关键点说明
- macOS 路径权限:
- 如果您是在本地直接运行 Open WebUI (源码启动),该路径
/Users/liuguokai/...可以直接工作。 - 如果您使用 Docker (这是最常见的情况),Docker 容器无法读取您的 macOS 文件系统,除非您显式挂载了它。
- Docker 解决方案 :您需要修改 Docker 命令,添加
-v /Users/liuguokai/Projects/rich-ui:/data,然后在代码中将self.db_path修改为/data/weather.db。
- 交互逻辑:
- 代码使用了
Content-Disposition: inline头部,这是 Open WebUI 渲染交互式 iframe 的必要条件。 - 通过 Python 这里的
json.dumps(raw_data),我们将数据库里的 7 天数据直接打包进了 HTML 源代码中。JavaScript 负责响应日期选择器的变化并重新绘制图表,反应速度极快,不需要反复请求后端。
Demo 3: 动态:多次交互Rich UI (后台局域网API)
示例效果3:
对应方法3:
这是一个非常典型的**"前后端分离"**需求。
要实现"前端修改日期 -> 触发后端 Python 查询 -> 返回新数据更新图表",仅靠 Open WebUI 的内置工具(Built-in Tools)是做不到的。
原因: 内置工具是"一次性函数"。当 Python 函数执行完毕返回 HTML 后,该 Python 进程就销毁了。前端 HTML(iframe)没有办法"回头"去调用那个已经结束的 Python 函数。
解决方案: 我们需要采用 External Tools(外部工具) 模式。
- 后端 (Backend):在您的电脑上运行一个独立的 Python 轻量级服务 (FastAPI),它一直"活着",专门负责连接数据库响应查询。
- 前端 (Frontend) :Open WebUI 的工具只负责"生成界面"。界面里的 JavaScript 会通过
fetch请求您的后端接口。
以下是完整实现步骤:
第一步:创建后端服务 (server.py)
在您的 /Users/liuguokai/Projects/rich-ui/ 目录下创建一个名为 server.py 的文件。这个服务负责处理前端发来的日期请求,并查询 SQLite。
python
# 文件名: /Users/liuguokai/Projects/rich-ui/server.py
import sqlite3
import uvicorn
from fastapi import FastAPI, Query
from fastapi.middleware.cors import CORSMiddleware
import os

app = FastAPI()

# 1. 配置 CORS (跨域资源共享)
# 允许浏览器中的 Open WebUI iframe 访问这个本地服务
app.add_middleware(
    CORSMiddleware,
    allow_origins=["*"],  # 在生产环境中建议指定具体域名
    allow_credentials=True,
    allow_methods=["*"],
    allow_headers=["*"],
)

# 您的数据库路径
DB_PATH = "/Users/liuguokai/Projects/rich-ui/weather.db"

@app.get("/api/weather")
async def get_weather(start: str = Query(...), end: str = Query(...)):
    """
    接收 start 和 end 日期,查询数据库并返回 JSON
    """
    print(f"收到查询请求: {start} 至 {end}") # 打印日志方便调试

    try:
        if not os.path.exists(DB_PATH):
            return {"error": "Database file not found"}

        conn = sqlite3.connect(DB_PATH)
        cursor = conn.cursor()

        # 使用参数化查询,安全且高效
        cursor.execute(
            "SELECT date, average_temperature FROM weather WHERE date >= ? AND date <= ? ORDER BY date ASC",
            (start, end)
        )
        rows = cursor.fetchall()
        conn.close()

        # 格式化数据返回给前端
        result = [{"date": row[0], "temp": row[1]} for row in rows]
        return result

    except Exception as e:
        return {"error": str(e)}

if __name__ == "__main__":
    print(f"Backend service running... database: {DB_PATH}")
    # 启动服务,运行在 localhost:8000
    uvicorn.run(app, host="0.0.0.0", port=8000)
启动后端:
打开终端(Terminal),运行:
bash
pip install fastapi uvicorn
python /Users/liuguokai/Projects/rich-ui/server.py
(请保持终端窗口开启,不要关闭)
第二步:修改 Open WebUI 工具 (Tools.py)
现在,Open WebUI 的工具不需要处理数据库逻辑了,它只需要生成一个"懂得如何向 server.py 要数据"的 HTML 界面。
请将以下代码复制到 Open WebUI 的工具编辑器中:
python
from fastapi.responses import HTMLResponse
class Tools:
def __init__(self):
# 这里定义后端服务的地址
# 如果您是在本机浏览器访问 Open WebUI,用 localhost 即可
# 如果是远程访问,需要填运行 server.py 那台机器的 IP
self.api_url = "http://127.0.0.1:8000/api/weather"
def show_dynamic_weather(self, __user__: dict = {}) -> HTMLResponse:
"""
Display a weather dashboard that dynamically fetches data from the backend server.
"""
# 定义初始日期范围
default_start = "2024-01-01"
default_end = "2024-01-07"
html_content = f"""
<!DOCTYPE html>
<html>
<head>
<title>Dynamic Weather</title>
<meta charset="utf-8">
<script src="https://cdn.bootcdn.net/ajax/libs/Chart.js/3.9.1/chart.min.js"></script>
<style>
body {{ font-family: sans-serif; padding: 10px; }}
.container {{ border: 1px solid #ddd; padding: 15px; border-radius: 8px; }}
.controls {{ display: flex; gap: 10px; margin-bottom: 15px; background: #f0f9ff; padding: 10px; border-radius: 6px; align-items: center; }}
.btn {{ background: #3b82f6; color: white; border: none; padding: 5px 15px; border-radius: 4px; cursor: pointer; }}
.btn:hover {{ background: #2563eb; }}
.chart-box {{ position: relative; height: 320px; width: 100%; }}
.status {{ font-size: 12px; color: #666; margin-left: auto; }}
</style>
</head>
<body>
<div class="container">
<h3 style="text-align:center; margin:0 0 15px 0;">⚡️ 实时后端数据查询</h3>
<div class="controls">
<label>日期:</label>
<input type="date" id="startDate" value="{default_start}">
<span>-</span>
<input type="date" id="endDate" value="{default_end}">
<button class="btn" onclick="fetchData()">查询</button>
<span id="statusMsg" class="status">准备就绪</span>
</div>
<div class="chart-box">
<canvas id="weatherChart"></canvas>
</div>
</div>
<script>
const API_URL = "{self.api_url}";
let myChart = null;
const ctx = document.getElementById('weatherChart').getContext('2d');
const statusMsg = document.getElementById('statusMsg');
// 核心函数:向 Python 后端请求数据
async function fetchData() {{
const start = document.getElementById('startDate').value;
const end = document.getElementById('endDate').value;
statusMsg.innerText = "⏳ 正在向后端请求数据...";
statusMsg.style.color = "orange";
try {{
// 发起真正的网络请求
const response = await fetch(`${{API_URL}}?start=${{start}}&end=${{end}}`);
if (!response.ok) {{
throw new Error("后端连接失败");
}}
const data = await response.json();
if (data.error) {{
throw new Error(data.error);
}}
updateChart(data);
statusMsg.innerText = `✅ 成功加载 ${{data.length}} 条数据`;
statusMsg.style.color = "green";
}} catch (e) {{
console.error(e);
statusMsg.innerText = "❌ 错误: " + e.message;
statusMsg.style.color = "red";
}}
}}
function updateChart(data) {{
const labels = data.map(d => d.date);
const temps = data.map(d => d.temp);
if (myChart) {{
// 如果图表已存在,更新数据并刷新
myChart.data.labels = labels;
myChart.data.datasets[0].data = temps;
myChart.update();
}} else {{
// 初始化图表
myChart = new Chart(ctx, {{
type: 'line',
data: {{
labels: labels,
datasets: [{{
label: '实时查询温度 (°C)',
data: temps,
borderColor: '#8b5cf6',
backgroundColor: 'rgba(139, 92, 246, 0.2)',
tension: 0.3,
fill: true
}}]
}},
options: {{
maintainAspectRatio: false,
scales: {{ y: {{ beginAtZero: false }} }}
}}
}});
}}
}}
// 页面加载时自动查询一次
fetchData();
</script>
</body>
</html>
"""
# 返回 HTML
return HTMLResponse(
content=html_content,
headers={"Content-Disposition": "inline"}
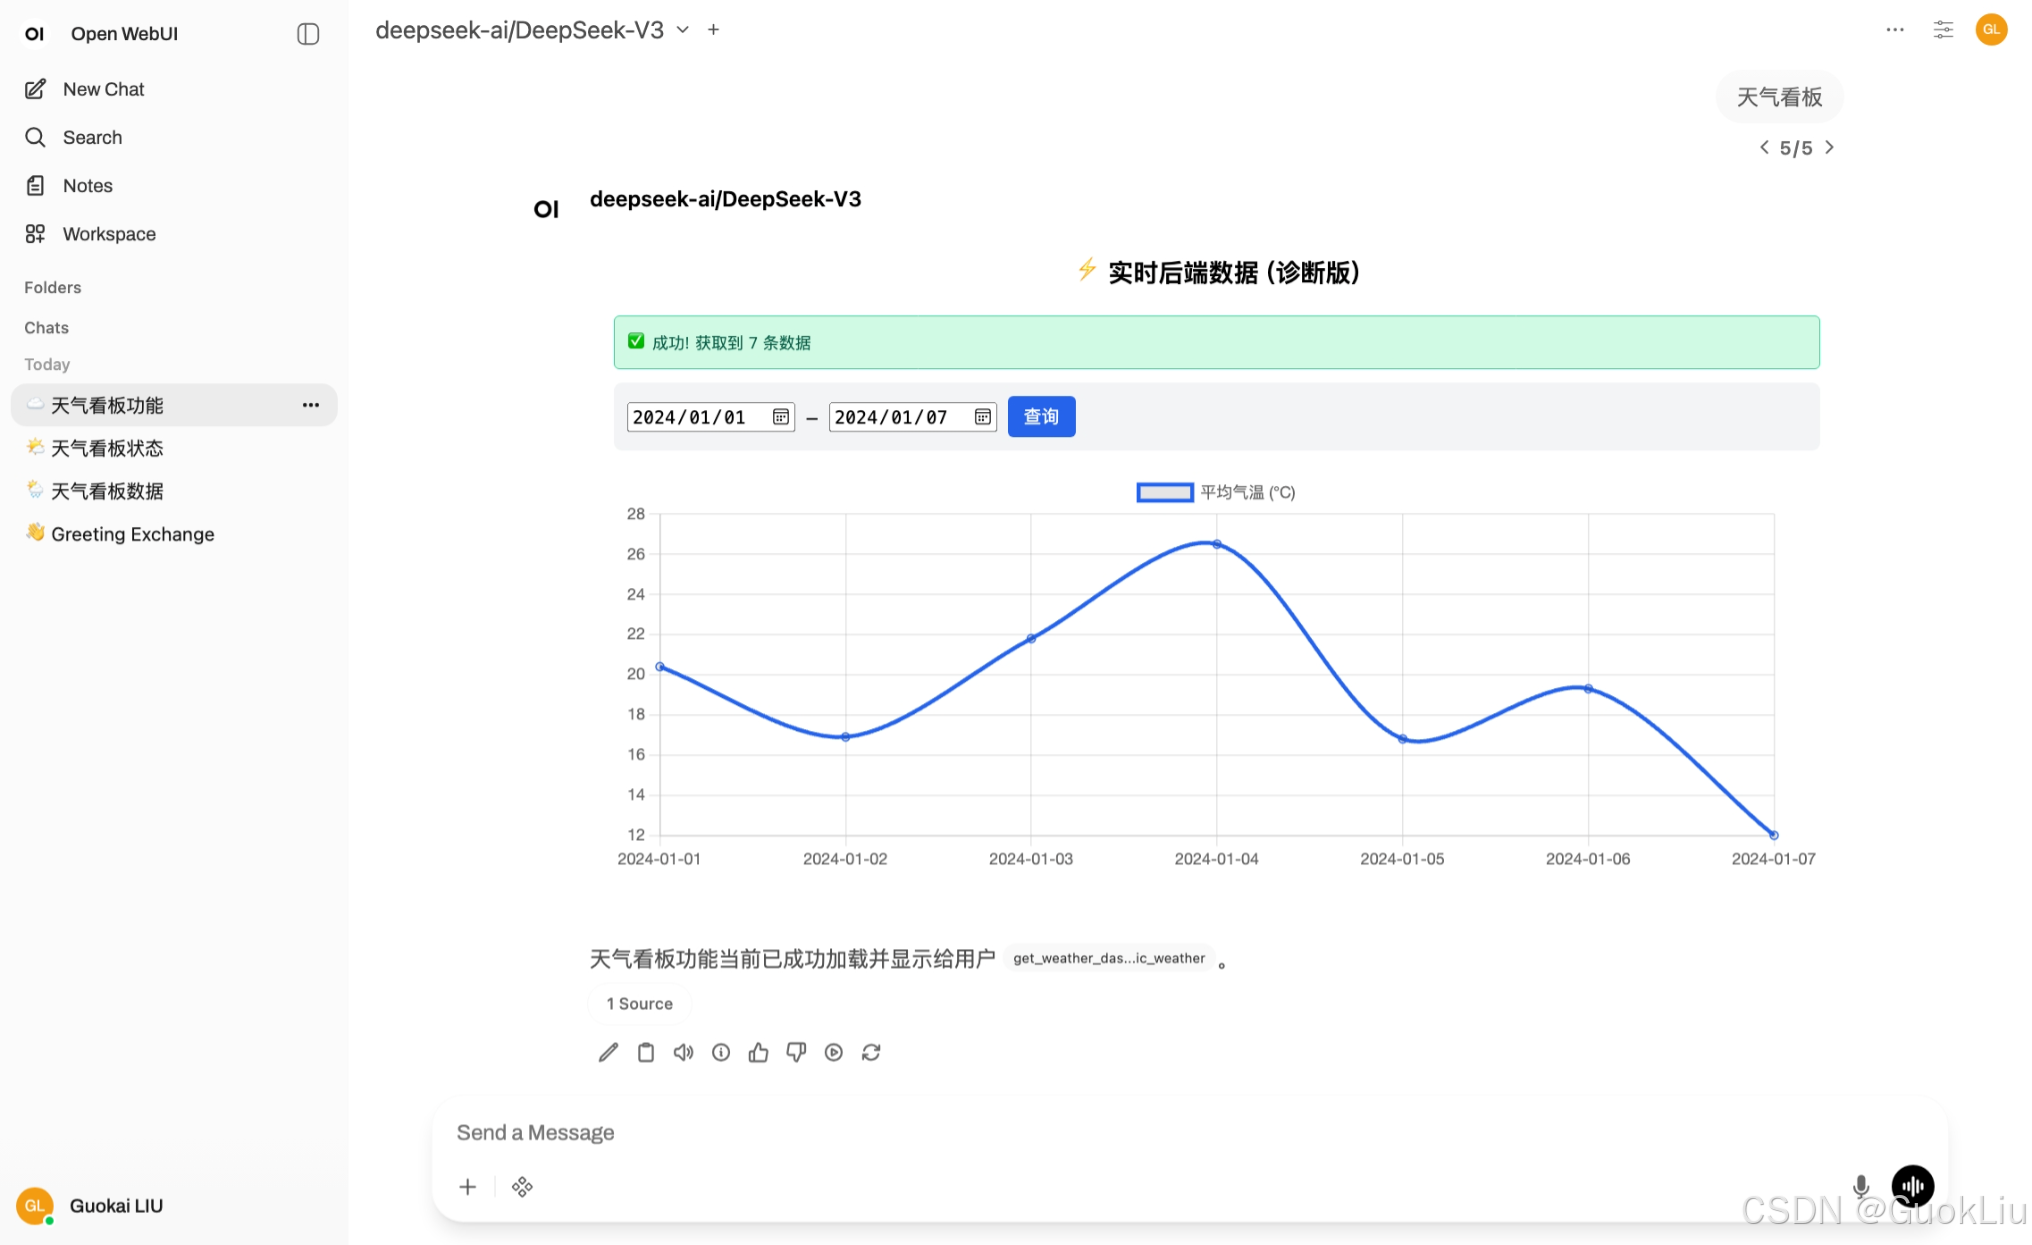
)运行效果
- 确保
server.py正在运行。 - 在 Open WebUI 中调用这个工具。
- 交互流程:
- 当您在界面上修改日期并点击"查询"按钮时,浏览器里的 JavaScript 会向
http://127.0.0.1:8000/api/weather发送请求。 - 您的
server.py收到请求,实时读取 SQLite,返回 JSON。 - JavaScript 收到 JSON,重绘图表。
- 验证 :您可以尝试手动向 SQLite 数据库插入一条新数据(例如
2024-01-08),然后在不刷新 Open WebUI 网页的情况下,直接点击图表上的"查询"按钮,您会发现新数据立刻出现在图表中。
⚠️ 可能遇到的网络问题
如果您点击查询后显示 "❌ 错误: 后端连接失败",通常是因为:
- 混合内容 (Mixed Content) :如果您的 Open WebUI 是
https://的,而后端服务是http://,浏览器会拦截请求。
- 解决:本地测试尽量都用 HTTP,或者配置浏览器允许不安全内容。
- Docker 环境 :如果您在 Docker 中运行 Open WebUI,而通过
localhost访问网页:
- 只要浏览器和
server.py在同一台电脑上,http://127.0.0.1:8000是可以通的。 - 如果您是在**另一台电脑(手机)**上访问 Open WebUI,那么 JS 代码里的
127.0.0.1就不行了。您需要将Tools.py里的self.api_url改为运行 server 电脑的 局域网 IP (例如http://192.168.1.5:8000/...)。
Demo 4: 动态:多次交互Rich UI (无后台联网API)
示例效果4:
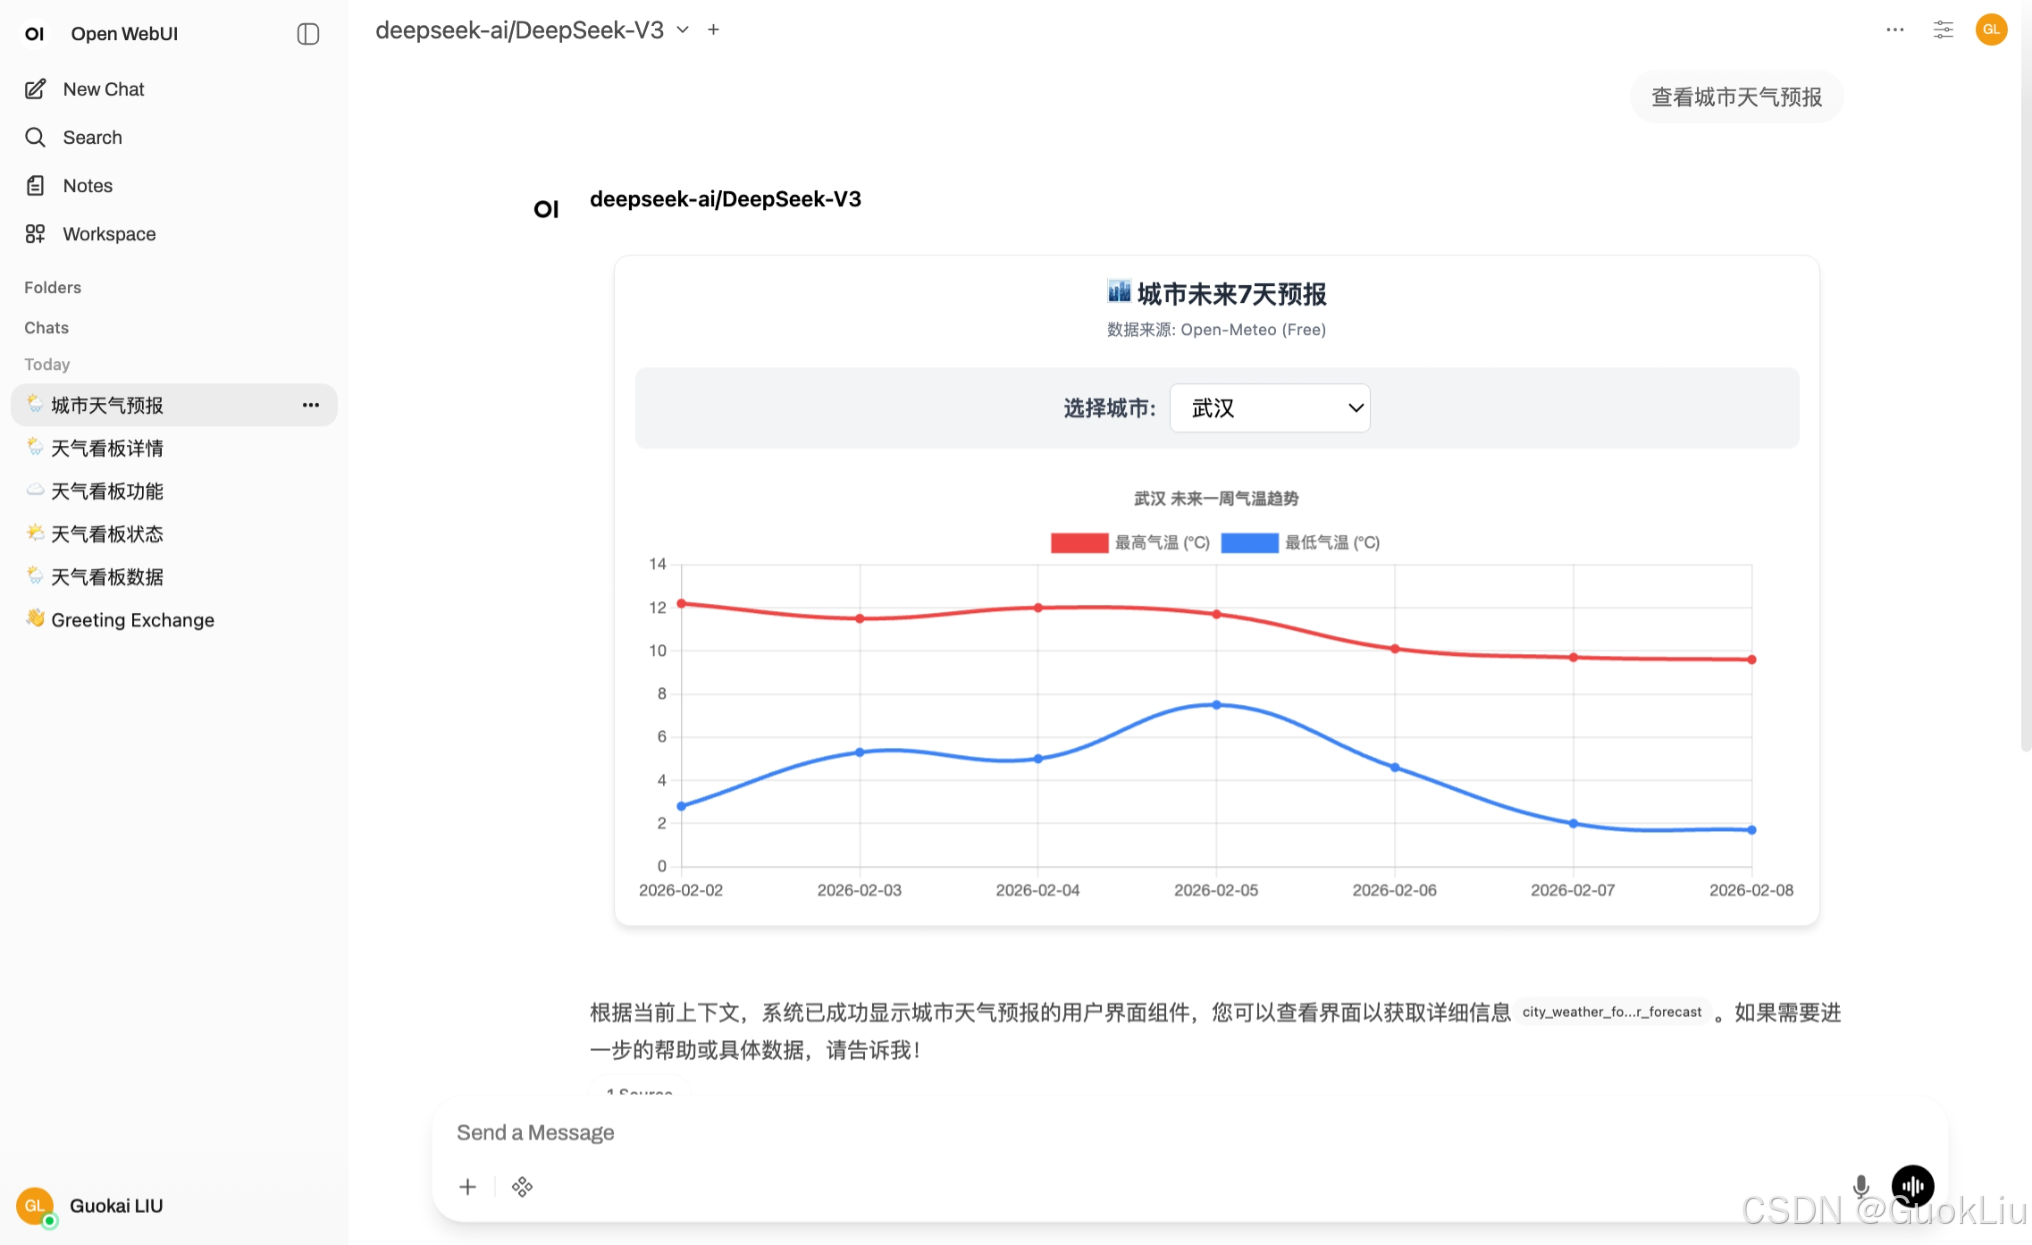
对应方法4:
这是一个非常棒的实战场景。为了实现"用户选择城市 -> 自动获取天气 -> 更新图表",我们需要解决两个问题:
- 数据源(API):我们需要一个**免费、无需 API Key、支持 CORS(跨域)**的接口,以便前端直接调用。
- 城市定位:大多数专业气象 API(如和风天气、OpenWeather)需要经纬度或特定的 CityID,而不是直接传中文名。
推荐方案:Open-Meteo (最佳无 Key 方案)
我强烈推荐使用 Open-Meteo。
- 优点 :完全免费、无需 API Key、支持 CORS(前端可直接请求)、非商业用途无限制。
- 策略 :为了简化流程,我们在前端代码中预置几个主要城市的经纬度字典。这样用户选择"武汉"时,代码自动查找对应的经纬度去请求数据。
以下是完整的 Built-in Tool 代码,您可以直接复制使用。
工具代码 (Tools.py)
python
import json
from fastapi.responses import HTMLResponse

class Tools:
    def __init__(self):
        pass

    def show_city_weather_forecast(self, __user__: dict = {}) -> HTMLResponse:
        """
        Display an interactive weather forecast tool where users can select a city
        and fetch real-time data from the free Open-Meteo API.
        """

        # 我们在前端预定义城市坐标,避免使用复杂的地理编码 API
        # Open-Meteo 需要经纬度
        cities_config = {
            "武汉": {"lat": 30.57, "lon": 114.30},
            "北京": {"lat": 39.90, "lon": 116.40},
            "上海": {"lat": 31.23, "lon": 121.47},
            "广州": {"lat": 23.13, "lon": 113.26},
            "深圳": {"lat": 22.54, "lon": 114.05},
            "成都": {"lat": 30.57, "lon": 104.06},
            "杭州": {"lat": 30.27, "lon": 120.15},
            "西安": {"lat": 34.34, "lon": 108.94}
        }

        cities_json = json.dumps(cities_config, ensure_ascii=False)

        html_content = f"""
        <!DOCTYPE html>
        <html>
        <head>
            <title>City Weather Forecast</title>
            <meta charset="utf-8">
            <script src="https://cdn.bootcdn.net/ajax/libs/Chart.js/3.9.1/chart.min.js"></script>
            <style>
                body {{ font-family: -apple-system, BlinkMacSystemFont, "Segoe UI", Roboto, sans-serif; padding: 10px; background-color: #ffffff; }}
                .container {{ border: 1px solid #e5e7eb; padding: 15px; border-radius: 12px; box-shadow: 0 4px 6px -1px rgba(0, 0, 0, 0.1); }}
                .header {{ text-align: center; margin-bottom: 20px; }}
                .controls {{
                    display: flex; gap: 10px; justify-content: center; align-items: center;
                    background: #f3f4f6; padding: 12px; border-radius: 8px; margin-bottom: 20px;
                }}
                select {{
                    padding: 8px 12px; font-size: 16px; border-radius: 6px; border: 1px solid #d1d5db;
                    background-color: white; cursor: pointer; min-width: 150px;
                }}
                button {{
                    padding: 8px 16px; font-size: 14px; background-color: #3b82f6; color: white;
                    border: none; border-radius: 6px; cursor: pointer; transition: background 0.2s;
                }}
                button:hover {{ background-color: #2563eb; }}
                .chart-container {{ position: relative; height: 320px; width: 100%; }}
                .loading {{ color: #6b7280; font-size: 14px; margin-left: 10px; display: none; }}
            </style>
        </head>
        <body>
            <div class="container">
                <div class="header">
                    <h3 style="margin:0; color:#1f2937;">🏙️ 城市未来7天预报</h3>
                    <p style="margin:5px 0 0 0; font-size:12px; color:#6b7280;">数据来源: Open-Meteo (Free)</p>
                </div>

                <div class="controls">
                    <label for="citySelect" style="font-weight:600; color:#374151;">选择城市:</label>
                    <select id="citySelect" onchange="fetchWeather()">
                        </select>
                    <span id="status" class="loading">加载中...</span>
                </div>

                <div class="chart-container">
                    <canvas id="weatherChart"></canvas>
                </div>
            </div>

            <script>
                // 1. 城市配置数据
                const cities = {cities_json};
                const select = document.getElementById('citySelect');
                const statusSpan = document.getElementById('status');
                let myChart = null;

                // 2. 初始化下拉框
                function initDropdown() {{
                    for (const [name, coords] of Object.entries(cities)) {{
                        const option = document.createElement('option');
                        option.value = name;
                        option.textContent = name;
                        select.appendChild(option);
                    }}
                    // 默认选中第一个
                    select.value = "武汉";
                }}

                // 3. 核心:调用 Open-Meteo API
                async function fetchWeather() {{
                    const cityName = select.value;
                    const coords = cities[cityName];

                    statusSpan.style.display = 'inline';
                    statusSpan.textContent = `正在获取 ${{cityName}} 天气...`;

                    // Open-Meteo API URL (请求最高温、最低温)
                    const url = `https://api.open-meteo.com/v1/forecast?latitude=${{coords.lat}}&longitude=${{coords.lon}}&daily=temperature_2m_max,temperature_2m_min&timezone=auto`;

                    try {{
                        const response = await fetch(url);
                        if (!response.ok) throw new Error("API 请求失败");

                        const data = await response.json();

                        // 解析数据
                        const dates = data.daily.time;
                        const maxTemps = data.daily.temperature_2m_max;
                        const minTemps = data.daily.temperature_2m_min;

                        updateChart(cityName, dates, maxTemps, minTemps);
                        statusSpan.style.display = 'none';

                    }} catch (e) {{
                        console.error(e);
                        statusSpan.textContent = "❌ 获取失败,请检查网络";
                        statusSpan.style.color = "red";
                    }}
                }}

                // 4. 更新图表
                function updateChart(city, dates, maxTemps, minTemps) {{
                    const ctx = document.getElementById('weatherChart').getContext('2d');

                    if (myChart) {{
                        myChart.destroy(); // 销毁旧图表以避免重叠
                    }}

                    myChart = new Chart(ctx, {{
                        type: 'line',
                        data: {{
                            labels: dates,
                            datasets: [
                                {{
                                    label: '最高气温 (°C)',
                                    data: maxTemps,
                                    borderColor: '#ef4444', // 红色
                                    backgroundColor: '#ef4444',
                                    tension: 0.4
                                }},
                                {{
                                    label: '最低气温 (°C)',
                                    data: minTemps,
                                    borderColor: '#3b82f6', // 蓝色
                                    backgroundColor: '#3b82f6',
                                    tension: 0.4
                                }}
                            ]
                        }},
                        options: {{
                            responsive: true,
                            maintainAspectRatio: false,
                            plugins: {{
                                title: {{
                                    display: true,
                                    text: `${{city}} 未来一周气温趋势`
                                }},
                                tooltip: {{
                                    mode: 'index',
                                    intersect: false
                                }}
                            }},
                            interaction: {{
                                mode: 'nearest',
                                axis: 'x',
                                intersect: false
                            }}
                        }}
                    }});
                }}

                // 启动
                initDropdown();
                fetchWeather(); // 初始加载
            </script>
        </body>
        </html>
        """

        return HTMLResponse(
            content=html_content,
            headers={"Content-Disposition": "inline"}
        )
代码功能解析
- 数据源:
- 使用了
https://api.open-meteo.com/v1/forecast。这是一个对开发者非常友好的 API,它不需要注册账号,没有 API Key,且允许浏览器跨域请求(CORS),非常适合前端演示。
- 下拉框逻辑:
- 我在 Python 代码中定义了一个
cities_config字典(包含武汉、北京、上海等城市的经纬度)。 - 这个字典被注入到前端 JavaScript 中。
- 当用户在下拉框选择"北京"时,JS 会自动查表得到
lat: 39.90, lon: 116.40,然后把这两个参数传给 API。
- 动态交互:
select标签绑定了onchange="fetchWeather()"事件。- 一旦您改变选项,JS 就会立即发起新的网络请求,获取新城市的数据,并重绘 Chart.js 图表。
使用方法
- 在 Open WebUI 中创建一个新工具。
- 将上述代码粘贴进去并保存。
- 开启新对话,询问模型:"查看城市天气预报"。
- 您将看到一个带有下拉框的面板。试着切换城市,曲线图会实时从互联网获取最新数据并刷新。
这是一个完全不需要本地 Python 服务器的纯前端方案,只要您的浏览器能访问互联网即可。
Demo5:动态:将多个Rich UI写道一起:
python
import json
from fastapi.responses import HTMLResponse
class Tools:
def __init__(self):
pass
def show_city_weather_forecast(self, __user__: dict = {}) -> HTMLResponse:
"""
Display an interactive weather forecast tool where users can select a city
and fetch real-time data from the free Open-Meteo API.
"""
# 我们在前端预定义城市坐标,避免使用复杂的地理编码 API
# Open-Meteo 需要经纬度
cities_config = {
"武汉": {"lat": 30.57, "lon": 114.30},
"北京": {"lat": 39.90, "lon": 116.40},
"上海": {"lat": 31.23, "lon": 121.47},
"广州": {"lat": 23.13, "lon": 113.26},
"深圳": {"lat": 22.54, "lon": 114.05},
"成都": {"lat": 30.57, "lon": 104.06},
"杭州": {"lat": 30.27, "lon": 120.15},
"西安": {"lat": 34.34, "lon": 108.94},
}
cities_json = json.dumps(cities_config, ensure_ascii=False)
html_content = f"""
<!DOCTYPE html>
<html>
<head>
<title>City Weather Forecast</title>
<meta charset="utf-8">
<script src="https://cdn.bootcdn.net/ajax/libs/Chart.js/3.9.1/chart.min.js"></script>
<style>
body {{ font-family: -apple-system, BlinkMacSystemFont, "Segoe UI", Roboto, sans-serif; padding: 10px; background-color: #ffffff; }}
.container {{ border: 1px solid #e5e7eb; padding: 15px; border-radius: 12px; box-shadow: 0 4px 6px -1px rgba(0, 0, 0, 0.1); }}
.header {{ text-align: center; margin-bottom: 20px; }}
.controls {{
display: flex; gap: 10px; justify-content: center; align-items: center;
background: #f3f4f6; padding: 12px; border-radius: 8px; margin-bottom: 20px;
}}
select {{
padding: 8px 12px; font-size: 16px; border-radius: 6px; border: 1px solid #d1d5db;
background-color: white; cursor: pointer; min-width: 150px;
}}
button {{
padding: 8px 16px; font-size: 14px; background-color: #3b82f6; color: white;
border: none; border-radius: 6px; cursor: pointer; transition: background 0.2s;
}}
button:hover {{ background-color: #2563eb; }}
.chart-container {{ position: relative; height: 320px; width: 100%; }}
.loading {{ color: #6b7280; font-size: 14px; margin-left: 10px; display: none; }}
</style>
</head>
<body>
<div class="container">
<div class="header">
<h3 style="margin:0; color:#1f2937;">🏙️ 城市未来7天预报</h3>
<p style="margin:5px 0 0 0; font-size:12px; color:#6b7280;">数据来源: Open-Meteo (Free)</p>
</div>
<div class="controls">
<label for="citySelect" style="font-weight:600; color:#374151;">选择城市:</label>
<select id="citySelect" onchange="fetchWeather()">
</select>
<span id="status" class="loading">加载中...</span>
</div>
<div class="chart-container">
<canvas id="weatherChart"></canvas>
</div>
</div>
<script>
// 1. 城市配置数据
const cities = {cities_json};
const select = document.getElementById('citySelect');
const statusSpan = document.getElementById('status');
let myChart = null;
// 2. 初始化下拉框
function initDropdown() {{
for (const [name, coords] of Object.entries(cities)) {{
const option = document.createElement('option');
option.value = name;
option.textContent = name;
select.appendChild(option);
}}
// 默认选中第一个
select.value = "武汉";
}}
// 3. 核心:调用 Open-Meteo API
async function fetchWeather() {{
const cityName = select.value;
const coords = cities[cityName];
statusSpan.style.display = 'inline';
statusSpan.textContent = `正在获取 ${{cityName}} 天气...`;
// Open-Meteo API URL (请求最高温、最低温)
const url = `https://api.open-meteo.com/v1/forecast?latitude=${{coords.lat}}&longitude=${{coords.lon}}&daily=temperature_2m_max,temperature_2m_min&timezone=auto`;
try {{
const response = await fetch(url);
if (!response.ok) throw new Error("API 请求失败");
const data = await response.json();
// 解析数据
const dates = data.daily.time;
const maxTemps = data.daily.temperature_2m_max;
const minTemps = data.daily.temperature_2m_min;
updateChart(cityName, dates, maxTemps, minTemps);
statusSpan.style.display = 'none';
}} catch (e) {{
console.error(e);
statusSpan.textContent = "❌ 获取失败,请检查网络";
statusSpan.style.color = "red";
}}
}}
// 4. 更新图表
function updateChart(city, dates, maxTemps, minTemps) {{
const ctx = document.getElementById('weatherChart').getContext('2d');
if (myChart) {{
myChart.destroy(); // 销毁旧图表以避免重叠
}}
myChart = new Chart(ctx, {{
type: 'line',
data: {{
labels: dates,
datasets: [
{{
label: '最高气温 (°C)',
data: maxTemps,
borderColor: '#ef4444', // 红色
backgroundColor: '#ef4444',
tension: 0.4
}},
{{
label: '最低气温 (°C)',
data: minTemps,
borderColor: '#3b82f6', // 蓝色
backgroundColor: '#3b82f6',
tension: 0.4
}}
]
}},
options: {{
responsive: true,
maintainAspectRatio: false,
plugins: {{
title: {{
display: true,
text: `${{city}} 未来一周气温趋势`
}},
tooltip: {{
mode: 'index',
intersect: false
}}
}},
interaction: {{
mode: 'nearest',
axis: 'x',
intersect: false
}}
}}
}});
}}
// 启动
initDropdown();
fetchWeather(); // 初始加载
</script>
</body>
</html>
"""
return HTMLResponse(
content=html_content, headers={"Content-Disposition": "inline"}
)
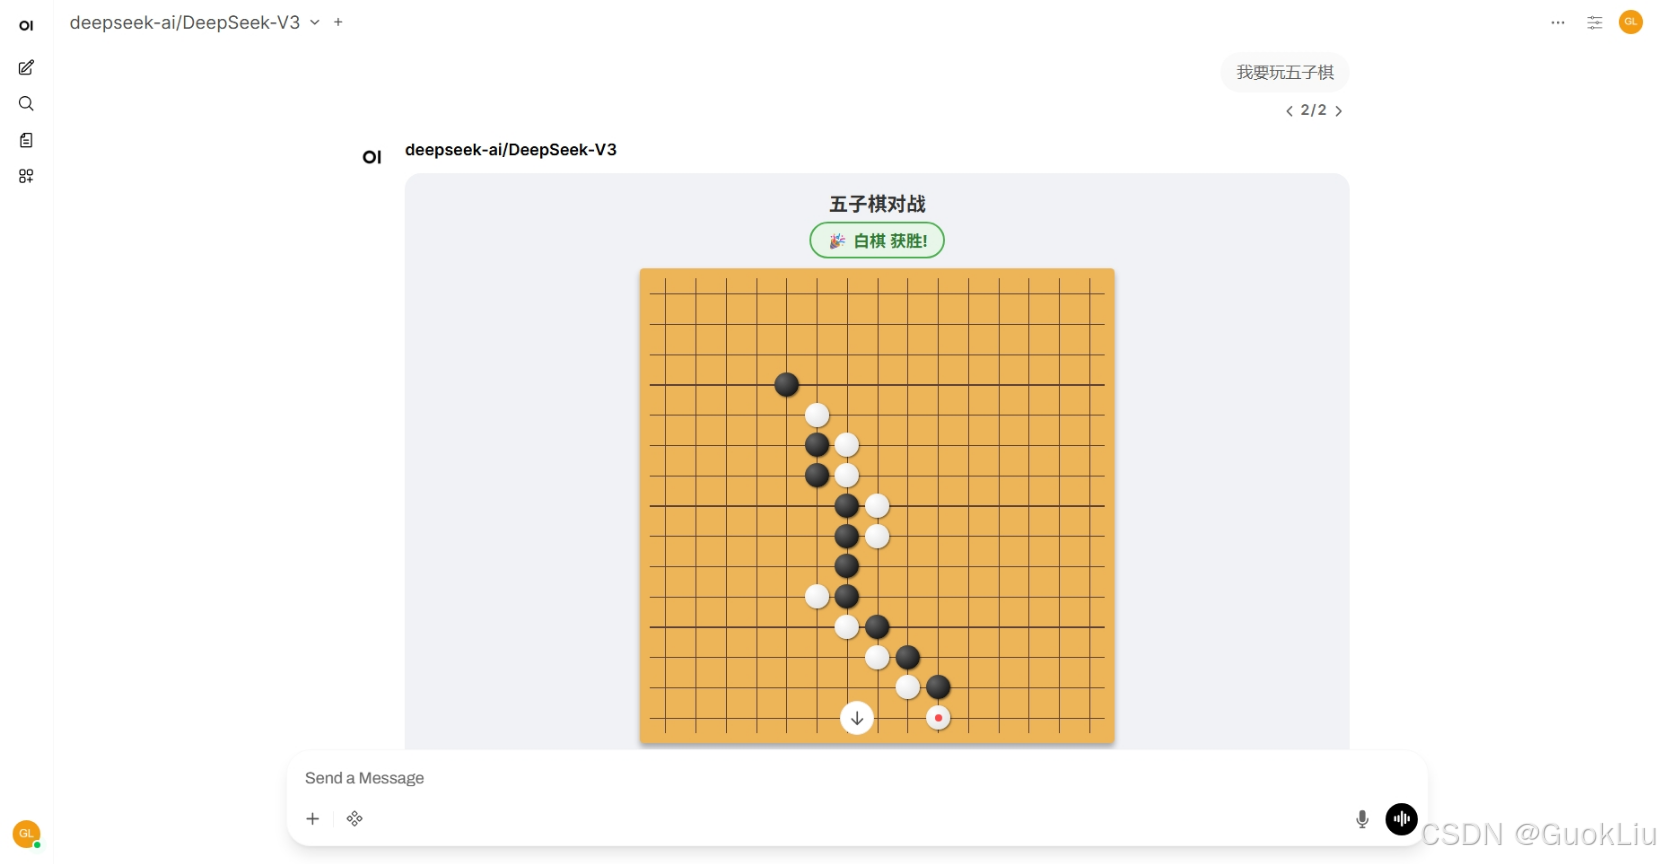
def play_gomoku(self, __user__: dict = {}) -> HTMLResponse:
"""
Launches an interactive Gomoku (Five-in-a-Row) game board in the chat.
"""
# HTML 包含了完整的 CSS 样式和 JS 游戏逻辑
html_content = """
<!DOCTYPE html>
<html lang="zh-CN">
<head>
<meta charset="UTF-8">
<meta name="viewport" content="width=device-width, initial-scale=1.0">
<title>五子棋 Gomoku</title>
<style>
body {
font-family: 'Segoe UI', Tahoma, Geneva, Verdana, sans-serif;
display: flex;
flex-direction: column;
align-items: center;
background-color: #f0f2f5;
margin: 0;
padding: 10px;
color: #333;
}
h2 { margin: 5px 0; font-size: 1.2rem; }
.status-bar {
margin-bottom: 10px;
display: flex;
gap: 15px;
align-items: center;
}
.indicator {
padding: 5px 15px;
border-radius: 20px;
font-weight: bold;
transition: all 0.3s;
}
.current-turn {
background-color: #e3f2fd;
border: 2px solid #2196f3;
color: #1565c0;
}
.winner {
background-color: #e8f5e9;
border: 2px solid #4caf50;
color: #2e7d32;
}
/* 棋盘样式 */
.board {
position: relative;
width: min(90vw, 450px);
height: min(90vw, 450px);
background-color: #eeb558; /* 木纹色 */
box-shadow: 0 4px 6px rgba(0,0,0,0.3);
display: grid;
grid-template-columns: repeat(15, 1fr);
grid-template-rows: repeat(15, 1fr);
padding: 10px;
border-radius: 4px;
}
/* 棋盘格线 */
.cell {
position: relative;
cursor: pointer;
}
/* 利用伪元素画十字线 */
.cell::before {
content: '';
position: absolute;
top: 50%; left: 0; right: 0;
height: 1px;
background: #5d4037;
z-index: 1;
}
.cell::after {
content: '';
position: absolute;
left: 50%; top: 0; bottom: 0;
width: 1px;
background: #5d4037;
z-index: 1;
}
/* 棋子样式 */
.stone {
width: 80%;
height: 80%;
border-radius: 50%;
position: absolute;
top: 10%;
left: 10%;
z-index: 2;
box-shadow: 1px 1px 2px rgba(0,0,0,0.5);
transform: scale(0);
animation: popIn 0.2s forwards;
}
@keyframes popIn {
to { transform: scale(1); }
}
.black {
background: radial-gradient(circle at 30% 30%, #666, #000);
}
.white {
background: radial-gradient(circle at 30% 30%, #fff, #ddd);
}
/* 最后落子标记 */
.last-move::after {
content: '';
position: absolute;
top: 50%; left: 50%;
transform: translate(-50%, -50%);
width: 30%; height: 30%;
background-color: red;
border-radius: 50%;
opacity: 0.7;
}
button {
margin-top: 15px;
padding: 8px 20px;
background-color: #2196f3;
color: white;
border: none;
border-radius: 4px;
cursor: pointer;
font-size: 1rem;
}
button:hover { background-color: #1976d2; }
</style>
</head>
<body>
<h2>五子棋对战</h2>
<div class="status-bar">
<div id="statusText" class="indicator current-turn">当前回合: 黑棋</div>
</div>
<div class="board" id="board">
</div>
<button onclick="resetGame()">重新开始</button>
<script>
const BOARD_SIZE = 15;
const boardEl = document.getElementById('board');
const statusEl = document.getElementById('statusText');
let currentPlayer = 'black'; // black or white
let gameActive = true;
let boardState = []; // 15x15 数组
let lastMove = null; // {r, c}
// 初始化游戏
function initGame() {
boardEl.innerHTML = '';
boardState = Array(BOARD_SIZE).fill(null).map(() => Array(BOARD_SIZE).fill(null));
currentPlayer = 'black';
gameActive = true;
lastMove = null;
updateStatus(`当前回合: 黑棋`);
statusEl.className = 'indicator current-turn';
// 生成网格
for (let r = 0; r < BOARD_SIZE; r++) {
for (let c = 0; c < BOARD_SIZE; c++) {
const cell = document.createElement('div');
cell.className = 'cell';
cell.dataset.r = r;
cell.dataset.c = c;
cell.onclick = () => handleMove(r, c);
boardEl.appendChild(cell);
}
}
}
// 处理落子
function handleMove(r, c) {
if (!gameActive || boardState[r][c]) return;
// 更新逻辑状态
boardState[r][c] = currentPlayer;
// 更新 UI
const index = r * BOARD_SIZE + c;
const cell = boardEl.children[index];
const stone = document.createElement('div');
stone.className = `stone ${currentPlayer}`;
// 标记最后一步
if (document.querySelector('.last-move')) {
document.querySelector('.last-move').classList.remove('last-move');
}
stone.classList.add('last-move');
cell.appendChild(stone);
// 检查胜利
if (checkWin(r, c, currentPlayer)) {
gameActive = false;
const winnerText = currentPlayer === 'black' ? '黑棋' : '白棋';
updateStatus(`🎉 ${winnerText} 获胜!`);
statusEl.className = 'indicator winner';
return;
}
// 切换玩家
currentPlayer = currentPlayer === 'black' ? 'white' : 'black';
const nextText = currentPlayer === 'black' ? '黑棋' : '白棋';
updateStatus(`当前回合: ${nextText}`);
}
// 更新状态栏文字
function updateStatus(msg) {
statusEl.textContent = msg;
}
// 核心算法:检查胜利
function checkWin(r, c, player) {
const directions = [
[[0, 1], [0, -1]], // 水平
[[1, 0], [-1, 0]], // 垂直
[[1, 1], [-1, -1]], // 对角 \
[[1, -1], [-1, 1]] // 对角 /
];
for (let axis of directions) {
let count = 1; // 当前这颗子算1个
for (let dir of axis) {
let dr = dir[0];
let dc = dir[1];
let nr = r + dr;
let nc = c + dc;
while (
nr >= 0 && nr < BOARD_SIZE &&
nc >= 0 && nc < BOARD_SIZE &&
boardState[nr][nc] === player
) {
count++;
nr += dr;
nc += dc;
}
}
if (count >= 5) return true;
}
return false;
}
function resetGame() {
initGame();
}
// 启动
initGame();
</script>
</body>
</html>
"""
# 关键头信息,确保作为 UI 渲染
return HTMLResponse(
content=html_content, headers={"Content-Disposition": "inline"}
)