核心代码
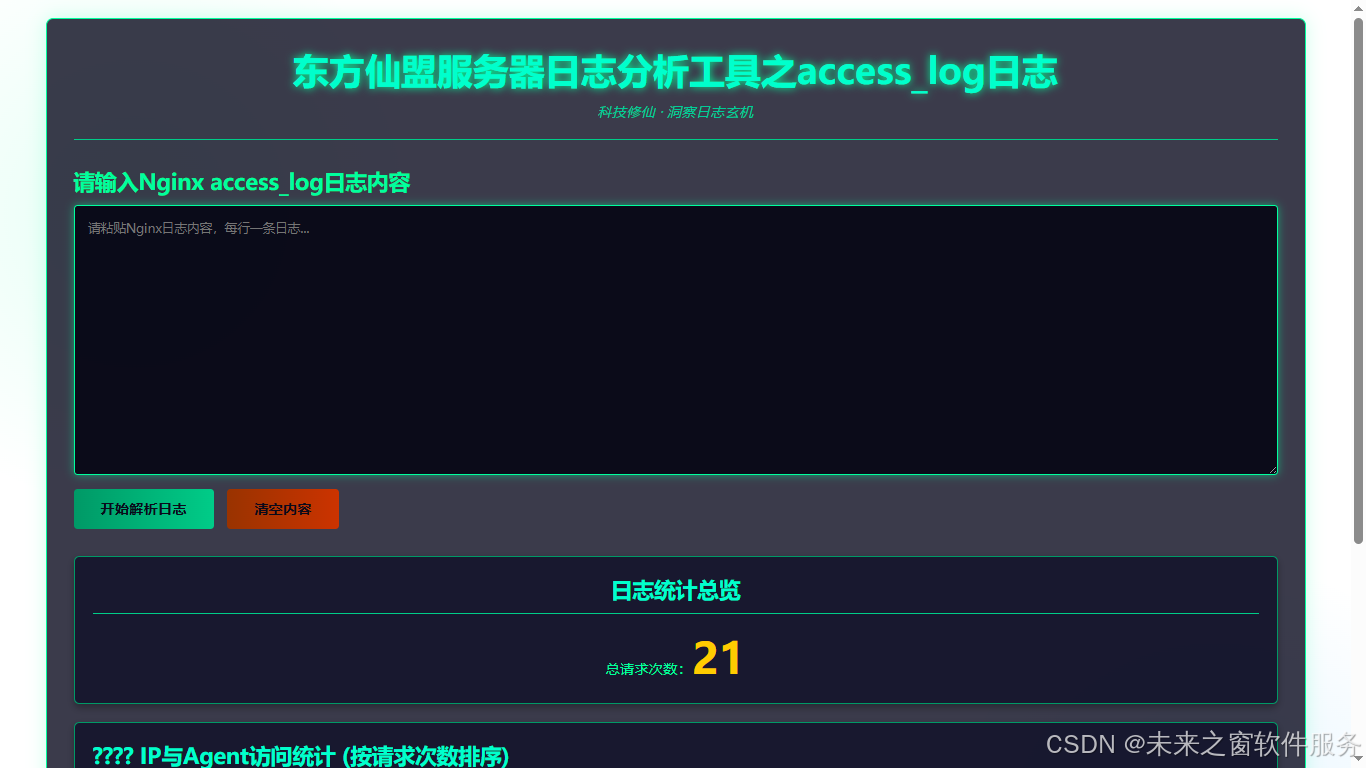
东方仙盟 Nginx access_log 日志分析工具使用说明
一、Nginx access_log 日志分析的核心价值
Nginx 的 access_log 日志记录了服务器接收到的每一次 HTTP 请求详情,对其进行专业分析,能为服务器运维、业务优化、安全防护提供关键支撑,具体作用体现在:
1. 运维监控,掌握服务运行状态
- 统计总请求量:直观了解服务器的访问压力,判断是否存在流量峰值或异常低访问的情况;
- 识别高频访问 IP:定位核心用户来源,或发现单 IP 高频请求的异常行为(如疑似爬虫、恶意请求)。
2. 客户端分析,优化访问体验
- 识别访问终端类型(Chrome/Firefox 浏览器、微信客户端、移动设备等):针对性优化不同终端的页面适配;
- 发现特殊客户端(如示例中的 CyberWin 专用浏览器):为专属用户群体定制访问策略。
3. 安全防护,排查异常访问
- 快速定位异常 IP 的访问特征:结合 Agent 信息判断是正常用户访问还是恶意扫描;
- 无需复杂操作,通过日志解析即可初步筛查风险请求,降低服务器被攻击的概率。
二、网页版分析工具的核心优势(无需安装,全员可用)
传统的 Nginx 日志分析需要在服务器安装专用软件、配置命令行工具,或依赖专业运维人员操作,而本网页版工具彻底解决这些痛点:
1. 零安装成本,跨设备使用
- 无需在服务器 / 本地电脑安装任何软件、插件或依赖包,打开浏览器即可使用;
- 兼容 Windows、Mac、Linux 等所有系统,手机、平板等移动设备也能便捷操作,团队成员无需适配不同环境。
2. 零服务器风险,安全可靠
- 无需在服务器上部署未知来源的分析工具,避免因第三方软件引入安全漏洞、占用服务器资源;
- 日志数据仅在本地浏览器解析处理,不上传至任何服务器,保障业务数据隐私。
3. 操作简单,全员可上手
- 无需掌握 Linux 命令(如 grep、awk、sed)或专业分析语法,只需:
- 复制 Nginx access_log 日志内容;
- 粘贴到工具的文本框中;
- 点击 "开始解析日志",自动生成统计结果;
- 结果以可视化表格呈现,IP、客户端类型、请求次数清晰分类,非技术人员也能看懂。
4. 轻量化高效,适配不同日志规模
- 支持自定义日志内容粘贴,每行一条日志,解析速度快;
- 自动截断过长的 Agent 信息,保持界面整洁,同时完整保留核心分析维度。
代码
<!DOCTYPE html>
<html lang="zh-CN">
<head>
<meta charset="UTF-8">
<meta name="viewport" content="width=device-width, initial-scale=1.0">
<title>东方仙盟服务器日志分析工具之access_log日志</title>
<style>
/* 科技修仙风格样式 */
* {
margin: 0;
padding: 0;
box-sizing: border-box;
font-family: "Microsoft Yahei", monospace;
}
body {
background: linear-gradient(135deg, #0a0a1a, #1a1a3a);
color: #00ff9d;
min-height: 100vh;
padding: 20px;
background-image:
radial-gradient(circle at 10% 20%, rgba(0, 255, 157, 0.1) 0%, transparent 20%),
radial-gradient(circle at 90% 80%, rgba(0, 157, 255, 0.1) 0%, transparent 20%);
}
.container {
max-width: 1400px;
margin: 0 auto;
background: rgba(10, 10, 30, 0.8);
border: 1px solid #00ff9d;
border-radius: 8px;
padding: 30px;
box-shadow: 0 0 20px rgba(0, 255, 157, 0.2);
}
.header {
text-align: center;
margin-bottom: 30px;
border-bottom: 2px solid #00cc88;
padding-bottom: 20px;
}
h1 {
font-size: 2.5rem;
text-shadow: 0 0 10px #00ff9d;
margin-bottom: 10px;
color: #00ffcc;
}
.subtitle {
color: #00cc99;
font-style: italic;
}
.log-input {
margin-bottom: 30px;
}
textarea {
width: 100%;
height: 300px;
background: rgba(5, 5, 20, 0.9);
border: 1px solid #00cc88;
color: #00ff9d;
padding: 15px;
font-size: 14px;
resize: vertical;
border-radius: 4px;
margin-bottom: 15px;
outline: none;
transition: all 0.3s;
}
textarea:focus {
box-shadow: 0 0 10px rgba(0, 255, 157, 0.5);
border-color: #00ff9d;
}
button {
background: linear-gradient(to right, #009966, #00cc88);
color: #0a0a1a;
border: none;
padding: 12px 30px;
font-size: 16px;
font-weight: bold;
border-radius: 4px;
cursor: pointer;
transition: all 0.3s;
margin-right: 10px;
}
button:hover {
background: linear-gradient(to right, #00cc88, #00ff9d);
box-shadow: 0 0 10px rgba(0, 255, 157, 0.5);
transform: translateY(-2px);
}
.results {
display: flex;
flex-direction: column;
gap: 20px;
margin-top: 30px;
}
.stat-card {
background: rgba(15, 15, 40, 0.8);
border: 1px solid #009966;
border-radius: 6px;
padding: 20px;
box-shadow: 0 4px 8px rgba(0, 0, 0, 0.3);
width: 100%;
}
.stat-card h2 {
color: #00ffcc;
margin-bottom: 15px;
padding-bottom: 10px;
border-bottom: 1px solid #00cc88;
}
.total-requests-card {
text-align: center;
}
.total-requests {
font-size: 3rem;
font-weight: bold;
color: #ffcc00;
margin: 10px 0;
}
table {
width: 100%;
border-collapse: collapse;
margin-top: 15px;
}
th, td {
padding: 12px 15px;
text-align: left;
border-bottom: 1px solid #006644;
}
th {
background: rgba(0, 153, 102, 0.2);
color: #00ffcc;
font-size: 16px;
}
tr:hover {
background: rgba(0, 153, 102, 0.1);
}
.ip-column {
width: 18%;
}
.agent-column {
width: 82%;
}
.count-column {
text-align: center;
color: #ff6600;
font-weight: bold;
}
.clear-btn {
background: linear-gradient(to right, #993300, #cc3300);
}
.clear-btn:hover {
background: linear-gradient(to right, #cc3300, #ff3300);
}
.ip-agent-table {
width: 100%;
}
@media (max-width: 768px) {
h1 {
font-size: 1.8rem;
}
.total-requests {
font-size: 2rem;
}
th, td {
padding: 8px 10px;
font-size: 14px;
}
.ip-column {
width: 25%;
}
.agent-column {
width: 75%;
}
}
</style>
</head>
<body>
<div class="container">
<div class="header">
<h1>东方仙盟服务器日志分析工具之access_log日志</h1>
<p class="subtitle">科技修仙 · 洞察日志玄机</p>
</div>
<div class="log-input">
<h2 style="margin-bottom: 10px;"> 请输入Nginx access_log日志内容</h2>
<textarea id="logInput" placeholder="请粘贴Nginx日志内容,每行一条日志...">wlzc/hellow.c" "Mozilla/5.0 (Windows NT 6.1; WOW64) AppleWebKit/537.36 (KHTML, like Gecko) Chrome/60.0.4240.198 Safari/537.36 CyberWin WebBrowser/3.2023"
183.225.231.241 - - [10/Feb/2026:14:33:30 +0800] "POST /wlzc/hellow.c HTTP/2.0" 200 267 "wlzc/hellow.c" "Mozilla/5.0 (Windows NT 6.1; WOW64) AppleWebKit/537.36 (KHTML, like Gecko) </textarea>
<button id="analyzeBtn"> 开始解析日志</button>
<button id="clearBtn" class="clear-btn">清空内容</button>
</div>
<div class="results">
<!-- 总请求数卡片 -->
<div class="stat-card total-requests-card">
<h2> 日志统计总览</h2>
<p>总请求次数:<span id="totalRequests" class="total-requests">0</span></p>
</div>
<!-- IP和Agent分析卡片 -->
<div class="stat-card">
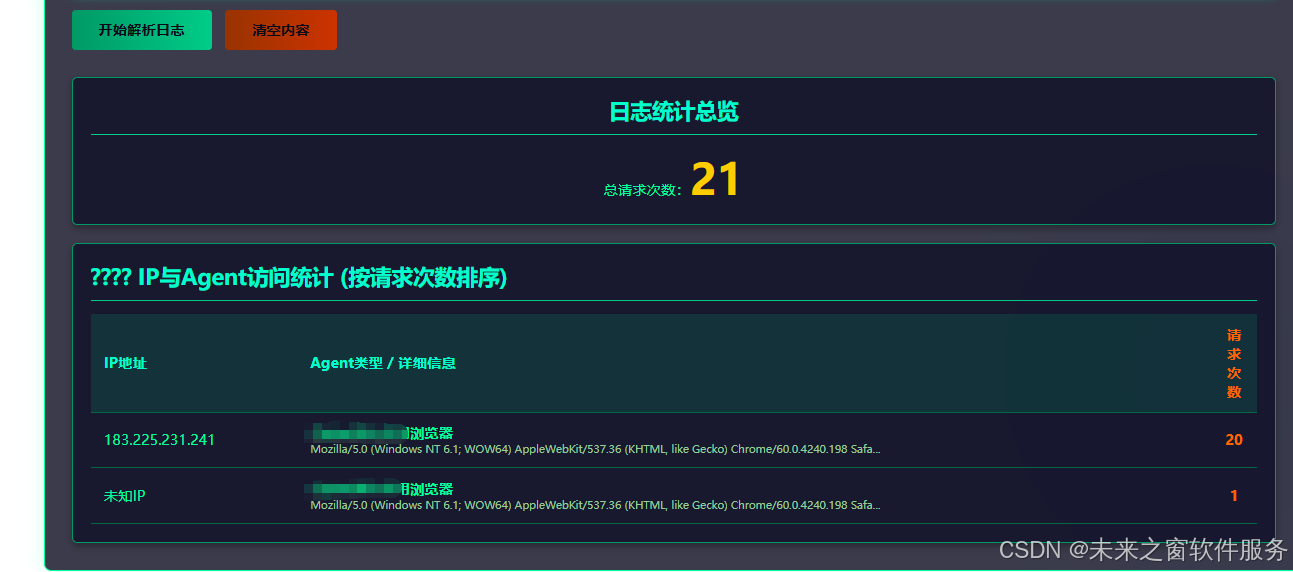
<h2>🌐 IP与Agent访问统计 (按请求次数排序)</h2>
<table class="ip-agent-table">
<thead>
<tr>
<th class="ip-column">IP地址</th>
<th class="agent-column">Agent类型 / 详细信息</th>
<th class="count-column">请求次数</th>
</tr>
</thead>
<tbody id="ipAgentBody">
<tr>
<td colspan="3" style="text-align: center; color: #999;">请点击解析按钮查看数据</td>
</tr>
</tbody>
</table>
</div>
</div>
</div>
<script>
// 获取DOM元素
const logInput = document.getElementById('logInput');
const analyzeBtn = document.getElementById('analyzeBtn');
const clearBtn = document.getElementById('clearBtn');
const totalRequests = document.getElementById('totalRequests');
const ipAgentBody = document.getElementById('ipAgentBody');
// 解析标准Nginx access_log日志的函数
function parseNginxAccessLog(logLine) {
// 去除首尾空格
logLine = logLine.trim();
if (!logLine) return null;
try {
// 1. 提取IP地址 (标准access_log格式:开头到第一个空格)
const ipMatch = logLine.match(/^(\d+\.\d+\.\d+\.\d+)/);
const ip = ipMatch ? ipMatch[1] : '未知IP';
// 2. 提取User Agent (最后一个双引号内的内容)
// 匹配模式:最后一个 "..." 中的内容
const agentMatches = logLine.match(/"([^"]*)"$/);
let userAgent = '未知Agent';
let agentType = '未知类型';
if (agentMatches && agentMatches[1]) {
userAgent = agentMatches[1];
// 智能识别Agent类型
if (userAgent.includes('sdd')) {
agentType = ' 专用浏览器';
} else if (userAgent.includes('MicroMessenger') || userAgent.includes('WeChat')) {
agentType = '微信客户端';
} else if (userAgent.includes('Mobile')) {
agentType = '移动浏览器';
} else if (userAgent.includes('Chrome')) {
agentType = 'Chrome浏览器';
} else if (userAgent.includes('Firefox')) {
agentType = 'Firefox浏览器';
} else if (userAgent.includes('Safari')) {
agentType = 'Safari浏览器';
} else if (userAgent.includes('Windows NT')) {
agentType = 'Windows桌面浏览器';
} else {
agentType = '其他客户端';
}
}
return {
ip: ip,
userAgent: userAgent,
agentType: agentType
};
} catch (error) {
console.error('解析日志失败:', error, logLine);
return null;
}
}
// 分析日志的主函数
function analyzeLogs() {
// 清空之前的结果
ipAgentBody.innerHTML = '';
// 获取日志内容并按行分割
const logContent = logInput.value;
const logLines = logContent.split('\n').filter(line => line.trim() !== '');
// 更新总请求次数
totalRequests.textContent = logLines.length;
// 如果没有日志内容
if (logLines.length === 0) {
ipAgentBody.innerHTML = `
<tr>
<td colspan="3" style="text-align: center; color: #999;">暂无日志数据</td>
</tr>
`;
return;
}
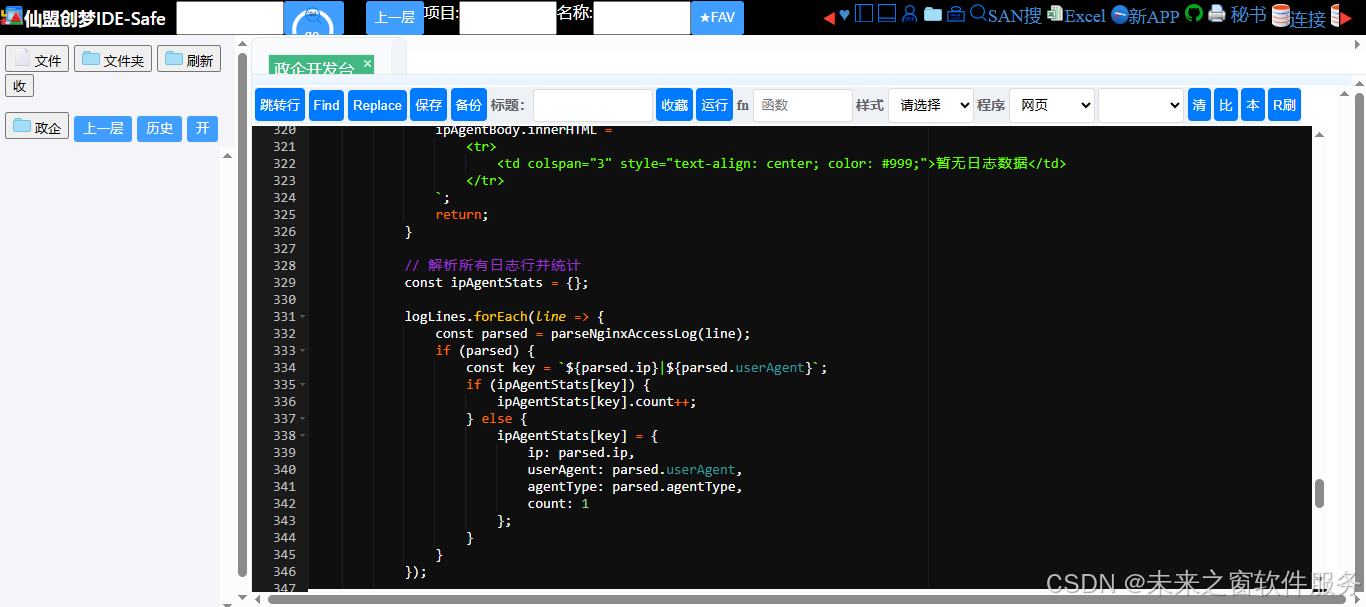
// 解析所有日志行并统计
const ipAgentStats = {};
logLines.forEach(line => {
const parsed = parseNginxAccessLog(line);
if (parsed) {
const key = `${parsed.ip}|${parsed.userAgent}`;
if (ipAgentStats[key]) {
ipAgentStats[key].count++;
} else {
ipAgentStats[key] = {
ip: parsed.ip,
userAgent: parsed.userAgent,
agentType: parsed.agentType,
count: 1
};
}
}
});
// 如果解析失败
if (Object.keys(ipAgentStats).length === 0) {
ipAgentBody.innerHTML = `
<tr>
<td colspan="3" style="text-align: center; color: #ff6600;">日志解析失败,请检查格式</td>
</tr>
`;
return;
}
// 转换为数组并按请求次数从大到小排序
const statsArray = Object.values(ipAgentStats);
statsArray.sort((a, b) => b.count - a.count);
// 生成表格内容
let tableHtml = '';
statsArray.forEach(stat => {
// 截断过长的Agent信息,保持表格整洁
let displayAgent = stat.userAgent;
if (displayAgent.length > 100) {
displayAgent = displayAgent.substring(0, 100) + '...';
}
tableHtml += `
<tr>
<td>${stat.ip}</td>
<td>
<strong>${stat.agentType}</strong><br>
<span style="color: #99cc99; font-size: 12px;">${displayAgent}</span>
</td>
<td class="count-column">${stat.count}</td>
</tr>
`;
});
ipAgentBody.innerHTML = tableHtml;
}
// 清空内容
function clearContent() {
logInput.value = '';
totalRequests.textContent = '0';
ipAgentBody.innerHTML = `
<tr>
<td colspan="3" style="text-align: center; color: #999;">请点击解析按钮查看数据</td>
</tr>
`;
}
// 绑定事件
analyzeBtn.addEventListener('click', analyzeLogs);
clearBtn.addEventListener('click', clearContent);
// 页面加载完成后自动解析示例数据
window.addEventListener('load', analyzeLogs);
</script>
</body>
</html>三、工具使用步骤(3 步完成分析)
- 复制日志 :从 Nginx 服务器的 access_log 文件中复制需要分析的日志内容(默认路径通常为
/var/log/nginx/access.log); - 粘贴解析:将日志粘贴到工具的文本框,点击 "开始解析日志" 按钮;
- 查看结果 :
- 顶部 "日志统计总览" 显示总请求次数;
- 下方表格按请求次数排序展示 IP、Agent 类型、请求次数,鼠标悬停行可高亮查看详情。
如需清空内容重新分析,点击 "清空内容" 按钮即可一键重置,操作无门槛。
四、适配场景
- 运维人员:快速排查服务器访问异常,日常监控服务状态;
- 开发人员:分析客户端访问特征,优化代码适配不同终端;
- 团队管理者:无需依赖技术人员,自主查看服务器访问数据,掌握业务访问情况;
- 小型团队 / 个人站长:无专业运维资源时,低成本实现日志分析,保障服务稳定。
总结
- Nginx access_log 分析是掌握服务器访问状态、优化体验、排查安全风险的核心手段;
- 网页版工具无需安装任何软件,避免服务器部署风险,全员可便捷使用;
- 操作仅需 "复制 - 粘贴 - 解析" 三步,结果可视化,适配各类使用场景和人群。
该工具以 "科技修仙" 轻量化设计,兼顾专业性与易用性,让 Nginx 日志分析从 "运维专属" 变为 "全员可用",大幅降低日志分析的门槛和成本。
阿雪技术观
在科技发展浪潮中,我们不妨积极投身技术共享。不满足于做受益者,更要主动担当贡献者。无论是分享代码、撰写技术博客,还是参与开源项目维护改进,每一个微小举动都可能蕴含推动技术进步的巨大能量。东方仙盟是汇聚力量的天地,我们携手在此探索硅基生命,为科技进步添砖加瓦。
Hey folks, in this wild tech - driven world, why not dive headfirst into the whole tech - sharing scene? Don't just be the one reaping all the benefits; step up and be a contributor too. Whether you're tossing out your code snippets, hammering out some tech blogs, or getting your hands dirty with maintaining and sprucing up open - source projects, every little thing you do might just end up being a massive force that pushes tech forward. And guess what? The Eastern FairyAlliance is this awesome place where we all come together. We're gonna team up