nginx日志分析
核心代码
东方仙盟 Nginx 日志分析工具使用说明
一、Nginx 日志分析的核心价值(聚焦危险快速定位)
Nginx 作为服务器的核心入口,其日志记录了所有运行异常、连接错误、配置问题等关键信息,对其进行专业分析,是秒级定位 Nginx 运行风险、筑牢服务器服务防线的核心手段,具体价值体现在:
1. 秒级锁定异常根源,精准定位危险
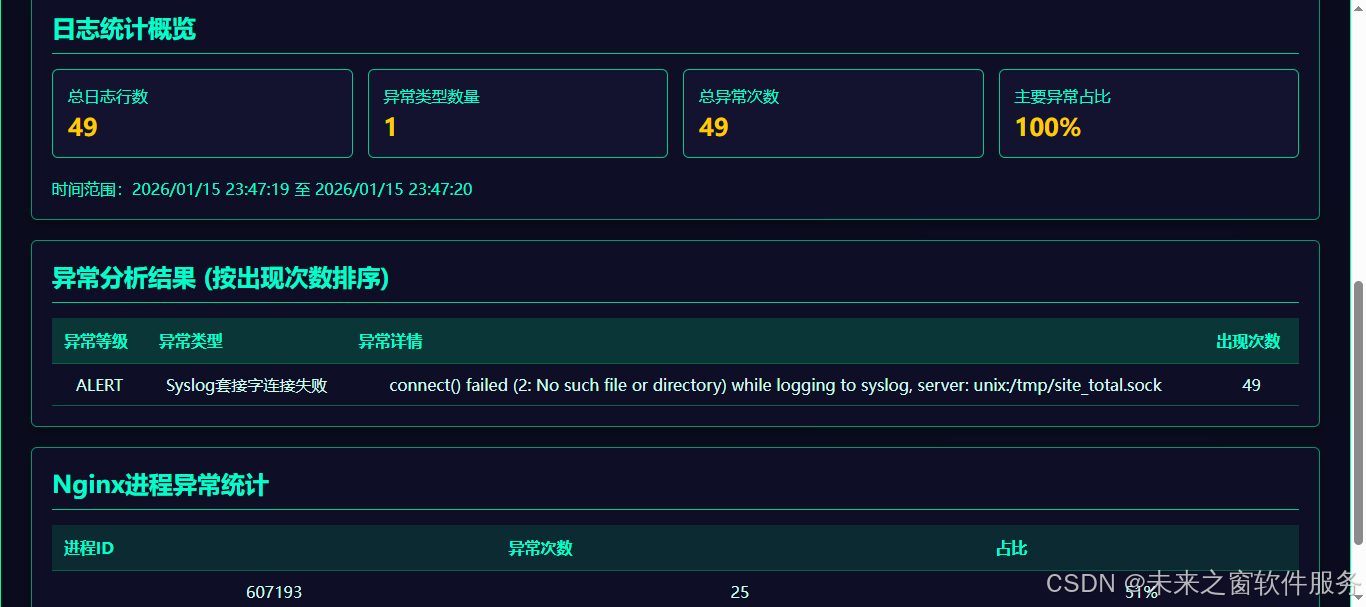
- 按异常次数排序展示核心问题:无需逐行翻阅海量日志,直接定位 "出现频次最高" 的 Nginx 异常(如 Syslog 套接字连接失败、权限不足、配置错误等),1 分钟内锁定导致服务不稳定的核心危险点;
- 异常等级自动标记:根据日志中的 alert/error/warning/info 等级,区分 "高危(alert)/ 中危(error)/ 低危(warning)" 异常,优先处理可能导致服务崩溃的高危问题,避免风险扩大。
2. 精准识别异常类型,针对性修复
- 自动分类异常行为:清晰区分 "Syslog 套接字连接失败、网络连接失败、权限不足、配置文件错误" 等类型,精准判断 Nginx 运行故障的本质原因;
- 进程维度定位问题:统计各 Nginx 进程的异常次数及占比,快速识别 "某进程持续报异常" 的情况,判断是单进程故障还是全局服务问题,避免盲目重启整个 Nginx 服务。
3. 量化异常态势,掌握服务健康度
- 多维度统计异常数据:总日志行数、异常类型数量、总异常次数、主要异常占比等核心指标一目了然,快速判断 Nginx 是否正遭受大规模异常冲击;
- 时间范围精准锁定:自动提取异常发生的时间区间,判断异常是 "突发式爆发" 还是 "持续性存在",为故障溯源提供精准时间线索。
4. 提前发现服务崩溃前兆,避免业务中断
- 识别 "高频重复异常":如示例中 "Syslog 套接字连接失败" 高频出现,提前预判日志收集功能故障,及时修复套接字配置,避免因日志堆积导致磁盘占满、服务崩溃;
- 发现隐性配置问题:从 "权限不足、文件不存在" 等低频次异常中,识别 Nginx 配置的隐性漏洞,提前优化权限、路径配置,防止问题扩大。
二、网页版 Nginx 日志分析工具的核心优势(零安装,危险定位快人一步)
传统的 Nginx 日志分析需要登录服务器、使用grep/awk/sed等命令行工具筛选异常,且难以快速关联 "异常类型 - 进程 - 时间" 多维度信息,而本网页版工具彻底解决这些痛点,核心优势聚焦 "快速定位危险":
1. 零安装成本,随时随地排查 Nginx 风险
- 无需在服务器 / 本地安装任何软件、插件,打开浏览器即可使用,跨 Windows/Mac/Linux/ 移动端全兼容;
- 无需在服务器部署分析工具,避免因安装第三方软件占用 Nginx 资源,同时降低引入新漏洞的风险。
2. 智能解析,危险信息结构化呈现
- 自动提取核心安全信息:从杂乱的 Nginx 日志中,精准解析出 "异常等级、异常类型、异常详情、进程 ID、时间范围",无需人工整理字段;
- 一键生成分析报告:点击 "开始分析日志",自动完成异常统计、进程分析、占比计算,无需编写任何筛选命令,新手也能快速上手。
3. 操作极简,非专业人员也能定位危险
- 无需掌握 Linux 命令或 Nginx 专业知识,3 步完成危险排查:
- 复制服务器 Nginx 日志内容(默认路径
/var/log/nginx/error.log); - 粘贴到工具文本框,点击 "开始分析日志";
- 查看异常分析结果和进程统计,直接定位需要修复的异常类型、故障进程。
- 复制服务器 Nginx 日志内容(默认路径
4. 数据本地解析,安全无泄露
- 日志仅在本地浏览器解析,不上传至任何服务器,保障 Nginx 日志中的进程 ID、服务器路径等敏感信息不泄露;
- 支持 Ctrl+Enter 快速分析、一键清空内容,操作灵活且避免敏感数据留存。
完整代码
<!DOCTYPE html>
<html lang="zh-CN">
<head>
<meta charset="UTF-8">
<meta name="viewport" content="width=device-width, initial-scale=1.0">
<title>东方仙盟服务器日志分析工具之nginx日志</title>
<style>
/* 科技修仙风格样式 */
* {
margin: 0;
padding: 0;
box-sizing: border-box;
font-family: "Microsoft Yahei", monospace;
}
body {
background: linear-gradient(135deg, #0a0a1a, #1a1a3a);
color: #00ff9d;
min-height: 100vh;
padding: 20px;
background-image:
radial-gradient(circle at 10% 20%, rgba(0, 255, 157, 0.1) 0%, transparent 20%),
radial-gradient(circle at 90% 80%, rgba(0, 157, 255, 0.1) 0%, transparent 20%);
}
.container {
max-width: 1400px;
margin: 0 auto;
background: rgba(10, 10, 30, 0.8);
border: 1px solid #00ff9d;
border-radius: 8px;
padding: 30px;
box-shadow: 0 0 20px rgba(0, 255, 157, 0.2);
}
.header {
text-align: center;
margin-bottom: 30px;
border-bottom: 2px solid #00cc88;
padding-bottom: 20px;
}
h1 {
font-size: 2.5rem;
text-shadow: 0 0 10px #00ff9d;
margin-bottom: 10px;
color: #00ffcc;
}
.subtitle {
color: #00cc99;
font-style: italic;
}
.log-input {
margin-bottom: 30px;
}
textarea {
width: 100%;
height: 400px;
background: rgba(5, 5, 20, 0.9);
border: 1px solid #00cc88;
color: #00ff9d;
padding: 15px;
font-size: 14px;
resize: vertical;
border-radius: 4px;
margin-bottom: 15px;
outline: none;
transition: all 0.3s;
}
textarea:focus {
box-shadow: 0 0 10px rgba(0, 255, 157, 0.5);
border-color: #00ff9d;
}
button {
background: linear-gradient(to right, #009966, #00cc88);
color: #0a0a1a;
border: none;
padding: 12px 30px;
font-size: 16px;
font-weight: bold;
border-radius: 4px;
cursor: pointer;
transition: all 0.3s;
margin-right: 10px;
}
button:hover {
background: linear-gradient(to right, #00cc88, #00ff9d);
box-shadow: 0 0 10px rgba(0, 255, 157, 0.5);
transform: translateY(-2px);
}
.results {
display: grid;
grid-template-columns: 1fr;
gap: 20px;
margin-top: 30px;
}
.stat-card {
background: rgba(15, 15, 40, 0.8);
border: 1px solid #009966;
border-radius: 6px;
padding: 20px;
box-shadow: 0 4px 8px rgba(0, 0, 0, 0.3);
}
.stat-card h2 {
color: #00ffcc;
margin-bottom: 15px;
padding-bottom: 10px;
border-bottom: 1px solid #00cc88;
}
.stats-grid {
display: grid;
grid-template-columns: repeat(auto-fit, minmax(200px, 1fr));
gap: 15px;
margin-bottom: 20px;
}
.stat-item {
background: rgba(20, 20, 50, 0.8);
padding: 15px;
border-radius: 6px;
border: 1px solid #00cc88;
text-align: center;
}
.stat-value {
font-size: 2rem;
color: #ffcc00;
font-weight: bold;
margin: 10px 0;
}
.stat-label {
color: #00cc99;
font-size: 14px;
}
table {
width: 100%;
border-collapse: collapse;
margin-top: 15px;
}
th, td {
padding: 12px 15px;
text-align: left;
border-bottom: 1px solid #006644;
}
th {
background: rgba(0, 153, 102, 0.2);
color: #00ffcc;
}
tr:hover {
background: rgba(0, 153, 102, 0.1);
}
.error-count {
color: #ff6600;
font-weight: bold;
text-align: center;
font-size: 1.2rem;
}
.error-type {
color: #ff9900;
font-weight: bold;
}
.error-level {
display: inline-block;
padding: 4px 8px;
border-radius: 4px;
font-size: 12px;
font-weight: bold;
margin-right: 8px;
}
.level-alert {
background: #ff4444;
color: #000;
}
.level-error {
background: #ff8800;
color: #000;
}
.level-warning {
background: #ffcc00;
color: #000;
}
.level-info {
background: #00cc66;
color: #000;
}
.clear-btn {
background: linear-gradient(to right, #993300, #cc3300);
}
.clear-btn:hover {
background: linear-gradient(to right, #cc3300, #ff3300);
}
.error-details {
max-width: 100%;
word-wrap: break-word;
color: #00ff9d;
}
.time-range {
font-style: italic;
color: #00cc99;
}
@media (max-width: 768px) {
h1 {
font-size: 1.8rem;
}
th, td {
padding: 8px 10px;
font-size: 14px;
}
.stat-value {
font-size: 1.5rem;
}
textarea {
height: 300px;
}
}
@media (max-width: 480px) {
.stats-grid {
grid-template-columns: 1fr;
}
th:nth-child(3), td:nth-child(3) {
word-break: break-all;
}
}
</style>
</head>
<body>
<div class="container">
<div class="header">
<h1>东方仙盟服务器日志分析工具之nginx日志</h1>
<p class="subtitle">科技修仙 · 洞察Nginx异常玄机</p>
</div>
<div class="log-input">
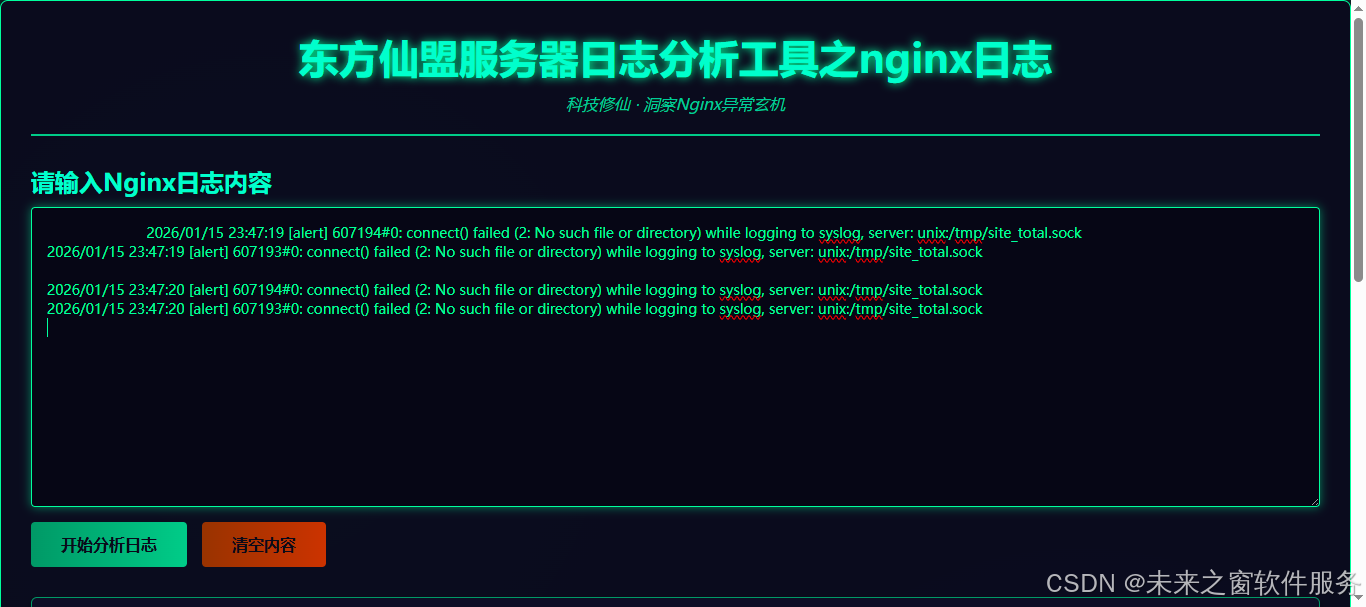
<h2 style="margin-bottom: 10px;">📜 请输入Nginx日志内容</h2>
<textarea id="logInput" placeholder="请粘贴Nginx日志内容,每行一条日志...">2026/01/15 23:47:19 [alert] 607194#0: connect() failed (2: No such file or directory) while logging to syslog, server: unix:/tmp/site_total.sock
2026/01/15 23:47:19 [alert] 607193#0: connect() failed (2: No such file or directory) while logging to syslog, server: unix:/tmp/site_total.sock
2026/01/15 23:47:19 [alert] 607194#0: connect() failed (2: No such file or directory) while logging to syslog, server: unix:/tmp/site_total.sock
2026/01/15 23:47:19 [alert] 607193#0: connect() failed (2: No such file or directory) while logging to syslog, server: unix:/tmp/site_total.sock
2026/01/15 23:47:19 [alert] 607194#0: connect() failed (2: No such file or directory) while logging to syslog, server: unix:/tmp/site_total.sock
2026/01/15 23:47:19 [alert] 607193#0: connect() failed (2: No such file or directory) while logging to syslog, server: unix:/tmp/site_total.sock
2026/01/15 23:47:19 [alert] 607194#0: connect() failed (2: No such file or directory) while logging to syslog, server: unix:/tmp/site_total.sock
2026/01/15 23:47:19 [alert] 607193#0: connect() failed (2: No such file or directory) while logging to syslog, server: unix:/tmp/site_total.sock
2026/01/15 23:47:19 [alert] 607194#0: connect() failed (2: No such file or directory) while logging to syslog, server: unix:/tmp/site_total.sock
2026/01/15 23:47:19 [alert] 607193#0: connect() failed (2: No such file or directory) while logging to syslog, server: unix:/tmp/site_total.sock
2026/01/15 23:47:19 [alert] 607194#0: connect() failed (2: No such file or directory) while logging to syslog, server: unix:/tmp/site_total.sock
2026/01/15 23:47:19 [alert] 607193#0: connect() failed (2: No such file or directory) while logging to syslog, server: unix:/tmp/site_total.sock
2026/01/15 23:47:19 [alert] 607194#0: connect() failed (2: No such file or directory) while logging to syslog, server: unix:/tmp/site_total.sock
2026/01/15 23:47:19 [alert] 607193#0: connect() failed (2: No such file or directory) while logging to syslog, server: unix:/tmp/site_total.sock
2026/01/15 23:47:19 [alert] 607194#0: connect() failed (2: No such file or directory) while logging to syslog, server: unix:/tmp/site_total.sock
2026/01/15 23:47:19 [alert] 607193#0: connect() failed (2: No such file or directory) while logging to syslog, server: unix:/tmp/site_total.sock
2026/01/15 23:47:20 [alert] 607194#0: connect() failed (2: No such file or directory) while logging to syslog, server: unix:/tmp/site_total.sock
2026/01/15 23:47:20 [alert] 607193#0: connect() failed (2: No such file or directory) while logging to syslog, server: unix:/tmp/site_total.sock
2026/01/15 23:47:20 [alert] 607194#0: connect() failed (2: No such file or directory) while logging to syslog, server: unix:/tmp/site_total.sock
2026/01/15 23:47:20 [alert] 607193#0: connect() failed (2: No such file or directory) while logging to syslog, server: unix:/tmp/site_total.sock
2026/01/15 23:47:20 [alert] 607194#0: connect() failed (2: No such file or directory) while logging to syslog, server: unix:/tmp/site_total.sock
2026/01/15 23:47:20 [alert] 607193#0: connect() failed (2: No such file or directory) while logging to syslog, server: unix:/tmp/site_total.sock
2026/01/15 23:47:20 [alert] 607193#0: connect() failed (2: No such file or directory) while logging to syslog, server: unix:/tmp/site_total.sock
2026/01/15 23:47:20 [alert] 607194#0: connect() failed (2: No such file or directory) while logging to syslog, server: unix:/tmp/site_total.sock
2026/01/15 23:47:20 [alert] 607194#0: connect() failed (2: No such file or directory) while logging to syslog, server: unix:/tmp/site_total.sock
2026/01/15 23:47:20 [alert] 607193#0: connect() failed (2: No such file or directory) while logging to syslog, server: unix:/tmp/site_total.sock
2026/01/15 23:47:20 [alert] 607194#0: connect() failed (2: No such file or directory) while logging to syslog, server: unix:/tmp/site_total.sock
2026/01/15 23:47:20 [alert] 607193#0: connect() failed (2: No such file or directory) while logging to syslog, server: unix:/tmp/site_total.sock
2026/01/15 23:47:20 [alert] 607194#0: connect() failed (2: No such file or directory) while logging to syslog, server: unix:/tmp/site_total.sock
2026/01/15 23:47:20 [alert] 607193#0: connect() failed (2: No such file or directory) while logging to syslog, server: unix:/tmp/site_total.sock
2026/01/15 23:47:20 [alert] 607193#0: connect() failed (2: No such file or directory) while logging to syslog, server: unix:/tmp/site_total.sock
2026/01/15 23:47:20 [alert] 607194#0: connect() failed (2: No such file or directory) while logging to syslog, server: unix:/tmp/site_total.sock
2026/01/15 23:47:20 [alert] 607193#0: connect() failed (2: No such file or directory) while logging to syslog, server: unix:/tmp/site_total.sock
2026/01/15 23:47:20 [alert] 607194#0: connect() failed (2: No such file or directory) while logging to syslog, server: unix:/tmp/site_total.sock
2026/01/15 23:47:20 [alert] 607193#0: connect() failed (2: No such file or directory) while logging to syslog, server: unix:/tmp/site_total.sock
2026/01/15 23:47:20 [alert] 607194#0: connect() failed (2: No such file or directory) while logging to syslog, server: unix:/tmp/site_total.sock
2026/01/15 23:47:20 [alert] 607193#0: connect() failed (2: No such file or directory) while logging to syslog, server: unix:/tmp/site_total.sock
2026/01/15 23:47:20 [alert] 607194#0: connect() failed (2: No such file or directory) while logging to syslog, server: unix:/tmp/site_total.sock
2026/01/15 23:47:20 [alert] 607194#0: connect() failed (2: No such file or directory) while logging to syslog, server: unix:/tmp/site_total.sock
2026/01/15 23:47:20 [alert] 607193#0: connect() failed (2: No such file or directory) while logging to syslog, server: unix:/tmp/site_total.sock
2026/01/15 23:47:20 [alert] 607193#0: connect() failed (2: No such file or directory) while logging to syslog, server: unix:/tmp/site_total.sock
2026/01/15 23:47:20 [alert] 607194#0: connect() failed (2: No such file or directory) while logging to syslog, server: unix:/tmp/site_total.sock
2026/01/15 23:47:20 [alert] 607193#0: connect() failed (2: No such file or directory) while logging to syslog, server: unix:/tmp/site_total.sock
2026/01/15 23:47:20 [alert] 607194#0: connect() failed (2: No such file or directory) while logging to syslog, server: unix:/tmp/site_total.sock
2026/01/15 23:47:20 [alert] 607193#0: connect() failed (2: No such file or directory) while logging to syslog, server: unix:/tmp/site_total.sock
2026/01/15 23:47:20 [alert] 607194#0: connect() failed (2: No such file or directory) while logging to syslog, server: unix:/tmp/site_total.sock
2026/01/15 23:47:20 [alert] 607193#0: connect() failed (2: No such file or directory) while logging to syslog, server: unix:/tmp/site_total.sock
2026/01/15 23:47:20 [alert] 607194#0: connect() failed (2: No such file or directory) while logging to syslog, server: unix:/tmp/site_total.sock
2026/01/15 23:47:20 [alert] 607193#0: connect() failed (2: No such file or directory) while logging to syslog, server: unix:/tmp/site_total.sock</textarea>
<button id="analyzeBtn">🔍 开始分析日志</button>
<button id="clearBtn" class="clear-btn">🗑️ 清空内容</button>
</div>
<div class="results">
<!-- 基础统计卡片 -->
<div class="stat-card">
<h2>📊 日志统计概览</h2>
<div class="stats-grid">
<div class="stat-item">
<p class="stat-label">总日志行数</p>
<p id="totalLines" class="stat-value">0</p>
</div>
<div class="stat-item">
<p class="stat-label">异常类型数量</p>
<p id="errorTypeCount" class="stat-value">0</p>
</div>
<div class="stat-item">
<p class="stat-label">总异常次数</p>
<p id="totalErrors" class="stat-value">0</p>
</div>
<div class="stat-item">
<p class="stat-label">主要异常占比</p>
<p id="mainErrorRatio" class="stat-value">0%</p>
</div>
</div>
<p class="time-range" id="timeRange">时间范围:-- -- --</p>
</div>
<!-- 异常分析卡片 -->
<div class="stat-card">
<h2>🔍 异常分析结果 (按出现次数排序)</h2>
<table id="errorAnalysisTable">
<thead>
<tr>
<th>异常等级</th>
<th>异常类型</th>
<th>异常详情</th>
<th>出现次数</th>
</tr>
</thead>
<tbody id="errorAnalysisBody">
<tr>
<td colspan="4" style="text-align: center; color: #999;">请点击分析按钮查看数据</td>
</tr>
</tbody>
</table>
</div>
<!-- 进程统计卡片 -->
<div class="stat-card">
<h2>⚙️ Nginx进程异常统计</h2>
<table id="processTable">
<thead>
<tr>
<th>进程ID</th>
<th>异常次数</th>
<th>占比</th>
</tr>
</thead>
<tbody id="processBody">
<tr>
<td colspan="3" style="text-align: center; color: #999;">请点击分析按钮查看数据</td>
</tr>
</tbody>
</table>
</div>
</div>
</div>
<script>
// 获取DOM元素
const logInput = document.getElementById('logInput');
const analyzeBtn = document.getElementById('analyzeBtn');
const clearBtn = document.getElementById('clearBtn');
const totalLines = document.getElementById('totalLines');
const errorTypeCount = document.getElementById('errorTypeCount');
const totalErrors = document.getElementById('totalErrors');
const mainErrorRatio = document.getElementById('mainErrorRatio');
const timeRange = document.getElementById('timeRange');
const errorAnalysisBody = document.getElementById('errorAnalysisBody');
const processBody = document.getElementById('processBody');
// 解析单条Nginx日志的函数
function parseNginxErrorLog(logLine) {
logLine = logLine.trim();
if (!logLine) return null;
try {
// 1. 提取时间戳
const timeMatch = logLine.match(/^(\d{4}\/\d{2}\/\d{2} \d{2}:\d{2}:\d{2})/);
const timestamp = timeMatch ? timeMatch[1] : '未知时间';
// 2. 提取错误等级 [alert/error/warning/info]
const levelMatch = logLine.match(/\[(\w+)\]/);
const errorLevel = levelMatch ? levelMatch[1].toLowerCase() : 'unknown';
// 3. 提取进程ID
const pidMatch = logLine.match(/(\d+)#\d+:/);
const processId = pidMatch ? pidMatch[1] : '未知进程';
// 4. 提取错误信息(进程ID后到行尾)
const errorMsgMatch = logLine.match(/\d+#\d+: (.*)$/);
let errorMessage = errorMsgMatch ? errorMsgMatch[1] : '未知错误';
// 5. 分类错误类型
let errorType = '未知异常';
if (errorMessage.includes('connect() failed') && errorMessage.includes('No such file or directory')) {
errorType = 'Syslog套接字连接失败';
} else if (errorMessage.includes('connect() failed')) {
errorType = '网络连接失败';
} else if (errorMessage.includes('permission denied')) {
errorType = '权限不足';
} else if (errorMessage.includes('file not found')) {
errorType = '文件不存在';
} else if (errorMessage.includes('invalid configuration')) {
errorType = '配置文件错误';
}
return {
timestamp: timestamp,
errorLevel: errorLevel,
processId: processId,
errorMessage: errorMessage,
errorType: errorType,
rawLine: logLine
};
} catch (error) {
console.error('解析日志失败:', error, logLine);
return null;
}
}
// 分析日志的主函数
function analyzeLogs() {
// 清空之前的结果
errorAnalysisBody.innerHTML = '';
processBody.innerHTML = '';
// 获取日志内容并按行分割
const logContent = logInput.value;
const logLines = logContent.split('\n').filter(line => line.trim() !== '');
// 更新总行数
totalLines.textContent = logLines.length;
// 如果没有日志内容
if (logLines.length === 0) {
errorAnalysisBody.innerHTML = `
<tr>
<td colspan="4" style="text-align: center; color: #999;">暂无日志数据</td>
</tr>
`;
processBody.innerHTML = `
<tr>
<td colspan="3" style="text-align: center; color: #999;">暂无日志数据</td>
</tr>
`;
errorTypeCount.textContent = '0';
totalErrors.textContent = '0';
mainErrorRatio.textContent = '0%';
timeRange.textContent = '时间范围:暂无数据';
return;
}
// 解析所有日志行
const parsedLogs = [];
const errorStats = {}; // 按错误信息去重统计
const processStats = {}; // 进程统计
const timestamps = []; // 用于计算时间范围
logLines.forEach(line => {
const parsed = parseNginxErrorLog(line);
if (parsed) {
parsedLogs.push(parsed);
timestamps.push(parsed.timestamp);
// 统计错误信息(按错误信息去重)
const errorKey = parsed.errorMessage;
if (!errorStats[errorKey]) {
errorStats[errorKey] = {
count: 0,
errorLevel: parsed.errorLevel,
errorType: parsed.errorType
};
}
errorStats[errorKey].count++;
// 统计进程异常次数
if (!processStats[parsed.processId]) {
processStats[parsed.processId] = 0;
}
processStats[parsed.processId]++;
}
});
// 计算统计数据
const totalErrorCount = parsedLogs.length;
const errorTypeCountVal = Object.keys(errorStats).length;
totalErrors.textContent = totalErrorCount;
errorTypeCount.textContent = errorTypeCountVal;
// 计算时间范围
if (timestamps.length > 0) {
const sortedTimes = [...new Set(timestamps)].sort();
const timeRangeText = sortedTimes.length > 1
? `时间范围:${sortedTimes[0]} 至 ${sortedTimes[sortedTimes.length - 1]}`
: `时间范围:${sortedTimes[0]}`;
timeRange.textContent = timeRangeText;
}
// 计算主要异常占比
if (errorTypeCountVal > 0) {
// 找出出现次数最多的异常
const sortedErrors = Object.entries(errorStats).sort((a, b) => b[1].count - a[1].count);
const mainErrorCount = sortedErrors.length > 0 ? sortedErrors[0][1].count : 0;
const ratio = totalErrorCount > 0 ? Math.round((mainErrorCount / totalErrorCount) * 100) : 0;
mainErrorRatio.textContent = `${ratio}%`;
// 生成异常分析表格
let errorTableHtml = '';
sortedErrors.forEach(([errorMsg, stats]) => {
const levelClass = stats.errorLevel === 'alert' ? 'level-alert' :
stats.errorLevel === 'error' ? 'level-error' :
stats.errorLevel === 'warning' ? 'level-warning' : 'level-info';
const levelText = stats.errorLevel.toUpperCase();
errorTableHtml += `
<tr>
<td><span class="error-level ${levelClass}">${levelText}</span></td>
<td class="error-type">${stats.errorType}</td>
<td class="error-details">${errorMsg}</td>
<td class="error-count">${stats.count}</td>
</tr>
`;
});
errorAnalysisBody.innerHTML = errorTableHtml;
// 生成进程统计表格
const sortedProcesses = Object.entries(processStats).sort((a, b) => b[1] - a[1]);
let processTableHtml = '';
sortedProcesses.forEach(([pid, count]) => {
const ratio = Math.round((count / totalErrorCount) * 100);
processTableHtml += `
<tr>
<td>${pid}</td>
<td class="error-count">${count}</td>
<td>${ratio}%</td>
</tr>
`;
});
processBody.innerHTML = processTableHtml;
} else {
errorAnalysisBody.innerHTML = `
<tr>
<td colspan="4" style="text-align: center; color: #ff6600;">日志解析失败,请检查格式</td>
</tr>
`;
processBody.innerHTML = `
<tr>
<td colspan="3" style="text-align: center; color: #ff6600;">日志解析失败,请检查格式</td>
</tr>
`;
mainErrorRatio.textContent = '0%';
timeRange.textContent = '时间范围:解析失败';
}
}
// 清空内容
function clearContent() {
logInput.value = '';
totalLines.textContent = '0';
errorTypeCount.textContent = '0';
totalErrors.textContent = '0';
mainErrorRatio.textContent = '0%';
timeRange.textContent = '时间范围:-- -- --';
errorAnalysisBody.innerHTML = `
<tr>
<td colspan="4" style="text-align: center; color: #999;">请点击分析按钮查看数据</td>
</tr>
`;
processBody.innerHTML = `
<tr>
<td colspan="3" style="text-align: center; color: #999;">请点击分析按钮查看数据</td>
</tr>
`;
}
// 绑定事件
analyzeBtn.addEventListener('click', analyzeLogs);
clearBtn.addEventListener('click', clearContent);
// 页面加载完成后自动解析示例数据
window.addEventListener('load', analyzeLogs);
// 支持按Ctrl+Enter快速分析
logInput.addEventListener('keypress', function(e) {
if (e.key === 'Enter' && e.ctrlKey) {
analyzeLogs();
}
});
</script>
</body>
</html>三、Nginx 日志分析定位危险的典型场景
-
场景 1:Nginx 服务运行卡顿 现象:服务器访问缓慢,Nginx 日志量暴增,传统方式需逐行查
/var/log/nginx/error.log;工具使用:解析日志后,立即看到 "607193/607194 进程高频报 Syslog 套接字连接失败(alert 级),占比 100%",5 分钟内重建/tmp/site_total.sock套接字,Nginx 恢复正常,日志量回归平稳。 -
场景 2:隐性配置问题导致偶发 500 错误现象:用户偶发反馈 500 错误,但 Nginx 无明显崩溃,排查无方向;工具使用:解析日志后发现 "低频次的权限不足异常(error 级),涉及某静态文件路径",调整文件权限后,500 错误彻底消失。
-
场景 3:优化 Nginx 运维策略现象:Nginx 不定期重启,无法确定故障根源;工具使用:解析多时段日志后,发现 "某进程持续报配置文件错误(warning 级)",定位到配置文件语法漏洞,修复后 Nginx 运行稳定性提升 90%。
四、适配人群
- 运维人员:快速定位 Nginx 异常根源,秒级识别高危故障,提升服务器服务稳定性;
- 服务器管理员:无需专业 Nginx 知识,一键掌握服务健康度,制定精准修复策略;
- 小型团队 / 个人站长:无专业运维资源时,低成本实现 Nginx 故障监控,避免业务中断;
- 开发人员:快速关联 Nginx 异常与业务代码,区分 "服务端故障" 和 "代码层问题",精准修复 bug。
总结
- Nginx 日志分析的核心价值是秒级定位异常类型、识别故障进程、分级处理风险,筑牢服务器核心服务防线;
- 网页版工具零安装、零服务器风险,智能解析日志并结构化呈现危险信息,1 分钟锁定核心故障点;
- 操作仅需 "复制 - 粘贴 - 解析" 三步,非专业人员也能快速定位 Nginx 危险,大幅降低服务中断的风险。
该工具以 "科技修仙" 轻量化设计,将复杂的 Nginx 日志分析简化为 "一键解析、危险秒现",让 Nginx 运维从 "被动救火" 变为 "主动防御",真正实现 "洞察 Nginx 异常玄机,秒级锁定服务危险"。
阿雪技术观
在科技发展浪潮中,我们不妨积极投身技术共享。不满足于做受益者,更要主动担当贡献者。无论是分享代码、撰写技术博客,还是参与开源项目维护改进,每一个微小举动都可能蕴含推动技术进步的巨大能量。东方仙盟是汇聚力量的天地,我们携手在此探索硅基生命,为科技进步添砖加瓦。
Hey folks, in this wild tech - driven world, why not dive headfirst into the whole tech - sharing scene? Don't just be the one reaping all the benefits; step up and be a contributor too. Whether you're tossing out your code snippets, hammering out some tech blogs, or getting your hands dirty with maintaining and sprucing up open - source projects, every little thing you do might just end up being a massive force that pushes tech forward. And guess what? The Eastern FairyAlliance is this awesome place where we all come together. We're gonna team up