帕累托原则(Pareto Principle)指出,对于许多结果,大约 80% 的后果来自 20% 的原因。在商业中,这通常是正确的:80% 的销售额来自 20% 的客户,或者 80% 的 bug 来自 20% 的代码。
识别这些"关键少数"(Vital Few)可以让你将精力集中在最重要的地方。在本教程中,我们将编写一个 SQL 查询,将产品分类为前 20% 和后 80%。
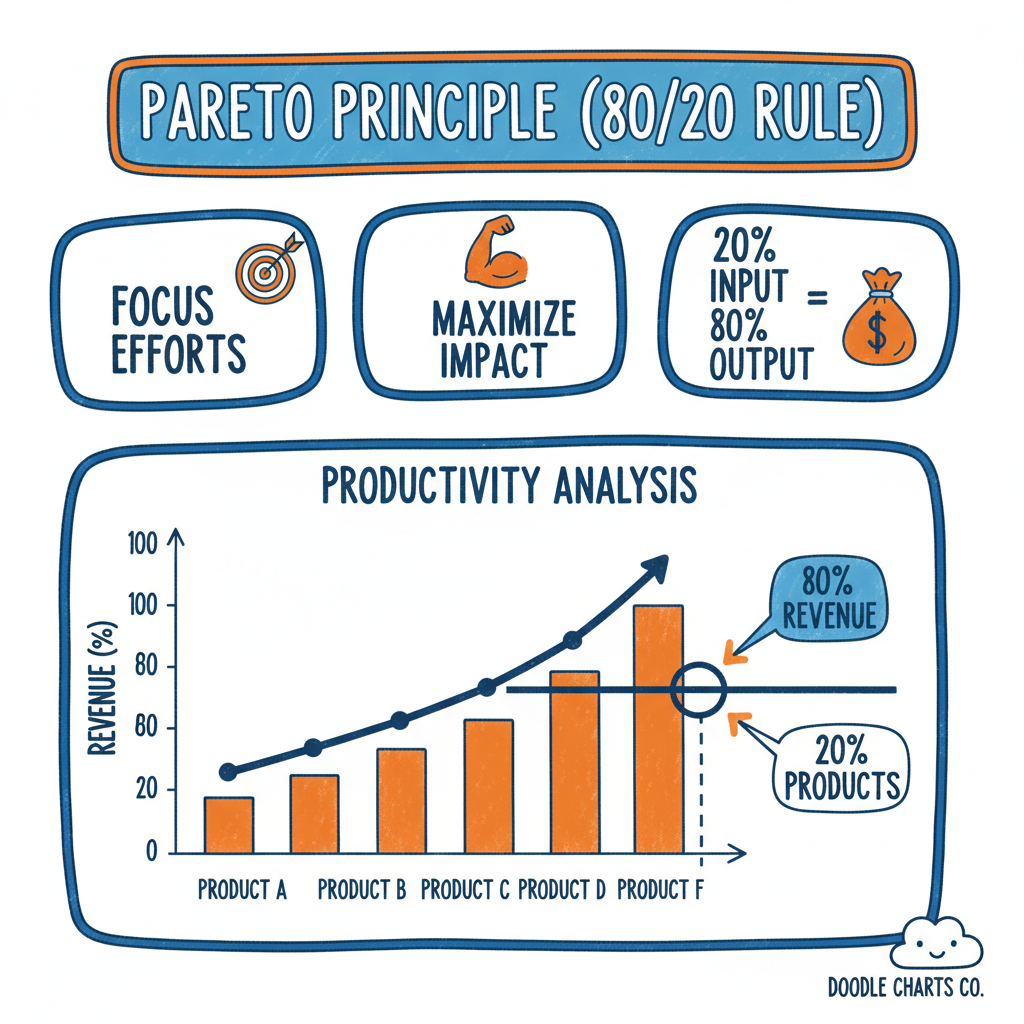
帕累托曲线,显示累计收入和 80/20 阈值
实现策略
实现帕累托分析需要以下 5 个步骤:
- 计算总销售额:每个项目的总销售额
- 排序:从最高销售额到最低销售额
- 计算累计总额:运行总计(Running Total)
- 计算累计百分比 :
累计总额 / 总计 - 筛选:累计百分比 ≤ 80% 的项目是核心收入驱动因素
步骤 1:累计总额(Running Total)
我们使用窗口函数 SUM:
sql
SUM(amount) OVER (ORDER BY amount DESC)说明:
OVER (ORDER BY amount DESC):按金额降序排列SUM(amount):计算累计总额- 结果是每一行的累计总和
步骤 2:总计(Grand Total)
要获得百分比,我们可以将累计总额除以总计:
sql
SUM(amount) OVER (ORDER BY amount DESC) * 1.0 / SUM(amount) OVER ()关键点:
- 空的
OVER ()子句表示"整个数据集的总和" - 乘以
1.0确保浮点数除法(避免整数除法)
交互式演练场
让我们看一个电子产品商店的销售数据。我们将识别哪些产品占据了前 80% 的收入。
示例数据(order_items_pareto 表):
| order_id | product_name | price | quantity |
|---|---|---|---|
| 1 | Laptop | 1200 | 5 |
| 2 | Smartphone | 800 | 10 |
| 3 | Headphones | 100 | 20 |
| 4 | Mouse | 25 | 50 |
| 5 | Keyboard | 80 | 30 |
| 6 | Monitor | 300 | 8 |
| 7 | Laptop | 1200 | 3 |
| 8 | Smartphone | 800 | 5 |
完整查询:
sql
WITH ProductSales AS (
  -- 第 1 步:计算每个产品的总销售额
  SELECT
    product_name,
    SUM(price * quantity) as total_revenue
  FROM order_items_pareto
  GROUP BY product_name
),
RankedProducts AS (
  -- 第 2-4 步:排序、累计总额、累计百分比
  SELECT
    product_name,
    total_revenue,
    SUM(total_revenue) OVER (ORDER BY total_revenue DESC) as running_total,
    SUM(total_revenue) OVER () as grand_total
  FROM ProductSales
)
-- 第 5 步:筛选和分类
SELECT
  product_name,
  total_revenue,
  running_total,
  ROUND(100.0 * running_total / grand_total, 2) as cumulative_pct,
  CASE
    WHEN 100.0 * running_total / grand_total <= 80 THEN 'Top 20%'
    ELSE 'Bottom 80%'
  END as pareto_category
FROM RankedProducts
ORDER BY total_revenue DESC;查询解析:
CTE 1: ProductSales
sql
SELECT
  product_name,
  SUM(price * quantity) as total_revenue
FROM order_items_pareto
GROUP BY product_name作用:
- 计算每个产品的总销售额
price * quantity:单笔订单的收入SUM(...):汇总每个产品的所有订单
中间结果:
| product_name | total_revenue |
|---|---|
| Laptop | 9600 |
| Smartphone | 12000 |
| Headphones | 2000 |
| Mouse | 1250 |
| Keyboard | 2400 |
| Monitor | 2400 |
CTE 2: RankedProducts
sql
SELECT
  product_name,
  total_revenue,
  SUM(total_revenue) OVER (ORDER BY total_revenue DESC) as running_total,
  SUM(total_revenue) OVER () as grand_total
FROM ProductSales作用:
- 按销售额降序排列
- 计算累计总额(running_total)
- 计算总计(grand_total)
中间结果:
| product_name | total_revenue | running_total | grand_total |
|---|---|---|---|
| Smartphone | 12000 | 12000 | 29650 |
| Laptop | 9600 | 21600 | 29650 |
| Keyboard | 2400 | 24000 | 29650 |
| Monitor | 2400 | 26400 | 29650 |
| Headphones | 2000 | 28400 | 29650 |
| Mouse | 1250 | 29650 | 29650 |
最终查询
sql
SELECT
  product_name,
  total_revenue,
  running_total,
  ROUND(100.0 * running_total / grand_total, 2) as cumulative_pct,
  CASE
    WHEN 100.0 * running_total / grand_total <= 80 THEN 'Top 20%'
    ELSE 'Bottom 80%'
  END as pareto_category
FROM RankedProducts
ORDER BY total_revenue DESC;作用:
- 计算累计百分比
- 使用 CASE 表达式分类为"Top 20%"或"Bottom 80%"
- 按销售额降序排列
最终结果:
| product_name | total_revenue | running_total | cumulative_pct | pareto_category |
|---|---|---|---|---|
| Smartphone | 12000 | 12000 | 40.47 | Top 20% |
| Laptop | 9600 | 21600 | 72.85 | Top 20% |
| Keyboard | 2400 | 24000 | 80.95 | Bottom 80% |
| Monitor | 2400 | 26400 | 89.05 | Bottom 80% |
| Headphones | 2000 | 28400 | 95.78 | Bottom 80% |
| Mouse | 1250 | 29650 | 100.00 | Bottom 80% |
结果分析
在上面的示例中,你应该看到只有 Smartphone 和 Laptop 占据了约 73% 的收入(接近 80%)。筛选逻辑 cumulative_pct <= 80 帮助我们以编程方式隔离这些关键项目用于报告。
关键洞察:
| 指标 | 值 | 说明 |
|---|---|---|
| Top 20% 产品数量 | 2 个(Smartphone、Laptop) | 占总产品数的 33% |
| Top 20% 收入 | $21,600 | 占总收入的 73% |
| Bottom 80% 产品数量 | 4 个 | 占总产品数的 67% |
| Bottom 80% 收入 | $8,050 | 占总收入的 27% |
业务启示:
- 聚焦核心产品:Smartphone 和 Laptop 是核心收入驱动产品
- 库存优化:优先补货这两款产品
- 营销策略:将营销预算集中在这两款产品上
- 长尾策略:其他产品可以考虑降低库存或清仓
扩展分析
1. 识别"长尾"产品
sql
-- 识别属于"长尾"的产品
SELECT
  product_name,
  total_revenue,
  cumulative_pct,
  pareto_category
FROM RankedProducts
WHERE 100.0 * running_total / grand_total > 80
ORDER BY total_revenue DESC;用途:
- 识别低收入产品
- 考虑清仓或停产
- 释放库存空间
2. 计算"Top 20%"产品的统计信息
sql
-- 计算有多少产品属于"Top 20%"
WITH ParetoStats AS (
  SELECT
    CASE
      WHEN 100.0 * running_total / grand_total <= 80 THEN 'Top 20%'
      ELSE 'Bottom 80%'
    END as category,
    COUNT(*) as product_count,
    SUM(total_revenue) as category_revenue
  FROM RankedProducts
  GROUP BY
    CASE
      WHEN 100.0 * running_total / grand_total <= 80 THEN 'Top 20%'
      ELSE 'Bottom 80%'
    END
)
SELECT
  category,
  product_count,
  category_revenue,
  ROUND(100.0 * product_count / SUM(product_count) OVER (), 2) as pct_of_products,
  ROUND(100.0 * category_revenue / SUM(category_revenue) OVER (), 2) as pct_of_revenue
FROM ParetoStats
ORDER BY category;结果示例:
| category | product_count | category_revenue | pct_of_products | pct_of_revenue |
|---|---|---|---|---|
| Top 20% | 2 | 21600 | 33.33 | 72.85 |
| Bottom 80% | 4 | 8050 | 66.67 | 27.15 |
3. 按类别应用帕累托分析
sql
-- 按产品类别分别应用帕累托分析
WITH CategorySales AS (
  SELECT
    category,
    product_name,
    SUM(price * quantity) as total_revenue
  FROM order_items_with_category
  GROUP BY category, product_name
),
RankedByCategory AS (
  SELECT
    category,
    product_name,
    total_revenue,
    SUM(total_revenue) OVER (PARTITION BY category ORDER BY total_revenue DESC) as running_total,
    SUM(total_revenue) OVER (PARTITION BY category) as category_total
  FROM CategorySales
)
SELECT
  category,
  product_name,
  total_revenue,
  ROUND(100.0 * running_total / category_total, 2) as cumulative_pct,
  CASE
    WHEN 100.0 * running_total / category_total <= 80 THEN 'Top 20%'
    ELSE 'Bottom 80%'
  END as pareto_category
FROM RankedByCategory
ORDER BY category, total_revenue DESC;用途:
- 在每个类别内识别核心产品
- 更精细的库存管理
- 分类别的营销策略
应用场景
1. 客户分析(识别 VIP 客户)
sql
-- 识别贡献 80% 收入的客户
WITH CustomerRevenue AS (
  SELECT
    customer_id,
    SUM(order_total) as total_spent
  FROM orders
  GROUP BY customer_id
),
RankedCustomers AS (
  SELECT
    customer_id,
    total_spent,
    SUM(total_spent) OVER (ORDER BY total_spent DESC) as running_total,
    SUM(total_spent) OVER () as grand_total
  FROM CustomerRevenue
)
SELECT
  customer_id,
  total_spent,
  ROUND(100.0 * running_total / grand_total, 2) as cumulative_pct,
  CASE
    WHEN 100.0 * running_total / grand_total <= 80 THEN 'VIP'
    ELSE 'Regular'
  END as customer_tier
FROM RankedCustomers
WHERE 100.0 * running_total / grand_total <= 80
ORDER BY total_spent DESC;
2. Bug 修复优先级
sql
-- 识别导致 80% 错误的 bug
WITH BugFrequency AS (
  SELECT
    bug_id,
    COUNT(*) as occurrence_count
  FROM error_logs
  GROUP BY bug_id
),
RankedBugs AS (
  SELECT
    bug_id,
    occurrence_count,
    SUM(occurrence_count) OVER (ORDER BY occurrence_count DESC) as running_total,
    SUM(occurrence_count) OVER () as grand_total
  FROM BugFrequency
)
SELECT
  bug_id,
  occurrence_count,
  ROUND(100.0 * running_total / grand_total, 2) as cumulative_pct,
  CASE
    WHEN 100.0 * running_total / grand_total <= 80 THEN 'High Priority'
    ELSE 'Low Priority'
  END as priority
FROM RankedBugs
ORDER BY occurrence_count DESC;
3. 销售区域分析
sql
-- 识别贡献 80% 收入的销售区域
WITH RegionRevenue AS (
  SELECT
    region,
    SUM(order_total) as total_revenue
  FROM orders
  GROUP BY region
),
RankedRegions AS (
  SELECT
    region,
    total_revenue,
    SUM(total_revenue) OVER (ORDER BY total_revenue DESC) as running_total,
    SUM(total_revenue) OVER () as grand_total
  FROM RegionRevenue
)
SELECT
  region,
  total_revenue,
  ROUND(100.0 * running_total / grand_total, 2) as cumulative_pct,
  CASE
    WHEN 100.0 * running_total / grand_total <= 80 THEN 'Core Market'
    ELSE 'Secondary Market'
  END as market_tier
FROM RankedRegions
ORDER BY total_revenue DESC;
4. 供应商管理
sql
-- 识别关键供应商
WITH SupplierSpend AS (
  SELECT
    supplier_id,
    SUM(purchase_amount) as total_spend
  FROM purchases
  GROUP BY supplier_id
),
RankedSuppliers AS (
  SELECT
    supplier_id,
    total_spend,
    SUM(total_spend) OVER (ORDER BY total_spend DESC) as running_total,
    SUM(total_spend) OVER () as grand_total
  FROM SupplierSpend
)
SELECT
  supplier_id,
  total_spend,
  ROUND(100.0 * running_total / grand_total, 2) as cumulative_pct,
  CASE
    WHEN 100.0 * running_total / grand_total <= 80 THEN 'Strategic Supplier'
    ELSE 'Tactical Supplier'
  END as supplier_tier
FROM RankedSuppliers
ORDER BY total_spend DESC;
结论
计算累计分布是分析师的超能力。它让你超越"Top 10"列表(这是任意的),转向统计上显著的细分,如"收入驱动因素"与"长尾"。
帕累托分析的价值:
- 数据驱动决策:基于统计原则,而不是主观判断
- 资源优化:将有限的资源集中在最重要的 20%
- 战略聚焦:识别"关键少数",避免分散精力
- 性能提升:优化核心业务流程,获得最大回报
与 Top N 查询的对比:
| 特性 | Top N 查询 | 帕累托分析 |
|---|---|---|
| 基础 | 任意数量(如 Top 10) | 基于累计百分比(如 80%) |
| 统计意义 | 较低(主观选择) | 高(基于帕累托原则) |
| 适用场景 | 简单排名、展示 | 资源优化、战略决策 |
| 复杂度 | 简单(LIMIT N) | 中等(窗口函数) |
| 灵活性 | 固定数量 | 动态数量(基于阈值) |
| 业务价值 | 信息展示 | 战略指导 |
最佳实践
1. 使用 CTE 组织查询
CTE 使查询更易读和维护,清晰地分离了不同的计算步骤。
2. 四舍五入百分比
使用 ROUND() 函数使百分比更易读(如 72.85% 而不是 72.8472...)。
3. 添加分类列
使用 CASE 表达式明确标记"Top 20%"和"Bottom 80%",方便后续筛选和报告。
4. 可视化结果
绘制帕累托曲线(累计百分比图)可以更直观地展示 80/20 分布:
- X 轴:产品(按销售额降序)
- Y 轴:累计百分比
- 标记 80% 阈值线
5. 定期更新分析
帕累托分布可能随时间变化,建议:
- 每月或每季度重新分析
- 监控"Top 20%"产品的变化
- 及时调整策略
6. 调整阈值
80% 是常见阈值,但可以根据业务需求调整:
- 70%:更严格的核心定义
- 90%:更宽松的核心定义
- 多层次:如 50%、80%、95% 三层分类
常见陷阱
1. 忘记排序
必须使用 ORDER BY ... DESC 确保从高到低排序,否则累计百分比会从低到高计算。
错误示例:
sql
-- ❌ 错误:没有排序
SUM(amount) OVER ()正确示例:
sql
-- ✅ 正确:按金额降序排序
SUM(amount) OVER (ORDER BY amount DESC)
2. 整数除法
在某些数据库中,整数除以整数会得到整数结果,导致百分比计算错误。
错误示例:
sql
-- ❌ 错误:可能导致整数除法
running_total / grand_total正确示例:
sql
-- ✅ 正确:乘以 1.0 确保浮点数除法
running_total * 1.0 / grand_total
-- 或者
CAST(running_total AS FLOAT) / grand_total
3. 空 OVER 子句
OVER () 计算总计,不要忘记括号。
错误示例:
sql
-- ❌ 错误:语法错误
SUM(amount) OVER正确示例:
sql
-- ✅ 正确:空括号表示整个数据集
SUM(amount) OVER ()
4. 累计百分比计算错误
确保使用 running_total / grand_total,而不是 total_revenue / grand_total。
错误示例:
sql
-- ❌ 错误:使用单行金额而不是累计总额
total_revenue * 1.0 / grand_total正确示例:
sql
-- ✅ 正确:使用累计总额
running_total * 1.0 / grand_total
5. 阈值选择不当
80% 是常见阈值,但不是唯一选择。根据业务需求调整阈值。
跨数据库实现
PostgreSQL
sql
-- PostgreSQL 支持标准窗口函数
SELECT
  product_name,
  total_revenue,
  SUM(total_revenue) OVER (ORDER BY total_revenue DESC) as running_total,
  SUM(total_revenue) OVER () as grand_total
FROM ProductSales;
MySQL
sql
-- MySQL 8.0+ 支持窗口函数
SELECT
  product_name,
  total_revenue,
  SUM(total_revenue) OVER (ORDER BY total_revenue DESC) as running_total,
  SUM(total_revenue) OVER () as grand_total
FROM ProductSales;
SQL Server
sql
-- SQL Server 支持标准窗口函数
SELECT
  product_name,
  total_revenue,
  SUM(total_revenue) OVER (ORDER BY total_revenue DESC) as running_total,
  SUM(total_revenue) OVER () as grand_total
FROM ProductSales;
SQLite
sql
-- SQLite 3.25+ 支持窗口函数
SELECT
  product_name,
  total_revenue,
  SUM(total_revenue) OVER (ORDER BY total_revenue DESC) as running_total,
  SUM(total_revenue) OVER () as grand_total
FROM ProductSales;
相关文章推荐
- Calculating Percentiles and Median in SQL - AVG 告诉你均值,但中位数和百分位数呢?
- SQL for Data Analysis: The Ultimate Guide - 超越基础 SELECT,掌握真实世界数据分析的核心 SQL 技术
- SQL Window Frames: ROWS vs RANGE - 学习 ROWS 和 RANGE 窗口帧如何改变结果,避免隐藏的 bug
本文转载自 www.hisqlboy.com
原文标题:The Pareto Principle (80/20 Rule) with SQL
原文链接:https://www.hisqlboy.com/blog/pareto-principle-80-20-sql
原作者:SQL Boy Team
转载日期:2026-02-13