前言

之前已经分享过两篇关于Prometheus安装配置的文章。前面主要讲解了系统监控原理与Prometheus的基本使用,并演示了如何结合Grafana搭建完整的应用监控看板。
本文将重点介绍SpringBoot集成Prometheus的方案。默认配置下无需额外开发,就能自动采集JVM状态、GC信息和HTTP请求等关键指标。但在实际业务场景中,我们往往还需要手动上报特定指标,本文将探讨如何实现这一需求。
项目环境搭建
这里演示的项目主要为SpringBoot3.2.0版本,更高的版本使用方式没有太大的区别。
1.依赖
maven项目的pom信息如下:
XML
<project xmlns="http://maven.apache.org/POM/4.0.0"
         xmlns:xsi="http://www.w3.org/2001/XMLSchema-instance"
         xsi:schemaLocation="http://maven.apache.org/POM/4.0.0 http://maven.apache.org/xsd/maven-4.0.0.xsd">
    <modelVersion>4.0.0</modelVersion>

    <groupId>com.example</groupId>
    <artifactId>DemoApp</artifactId>
    <version>1.0-SNAPSHOT</version>

    <parent>
        <groupId>org.springframework.boot</groupId>
        <artifactId>spring-boot-starter-parent</artifactId>
        <version>3.2.0</version>
        <relativePath/> <!-- lookup parent from repository -->
    </parent>

    <properties>
        <java.version>17</java.version>
        <maven.compiler.source>17</maven.compiler.source>
        <maven.compiler.target>17</maven.compiler.target>
        <project.build.sourceEncoding>UTF-8</project.build.sourceEncoding>
    </properties>

    <dependencies>
        <dependency>
            <groupId>org.springframework.boot</groupId>
            <artifactId>spring-boot-starter-web</artifactId>
        </dependency>

        <dependency>
            <groupId>org.springframework.boot</groupId>
            <artifactId>spring-boot-starter-test</artifactId>
            <scope>test</scope>
        </dependency>

        <dependency>
            <groupId>org.springframework.boot</groupId>
            <artifactId>spring-boot-starter-actuator</artifactId>
        </dependency>

        <dependency>
            <groupId>io.micrometer</groupId>
            <artifactId>micrometer-registry-prometheus</artifactId>
        </dependency>

        <dependency>
            <groupId>com.alibaba.fastjson2</groupId>
            <artifactId>fastjson2</artifactId>
            <version>2.0.32</version>
        </dependency>

        <dependency>
            <groupId>org.projectlombok</groupId>
            <artifactId>lombok</artifactId>
        </dependency>
    </dependencies>

    <build>
        <plugins>
            <plugin>
                <groupId>org.springframework.boot</groupId>
                <artifactId>spring-boot-maven-plugin</artifactId>
            </plugin>
        </plugins>
    </build>

</project>
2. 配置信息
配置的Prometheus的相关信息如下:
TypeScript
spring:
  application:
    name: prometheusapp
management:
  endpoints:
    web:
      exposure:
        include: "*"
  metrics:
    export:
      prometheus:
        enabled: true
    tags:
      application: ${spring.application.name}
上面配置中,有两个关键信息,这里简单说明
management.endpoints.web.exposure.include这里指定所有的web接口都会上报management.metrics.tags.application这个应用所有上报的metrics 都会带上application这个标签
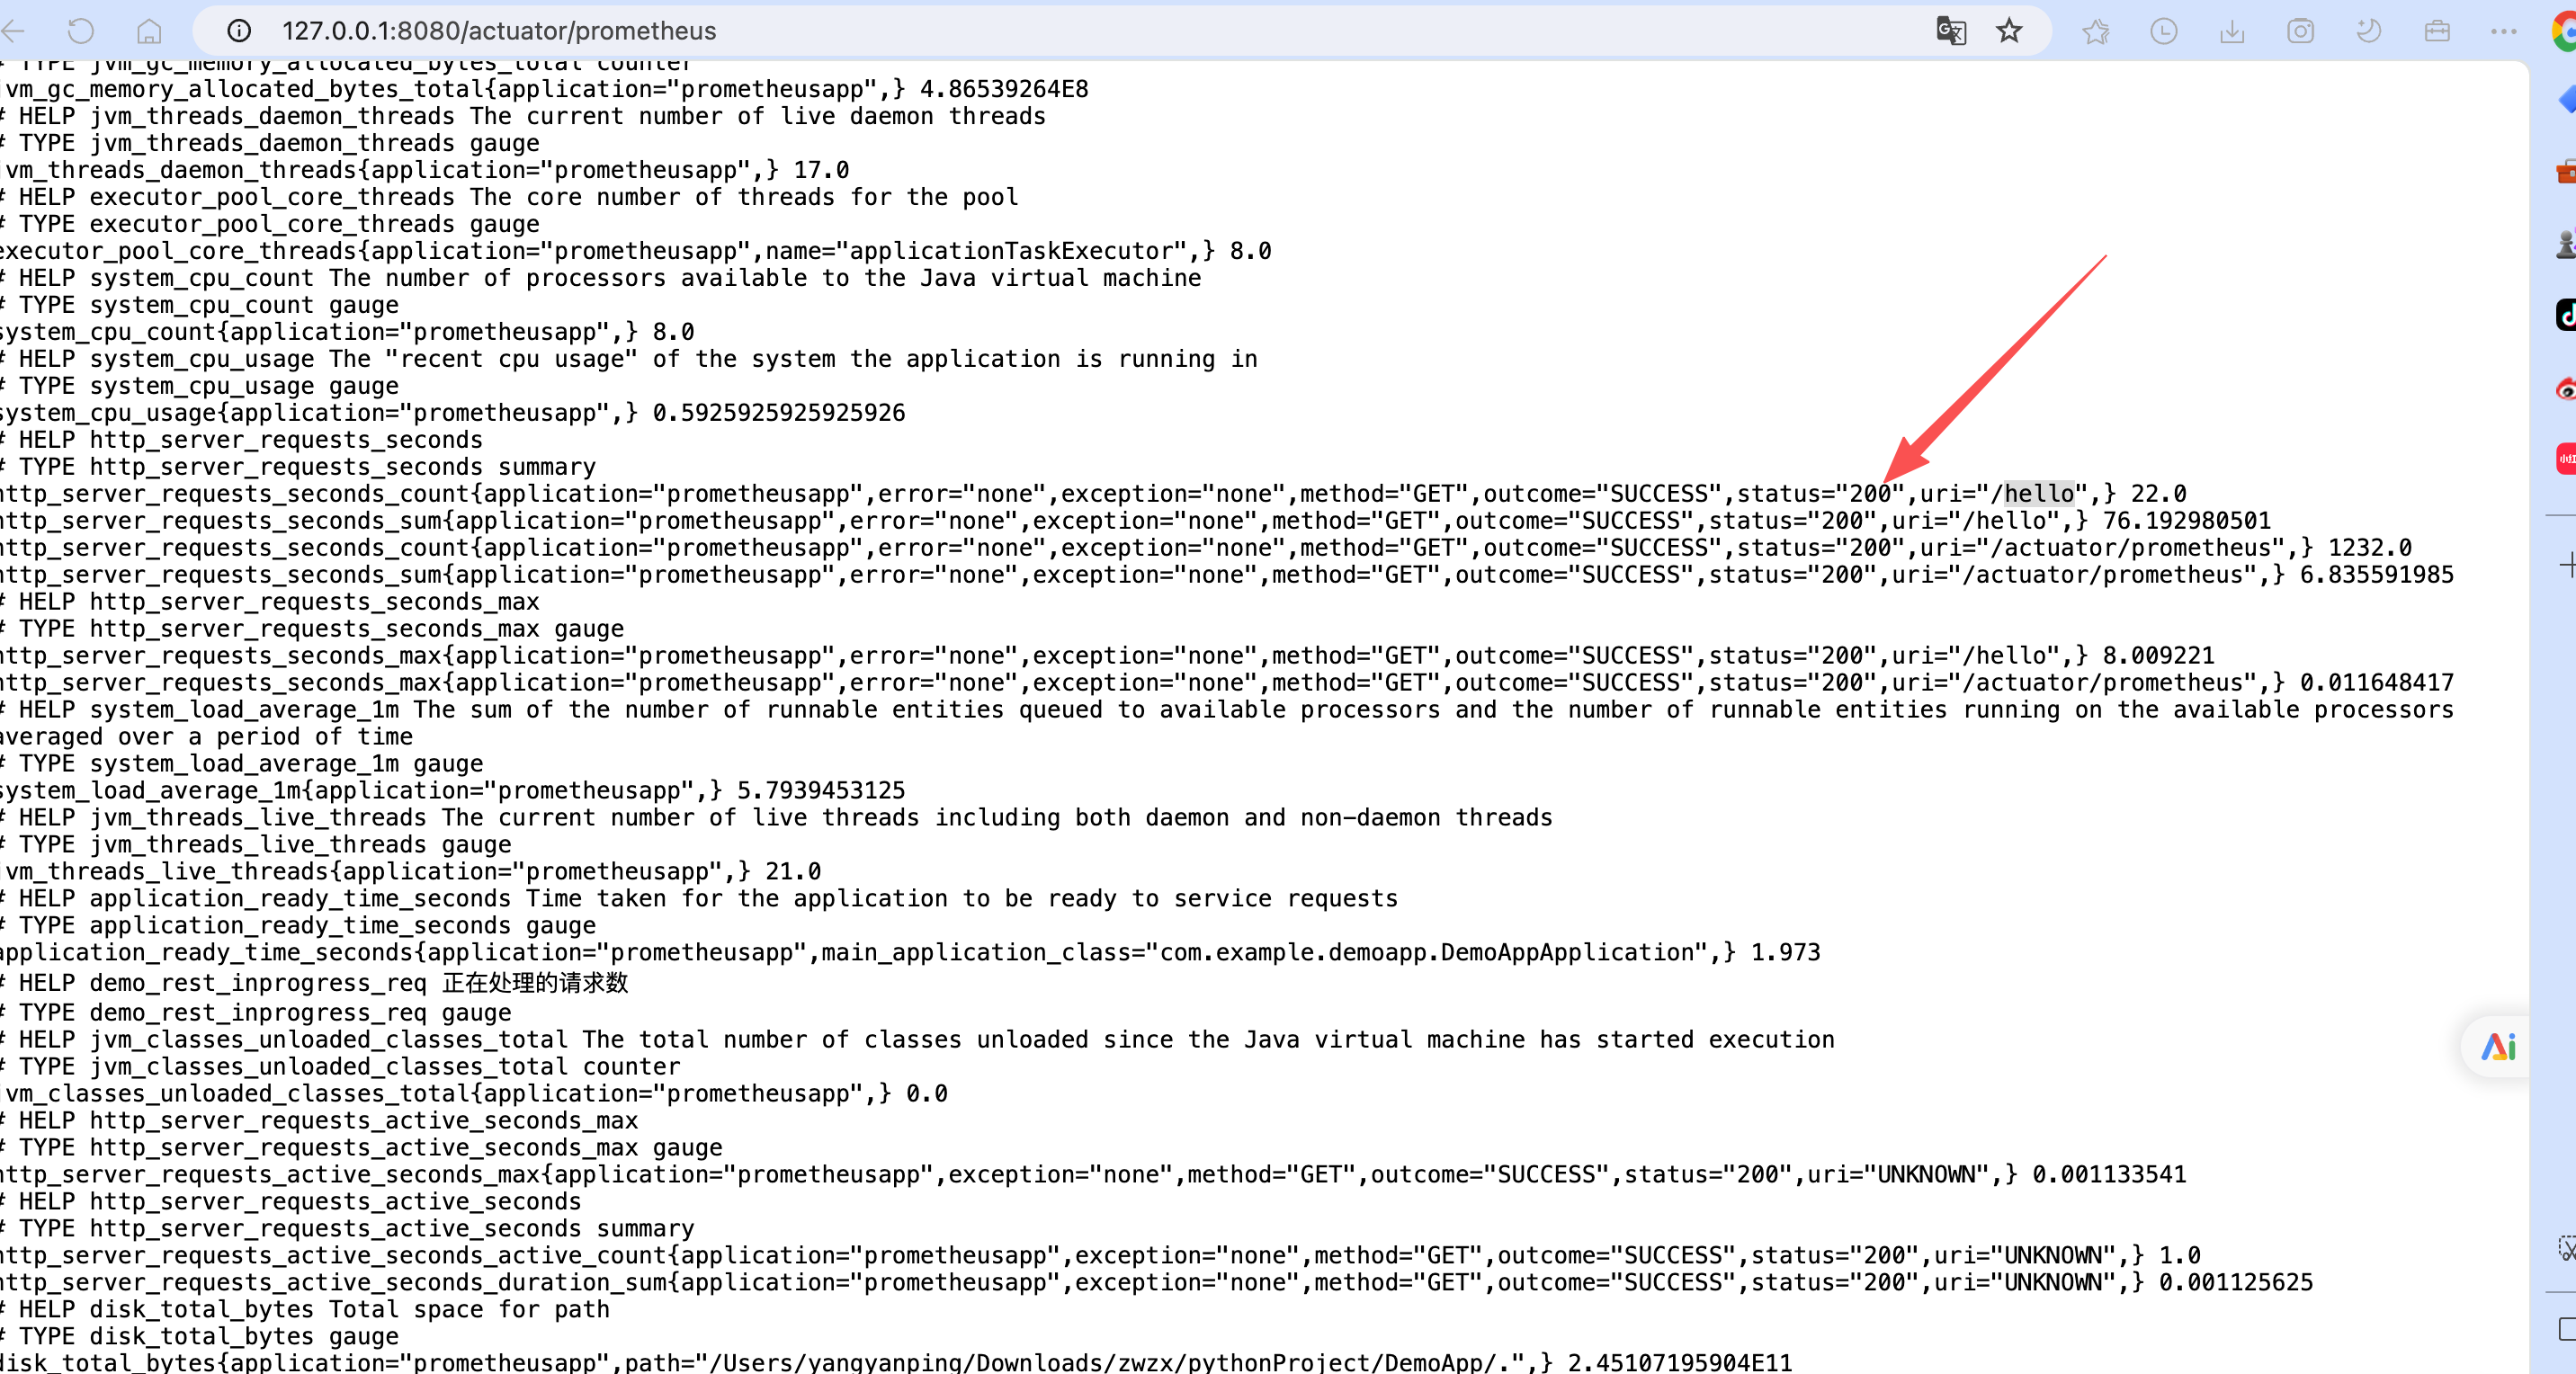
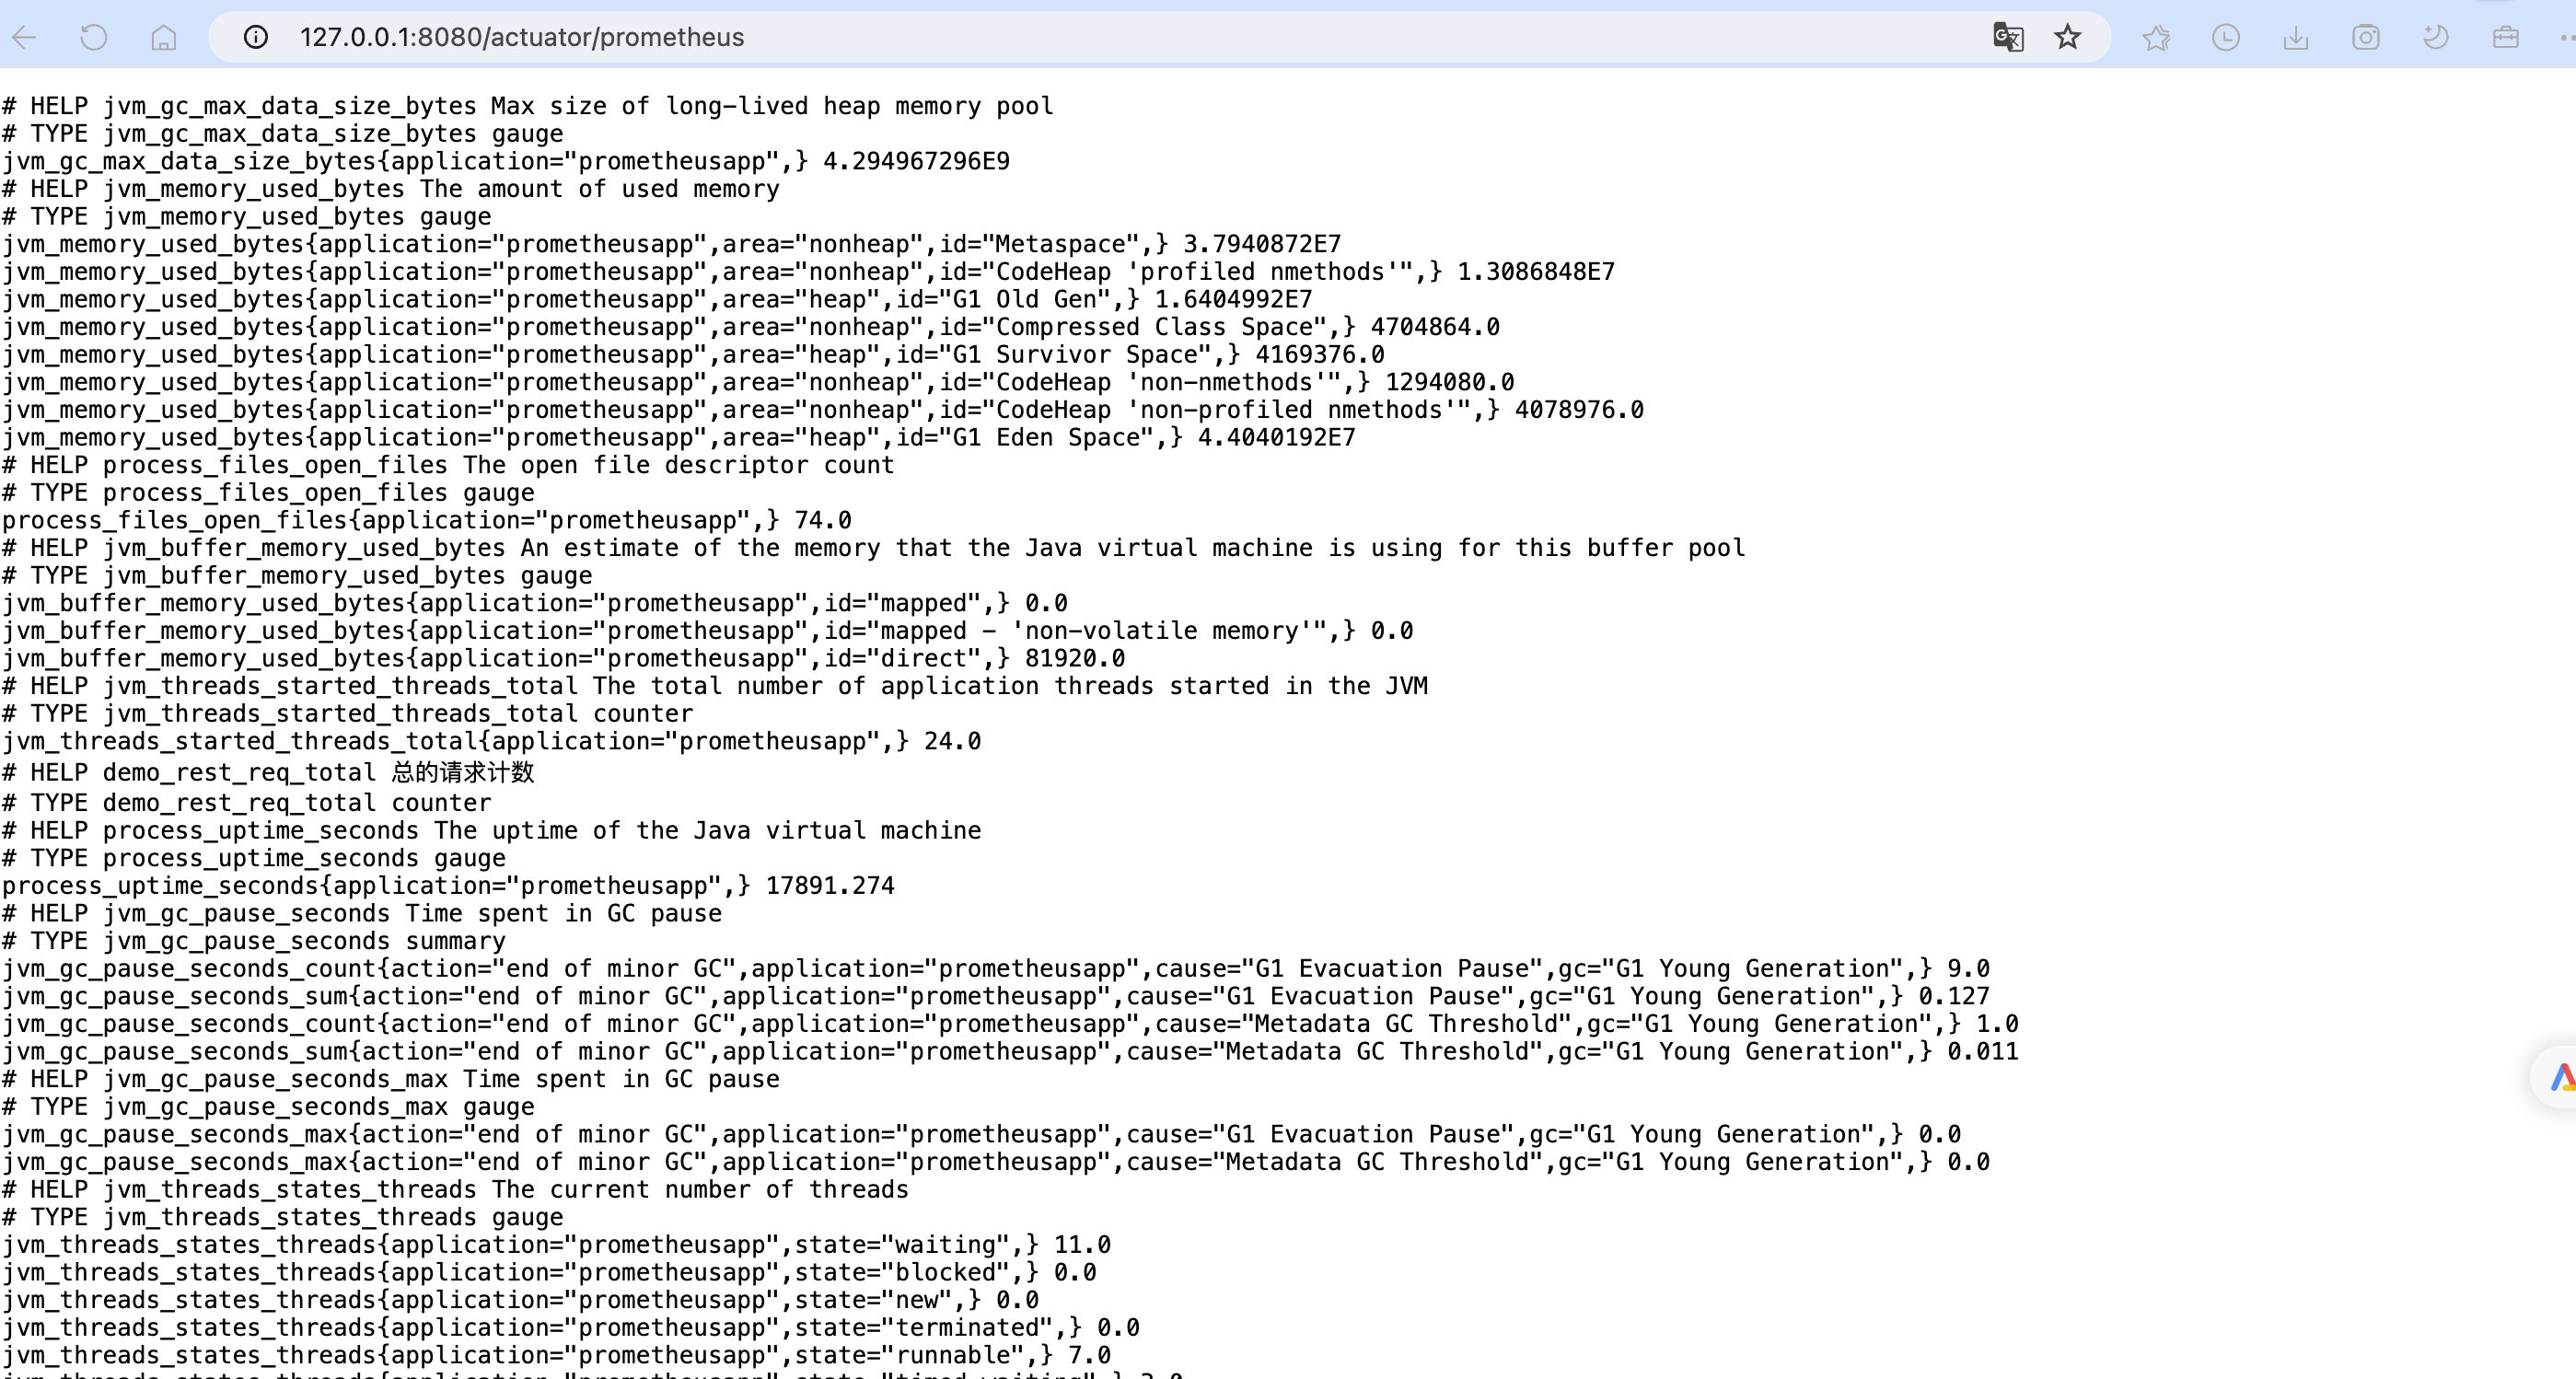
配置完毕之后,会提供一个 /actuator/prometheus的端点,供prometheus来拉取Metrics信息。
自定义上报
假设我们现在想自己上报http请求的相关信息,当前计划采集下面几个信息
- 总的请求数:采用
Counter - 当前正在处理的请求数:采用
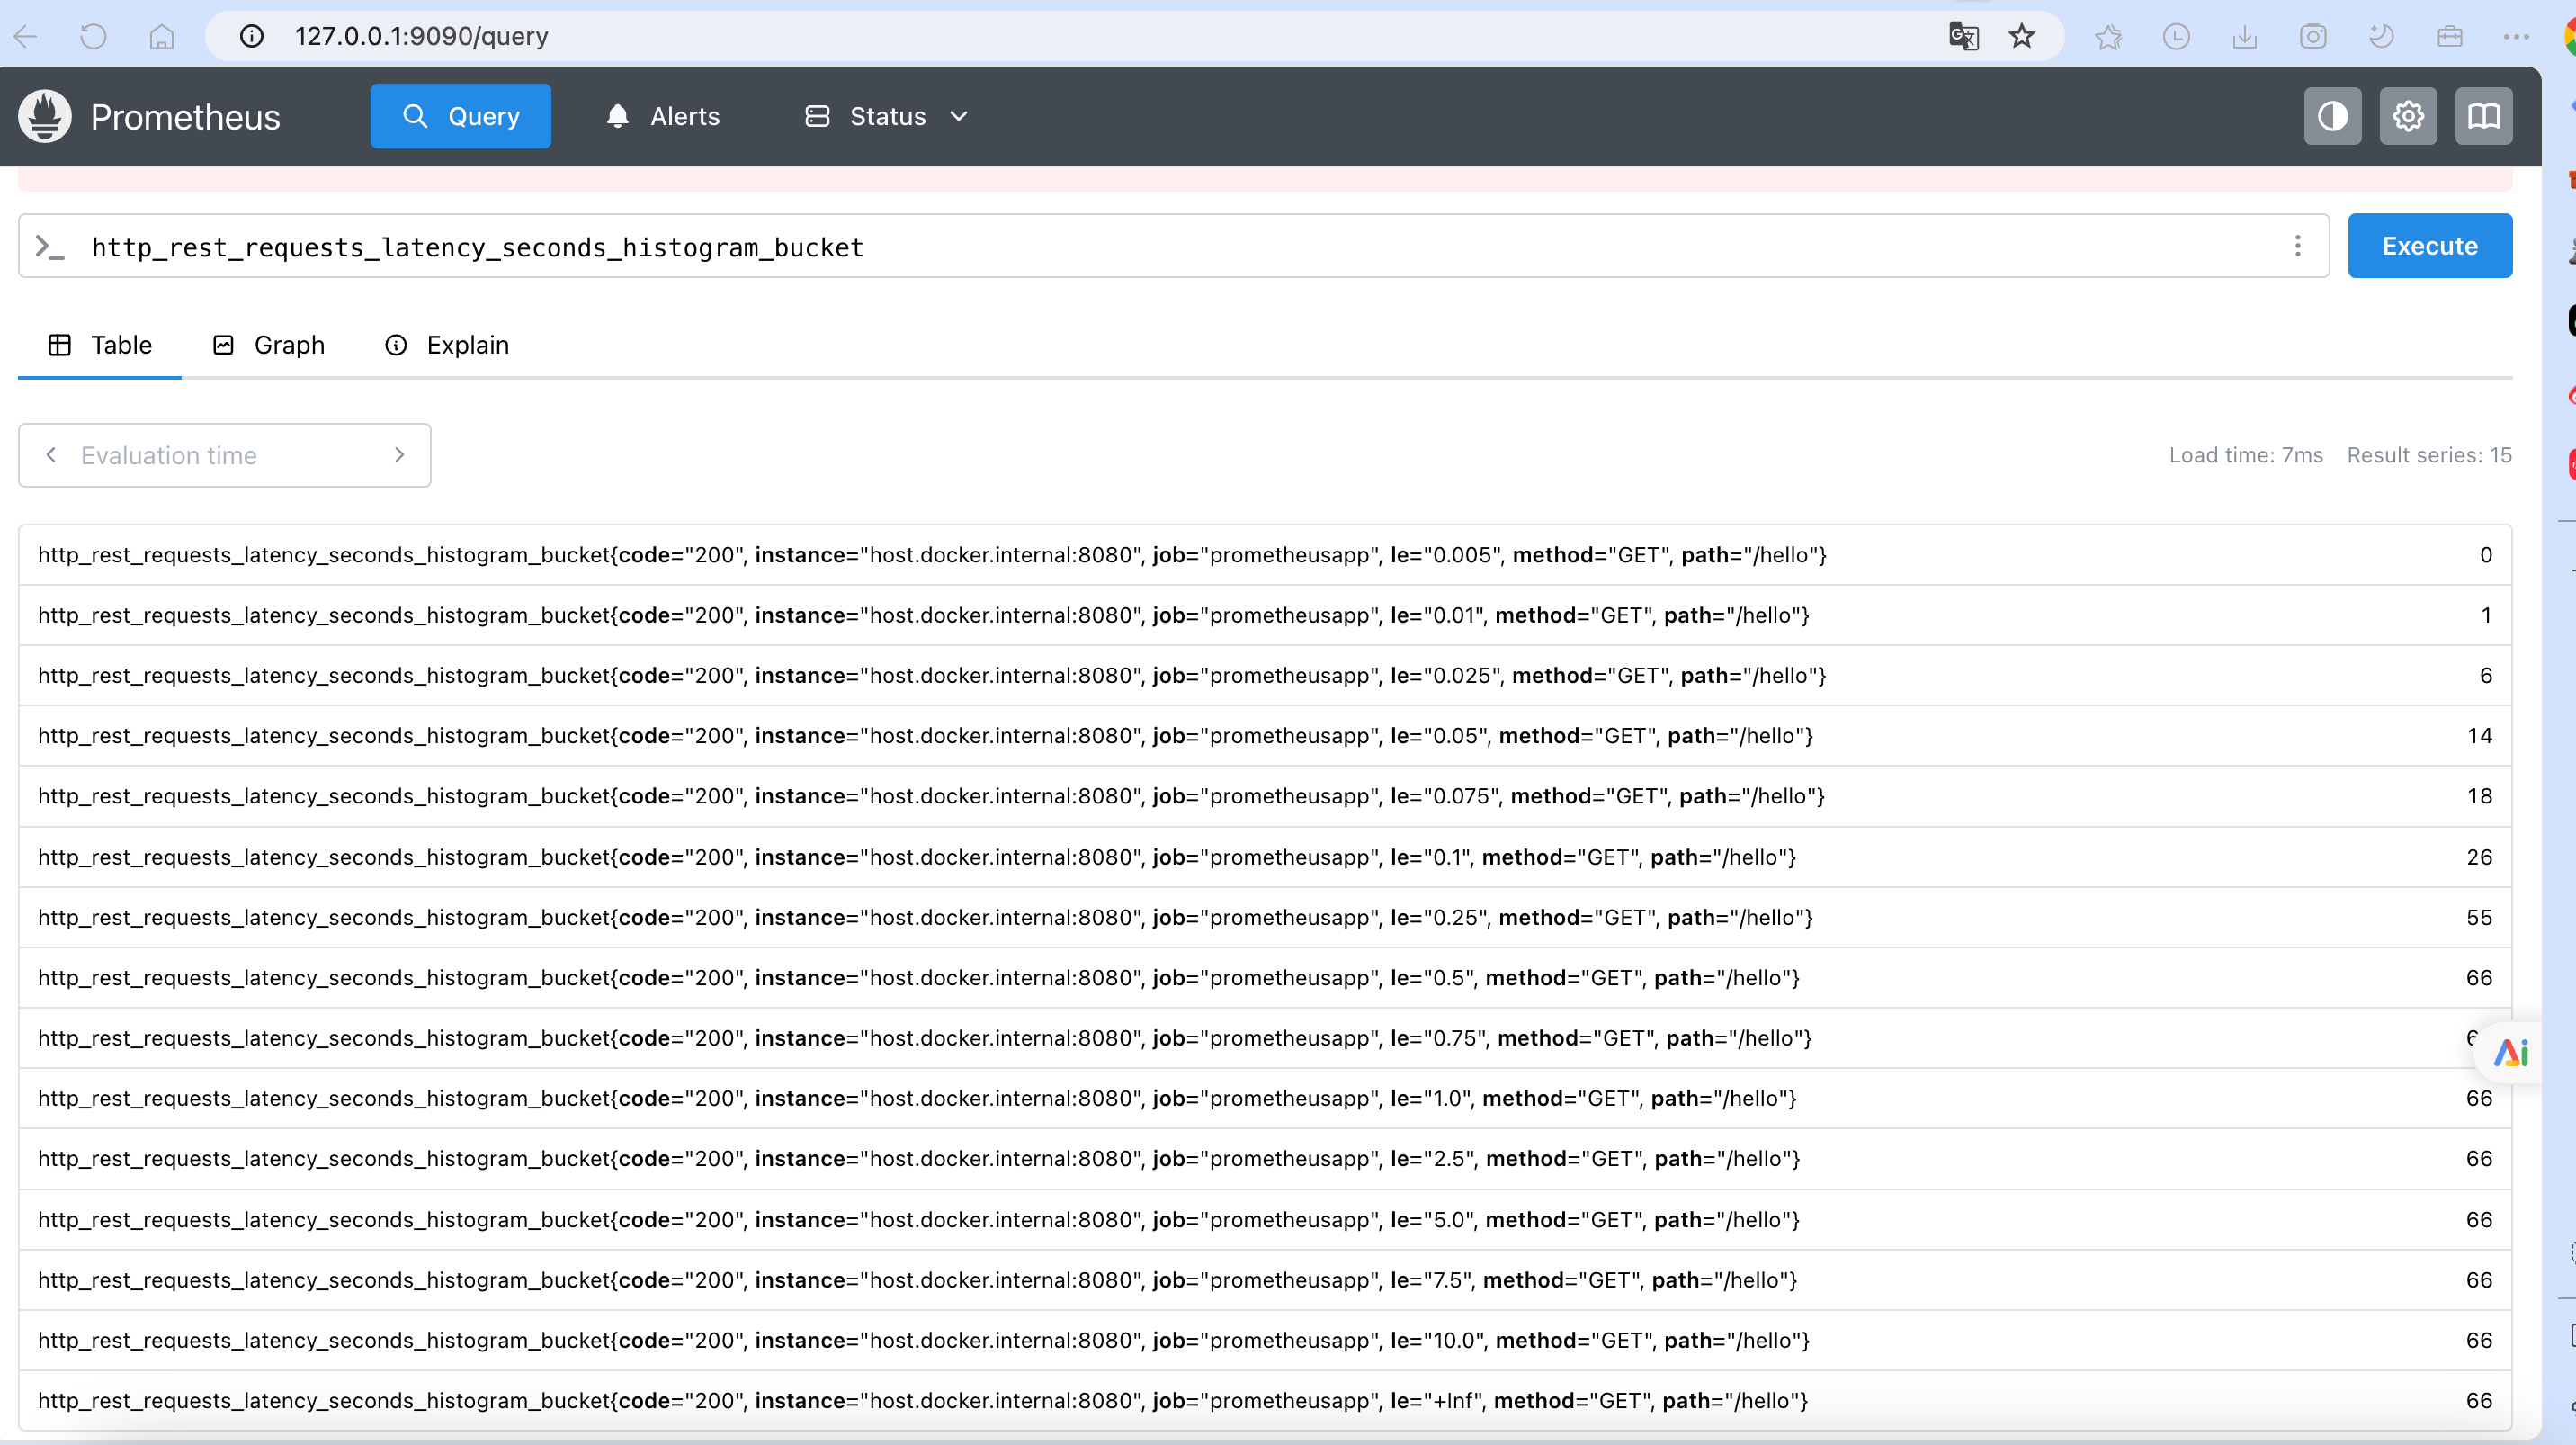
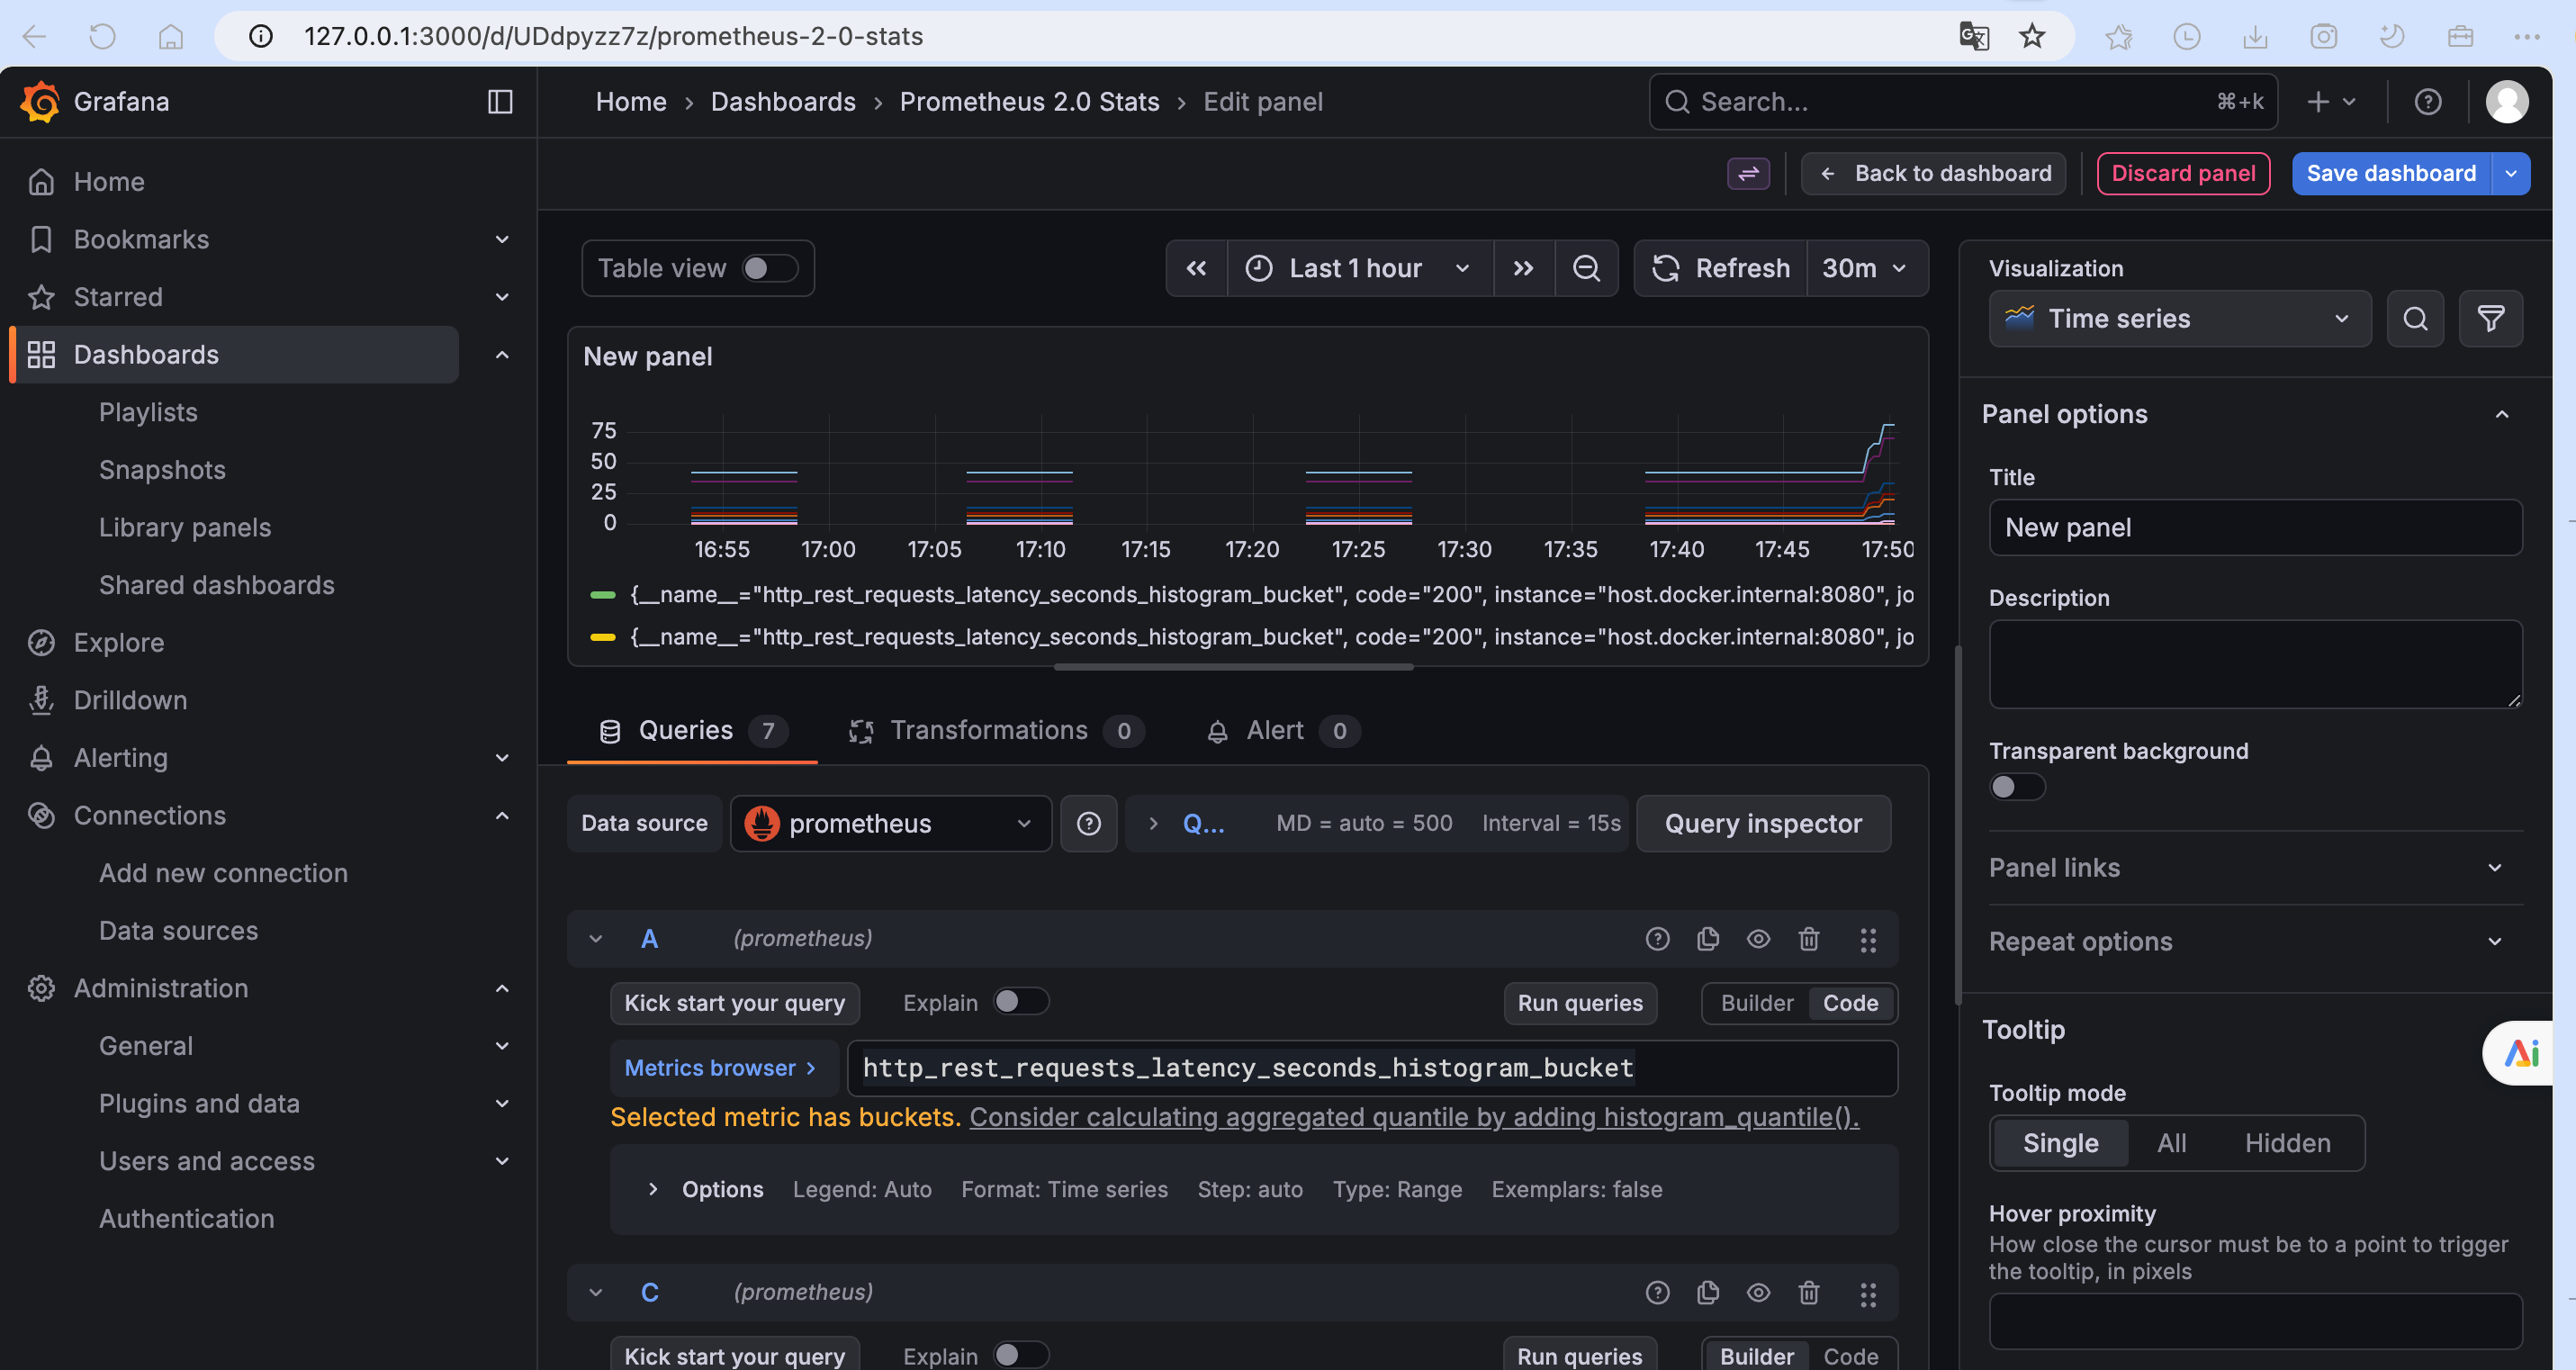
Gauge - 请求耗时直方图:
Histogram
1. Prometheus Metric封装
基于上面的分析,我们这里实现了三种常见的Metric信息上报,这里提供一个统一的封装类,用于获取对应的Metric类型
java
package com.example.demoapp.interceptor;

import io.prometheus.client.CollectorRegistry;
import io.prometheus.client.Counter;
import io.prometheus.client.Gauge;
import io.prometheus.client.Histogram;
import org.springframework.beans.BeansException;
import org.springframework.context.ApplicationContext;
import org.springframework.context.ApplicationContextAware;
import org.springframework.stereotype.Component;

@Component
public class PrometheusComponent implements ApplicationContextAware {
    private static PrometheusComponent instance;
    /**
     * 请求总数
     */
    private Counter reqCounter;
    /**
     * 正在请求的http数量
     */
    private Gauge duringReqGauge;
    /**
     * 直方图,请求分布情况
     */
    private Histogram reqLatencyHistogram;
    @Override
    public void setApplicationContext(ApplicationContext applicationContext) throws BeansException {
        instance = this;
        CollectorRegistry collectorRegistry = applicationContext.getBean(CollectorRegistry.class);
        // 这里指定SpringBoot容器的CollectorRegistry,如果使用默认的会导致无法收集
        reqCounter = Counter.build().name("http_rest_req_total")
                .labelNames("path", "method", "code")
                .help("总的请求计数").register(collectorRegistry);
        duringReqGauge = Gauge.build()
                .name("http_rest_inprogress_req")
                .labelNames("path", "method")
                .help("正在处理的请求数").register(collectorRegistry);
        reqLatencyHistogram = Histogram.build()
                .labelNames("path", "method", "code")
                .name("http_rest_requests_latency_seconds_histogram")
                .help("请求耗时分布")
                .register(collectorRegistry);
    }
    public static PrometheusComponent getInstance() {
        return instance;
    }
    public Counter counter() {
        return reqCounter;
    }
    public Gauge gauge() {
        return duringReqGauge;
    }
    public Histogram histogram() {
        return reqLatencyHistogram;
    }
}
上面实现的特点在于,创建Metric时,就已经定义好了label标签,这里定义了
- path: 请求url路径
- method: http方法, get/post
- code: 状态码,表示请求成功还是异常
2. 拦截器实现自定义信息采集上报
接下来我们实现一个自定义的拦截器,拦截所有的http请求,然后上报关键信息
java
package com.example.demoapp.interceptor;

import io.prometheus.client.Histogram;
import jakarta.servlet.http.HttpServletRequest;
import jakarta.servlet.http.HttpServletResponse;
import org.springframework.web.servlet.HandlerInterceptor;

/**
 * @description: PrometheusInterceptor
 *
 * @author yangyanping
 */
public class PrometheusInterceptor  implements HandlerInterceptor {
    private ThreadLocal<Histogram.Timer> timerThreadLocal = new ThreadLocal<>();

    @Override
    public boolean preHandle(HttpServletRequest request, HttpServletResponse response, Object handler) throws Exception {
        // 正在处理的请求量
        PrometheusComponent.getInstance().gauge().labels(request.getRequestURI(), request.getMethod()).inc();
        timerThreadLocal.set(PrometheusComponent.getInstance().histogram()
                .labels(request.getRequestURI(), request.getMethod(), String.valueOf(response.getStatus()))
                .startTimer());
        return HandlerInterceptor.super.preHandle(request, response, handler);
    }

    @Override
    public void afterCompletion(HttpServletRequest request, HttpServletResponse response, Object handler, Exception ex) throws Exception {
        String uri = request.getRequestURI();
        String method = request.getMethod();
        int status = response.getStatus();
        // count 请求计数,标签分别为 请求路径,请求方法,response http code
        // 请求应用总量:  sum(demo_rest_req_total)
        // 每秒http请求量: sum(rate(demo_rest_req_total[1m])
        // 请求topk的url:  topk(10, sum(demo_rest_req_total) by (path))
        PrometheusComponent.getInstance().counter().labels(uri, method, String.valueOf(status)).inc();
        // 请求完毕,计数器-1
        PrometheusComponent.getInstance().gauge().labels(uri, method).dec();
        // 直方图统计
        Histogram.Timer timer = timerThreadLocal.get();
        if (timer != null) {
            timer.observeDuration();
            timerThreadLocal.remove();
        }

      //  HandlerInterceptor.super.afterCompletion(request, response, handler, ex);
    }
}
这里我们主要关心的就两点
- 执行之前(
preHandle): gauge计数+1,开始计时 - 执行之后 (
afterCompletion): guage计数-1,counter计数+1,计时收集
3. 测试
开发一个启动类DemoAppApplication 和 一个Controller类HelloController
java
package com.example.demoapp;

import com.example.demoapp.interceptor.PrometheusInterceptor;
import io.micrometer.core.instrument.MeterRegistry;
import org.springframework.beans.factory.annotation.Value;
import org.springframework.boot.SpringApplication;
import org.springframework.boot.actuate.autoconfigure.metrics.MeterRegistryCustomizer;
import org.springframework.boot.autoconfigure.SpringBootApplication;
import org.springframework.context.annotation.Bean;
import org.springframework.web.servlet.config.annotation.InterceptorRegistry;
import org.springframework.web.servlet.config.annotation.WebMvcConfigurer;

/**
 * @description: DemoAppApplication
 *
 * @author yangyanping
 */
@SpringBootApplication
public class DemoAppApplication implements WebMvcConfigurer {

    public static void main(String[] args) {
        SpringApplication.run(DemoAppApplication.class, args);
    }

    @Override
    public void addInterceptors(InterceptorRegistry registry) {
        registry.addInterceptor(new PrometheusInterceptor()).addPathPatterns("/**");
    }

    @Bean
    MeterRegistryCustomizer<MeterRegistry> configurer(@Value("${spring.application.name}") String applicationName) {
        return (registry) -> registry.config().commonTags("application", applicationName);
    }
}
java
package com.example.demoapp.controller;

import org.springframework.web.bind.annotation.GetMapping;
import org.springframework.web.bind.annotation.RestController;

import java.util.Random;
import java.util.concurrent.TimeUnit;

/**
 * @description: HelloController
 *
 * @author yangyanping
 */
@RestController
public class HelloController {

    private Random random = new Random();

    @GetMapping("/hello")
    public String hello() {
        int sleep = random.nextInt(300);

        try {
            //Thread.sleep(sleep);
            TimeUnit.MILLISECONDS.sleep(sleep);
        } catch (InterruptedException e) {
            e.printStackTrace();
        }

        return "hello Prometheus: " + sleep + "ms";
    }
}
应用启动之后,访问几次hello的http接口,然后在查看一下metric信息,看是否有我们刚才上报的数据