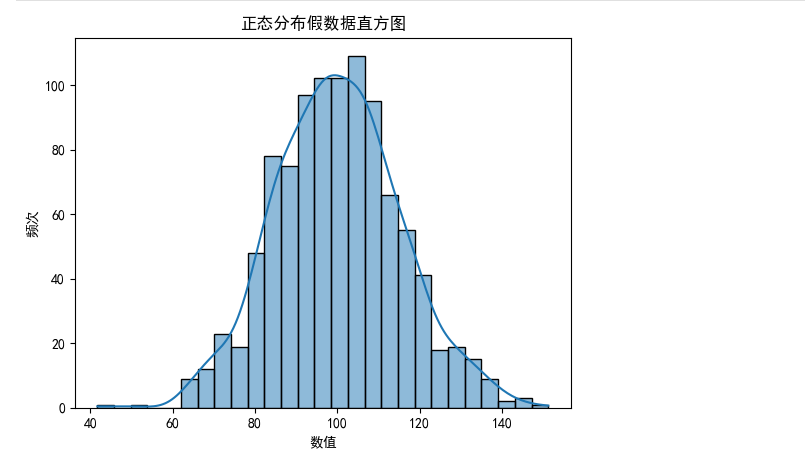
绘制直方图
python
import matplotlib.pyplot as  plt
import seaborn as sns
import numpy as np

plt.rcParams['font.sans-serif'] = ['SimHei', 'Microsoft YaHei', 'WenQuanYi Zen Hei']  # 优先用黑体、微软雅黑等中文字体
plt.rcParams['axes.unicode_minus'] = False  # 解决负号显示问题
# 1. 生成假数据:1000个服从正态分布的随机数,赋值给s1
s1 = np.random.normal(loc=100, scale=15, size=1000)

# 2. 绘制直方图(添加kde=True可显示分布曲线)
sns.histplot(s1, kde=True, color="#1f77b4")

# 3. 美化图表(可选)
plt.title("正态分布假数据直方图")
plt.xlabel("数值")
plt.ylabel("频次")
plt.show()
绘制结果
绘制模仿企鹅喙长分布图
python
import numpy as np
import seaborn as sns
import matplotlib.pyplot as plt

# 设置随机种子保证可复现
np.random.seed(42)

# 生成模拟数据(模仿企鹅喙长分布)
data = np.random.normal(loc=38, scale=3, size=200)

# 1. 密度图
plt.figure(figsize=(6, 4))
sns.kdeplot(data=data, color='#1f77b4', linewidth=2)
plt.title('Density Plot of Bill Length')
plt.xlabel('bill_length_mm')
plt.ylabel('Density')
plt.show()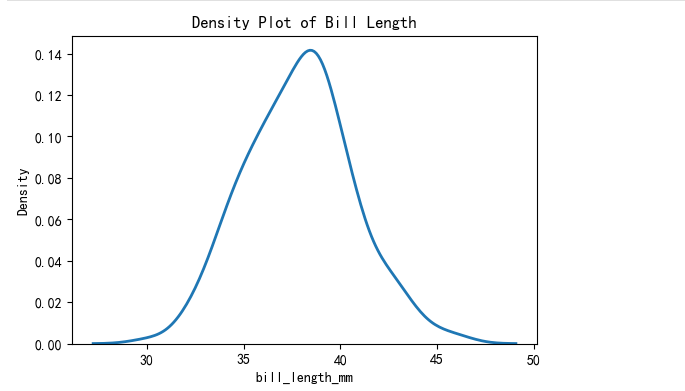
绘制箱线图
python
import numpy as np
import seaborn as sns
import matplotlib.pyplot as plt


np.random.seed(42)
data = np.random.normal(loc=38, scale=3, size=200)

#  箱线图
plt.figure(figsize=(6, 4))
sns.boxplot(data=data, color='#1f77b4')
plt.title('Boxplot of Bill Length')
plt.ylabel('bill_length_mm')
plt.show()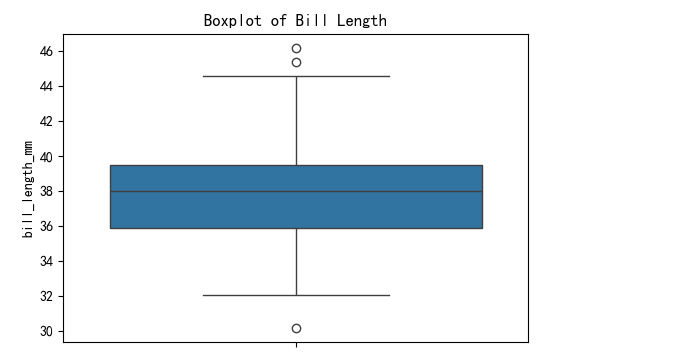
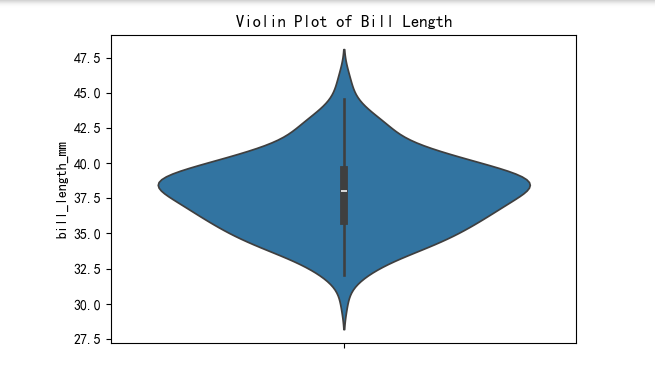
绘制小提琴图
python
import numpy as np
import seaborn as sns
import matplotlib.pyplot as plt

np.random.seed(42)
data = np.random.normal(loc=38, scale=3, size=200)

#  小提琴图
plt.figure(figsize=(6, 4))
sns.violinplot(data=data, color='#1f77b4')
plt.title('Violin Plot of Bill Length')
plt.ylabel('bill_length_mm')
plt.show()