一、算法原理
K均值(K-Means)是一种经典的无监督学习聚类算法,其核心思想是通过迭代将数据划分为 K个簇,使得同一簇内的数据点尽可能相似,不同簇的数据点尽可能不同。它的本质是最小化簇内平方误差(Within-Cluster Sum of Squares, WCSS),即所有数据点到其所属簇中心的距离平方和。
WCSS=∑i=1k∑x∈Ci∣∣x−μi∣∣2 WCSS=\sum\limits_{i=1}^k\sum \limits_{x \in C_i}||x-\mu_i||^2WCSS=i=1∑kx∈Ci∑∣∣x−μi∣∣2
其中,CiC_iCi是第iii个簇,μi\mu_iμi是第iii个簇的中心(均值),xxx为数据。
算法通过迭代优化以下两个步骤来最小化 WCSS:
分配步骤:将每个数据点分配到最近的簇中心。
更新步骤:重新计算每个簇的中心(取簇内所有点的均值)。
1、关键问题
(1) 如何选择初始簇中心?
随机初始化:直接随机选择 K 个数据点作为初始中心。
缺点:可能陷入局部最优(不同初始值导致不同结果)。
改进:使用 K-Means++ 算法,通过概率分布选择初始中心,使中心点尽可能分散。
(2) 如何确定 K的值?
肘部法则(Elbow Method):
尝试不同的 K值,计算对应的 WCSS。
选择 WCSS 下降速度突然变缓的 K(即"肘部"位置)。
轮廓系数(Silhouette Score):衡量数据点与同簇和其他簇的相似性,值越大表示聚类效果越好。
二、参考代码
python
import numpy as np
import matplotlib.pyplot as plt
from sklearn.datasets import make_blobs,make_circles,make_moons

class KMeans:
    def __init__(self, n_clusters=3, max_iter=300, tol=1e-4):
        """
        初始化K均值聚类器

        参数:
        - n_clusters: 聚类数量
        - max_iter: 最大迭代次数
        - tol: 收敛阈值(中心点移动小于此值时停止)
        """
        self.n_clusters = n_clusters
        self.max_iter = max_iter
        self.tol = tol
        self.centroids = None
        self.labels = None

    def fit(self, X):
        """
        训练K均值模型

        参数:
        - X: 输入数据,形状为(n_samples, n_features)
        """
        n_samples, n_features = X.shape

        # 1. 随机初始化中心点
        random_indices = np.random.choice(n_samples, self.n_clusters, replace=False)
        self.centroids = X[random_indices]

        for _ in range(self.max_iter):
            # 2. 分配样本到最近的中心点
            distances = self._compute_distances(X)
            self.labels = np.argmin(distances, axis=1)

            # 3. 保存旧中心点用于收敛检查
            old_centroids = self.centroids.copy()

            # 4. 更新中心点
            for i in range(self.n_clusters):
                cluster_points = X[self.labels == i]
                if len(cluster_points) > 0:
                    self.centroids[i] = np.mean(cluster_points, axis=0)

            # 5. 检查收敛
            centroid_shift = np.linalg.norm(old_centroids - self.centroids)
            if centroid_shift < self.tol:
                break

    def predict(self, X):
        """预测新样本的聚类标签"""
        distances = self._compute_distances(X)
        return np.argmin(distances, axis=1)

    def _compute_distances(self, X):
        """计算每个样本到各中心点的距离"""
        distances = np.zeros((X.shape[0], self.n_clusters))
        for i, centroid in enumerate(self.centroids):
            distances[:, i] = np.linalg.norm(X - centroid, axis=1)
        return distances

    def generate_data(self,n_samples=300, database="linear", n_features=2, centers=3, cluster_std=1.0, random_state=42):
        """
        生成模拟数据(支持多簇的 circles 和 moons)

        参数:
        - n_samples: 总样本数
        - database: 数据类型("linear", "circles", "moons")
        - n_features: 特征维度(仅 make_blobs 支持 >2)
        - centers: 聚类中心数量
        - cluster_std: 聚类标准差(噪声)
        - random_state: 随机种子

        返回:
        - X: 生成的数据
        - y: 真实标签
        """
        np.random.seed(random_state)

        if database == "linear":
            # 线性可分数据(make_blobs 支持多簇)
            X, y = make_blobs(
                n_samples=n_samples,
                n_features=n_features,
                centers=centers,
                cluster_std=cluster_std,
                random_state=random_state
            )

        elif database == "circles":
            # 生成多个同心圆(每个 circle 有 2 个簇,组合后调整标签)
            X, y = [], []
            for i in range(centers // 2):  # 每 2 个簇一组
                X_circle, y_circle = make_circles(
                    n_samples=n_samples // centers * 2,  # 均匀分配样本
                    factor=0.3 + i * 0.2,  # 不同半径
                    noise=cluster_std,
                    random_state=random_state + i
                )
                # 平移圈子,使它们不重叠
                X_circle += np.random.randn(2) * 2 * (i + 1)  # 随机平移
                X.append(X_circle)
                y.append(y_circle + i * 2)  # 调整标签,避免重叠

            X = np.vstack(X)
            y = np.concatenate(y)
            # 如果 centers 是奇数,额外添加一个簇(用 make_blobs)
            if centers % 2 == 1:
                X_blob, y_blob = make_blobs(
                    n_samples=n_samples // centers,
                    centers=1,
                    cluster_std=cluster_std,
                    random_state=random_state + 100
                )
                X_blob += np.random.randn(2) * 3  # 平移
                X = np.vstack([X, X_blob])
                y = np.concatenate([y, y_blob + max(y) + 1])

        elif database == "moons":
            # 生成多个月亮(每个 moon 有 2 个簇,组合后调整标签)
            X, y = [], []
            for i in range(centers // 2 + centers % 2):  # 每 2 个簇一组
                X_moon, y_moon = make_moons(
                    n_samples=n_samples // centers * 2,
                    noise=cluster_std,
                    random_state=random_state + i
                )
                # 平移月亮,使它们不重叠
                X_moon += np.array([i * 3, i * 2])  # 横向平移
                X.append(X_moon)
                y.append(y_moon + i * 2)  # 调整标签

            X = np.vstack(X)
            y = np.concatenate(y)
            # 如果 centers 是奇数,额外添加一个簇(用 make_blobs)
            if centers % 2 == 1:
                X_blob, y_blob = make_blobs(
                    n_samples=n_samples // centers,
                    centers=1,
                    cluster_std=cluster_std,
                    random_state=random_state + 100
                )
                X_blob += np.random.randn(2) * 2  # 平移
                X = np.vstack([X, X_blob])
                y = np.concatenate([y, y_blob + max(y) + 1])

        else:
            raise ValueError("database 必须是 'linear', 'circles', 或 'moons'")

        return X, y

    def plot_clusters(self,X, labels=None, centroids=None, title="K-means Clustering"):
        """
        可视化聚类结果

        参数:
        - X: 输入数据
        - labels: 聚类标签
        - centroids: 中心点坐标
        - title: 图表标题
        """
        plt.figure(figsize=(8, 6))

        if labels is not None:
            # 绘制不同聚类的点
            plt.scatter(X[:, 0], X[:, 1], c=labels, cmap='viridis', s=50, alpha=0.7, edgecolor='k')
        else:
            # 如果没有标签,只绘制数据点
            plt.scatter(X[:, 0], X[:, 1], s=50, alpha=0.7, edgecolor='k')

        # 绘制中心点
        if centroids is not None:
            plt.scatter(centroids[:, 0], centroids[:, 1], c='red', s=200, marker='X', edgecolor='k', linewidth=1)

        plt.title(title)
        plt.xlabel("Feature 1")
        plt.ylabel("Feature 2")
        plt.grid(True)
        plt.show()
三、算法评价
1、应用场景:
基因表达数据分析(发现基因功能层次)。
文档聚类(构建主题层次结构)。
图像分割(基于像素相似性合并区域)。
社交网络分析(发现社区层次)。
2、优点:
简单高效,适用于大规模数据。
收敛速度快(通常只需少量迭代)。
3、缺点:
需要预先指定 K。
对初始中心敏感,可能陷入局部最优。
假设簇是凸形的(对非凸簇效果差)。
对异常值敏感(中心点受极端值影响)。
四、凹簇和非凹簇数据集
1、凹簇
数据生成参数:n_samples=1000, database="linear", centers=6, cluster_std=1, random_state=42
K=6
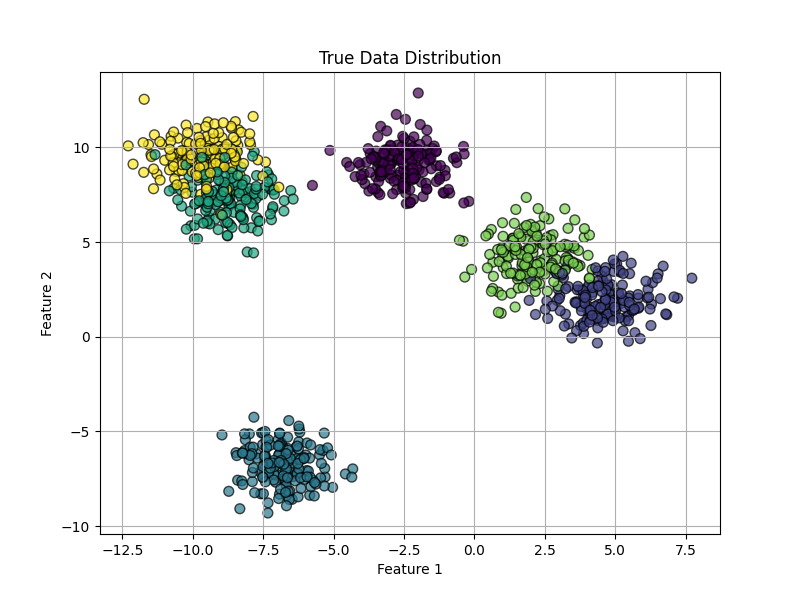
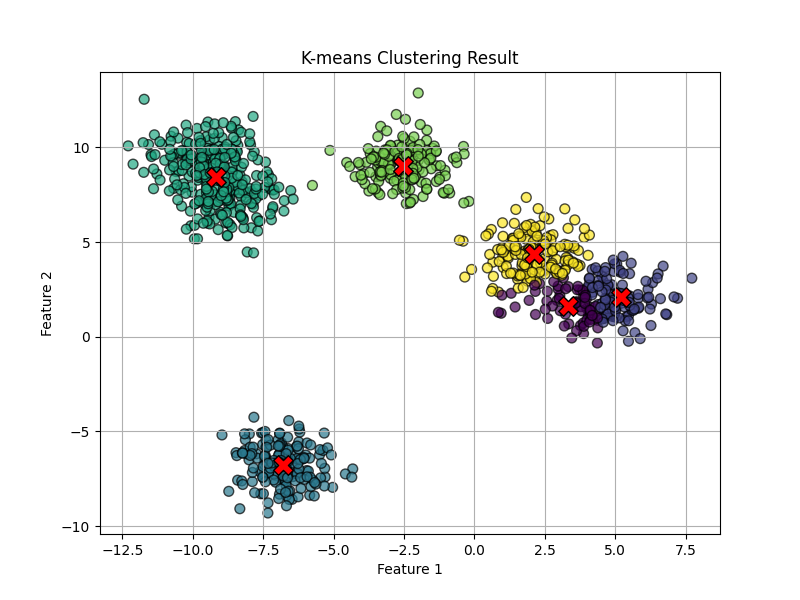
从结果可以看出,模型训练遇到了局部最优的情况。将两个比较接近的簇分为了一类,而将另一个簇分成了两个簇。但整体上,聚类也比较成功。
2、非凹簇
数据生成参数:n_samples=1000, database="circles", centers=6, cluster_std=1, random_state=42
K=6。
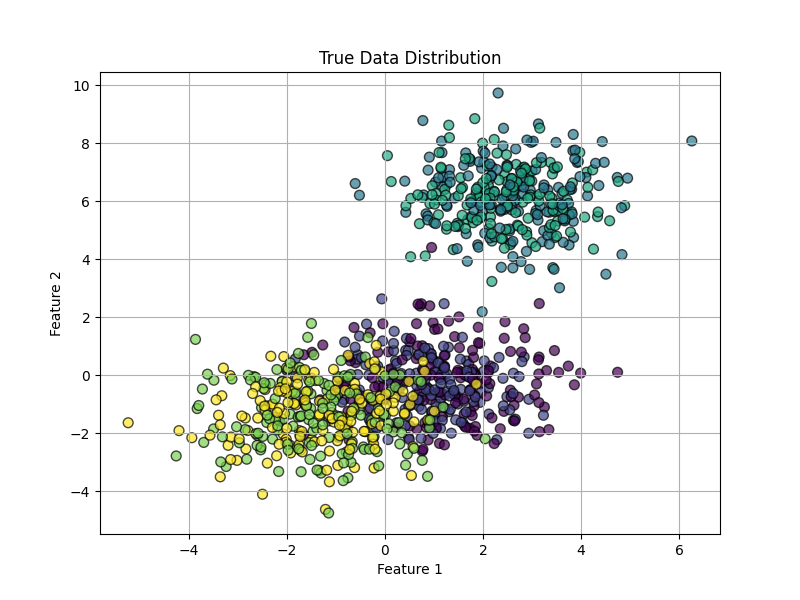
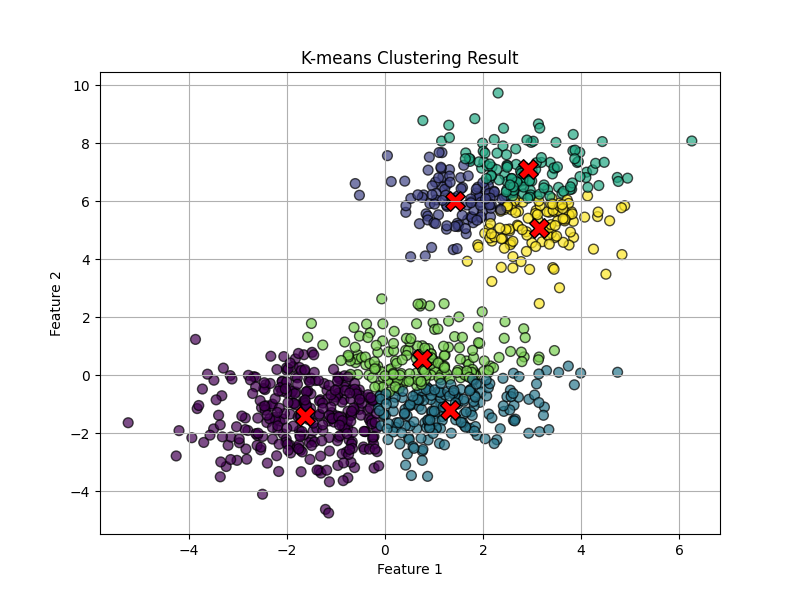
不难看出,对于非凹簇,K均值算法的聚类效果非常差。