Prometheus官⽹https://prometheus.io/download/
1.文件下载到本地,用Windows cmd 上传到linux,ip为linux ip 地址

2.linux操作
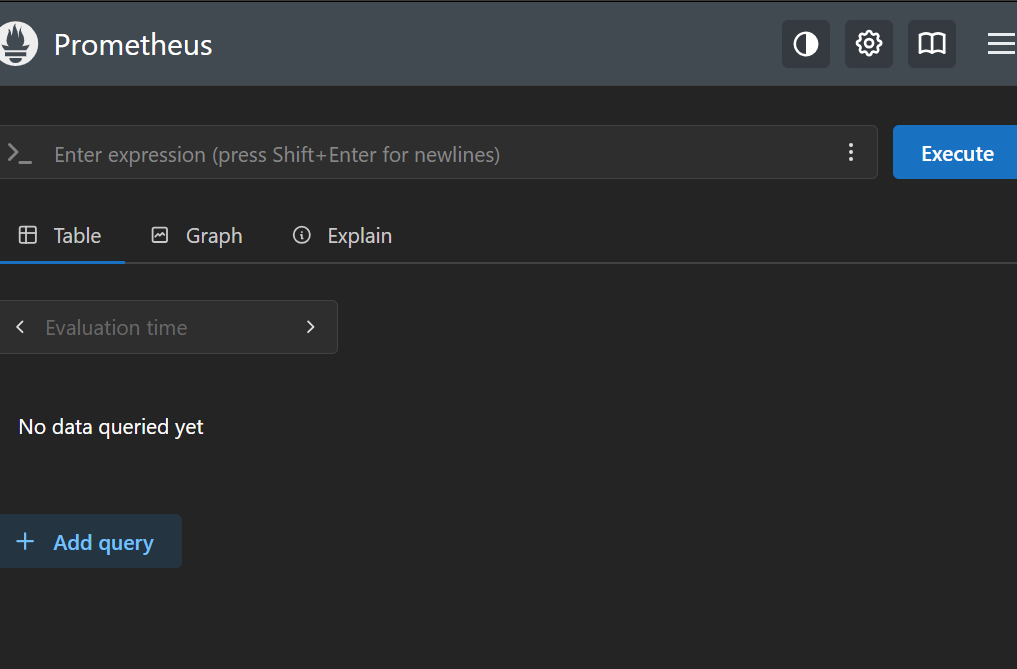
完成效果:
2.Node exporte
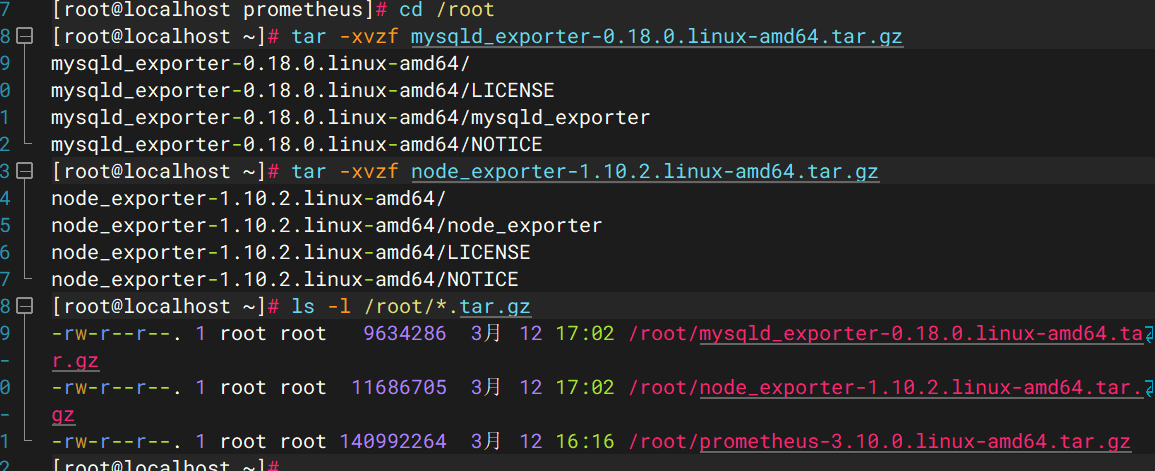
Node exporte主要⽤于采集被监控主机上的cpu负载,内存的使⽤情况,⽹络等数据,并上报数据给Prometheus server。从Prometheus官⽹https://prometheus.io/download/ 下载node_exporter,下载之后解压缩然后直接运⾏即可。
[root@localhost ~]# tar zxvf node_exporter-1.5.0.linux-amd64.tar.gz
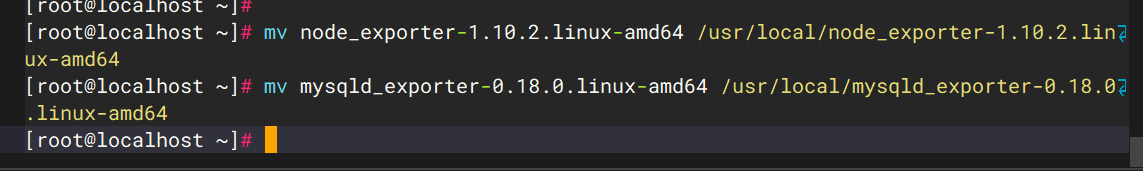
[root@localhost ~]# mv node_exporter-1.5.0.linux-amd64 /usr/local/node_exporter
[root@localhost ~]# cd /usr/local/node_exporter
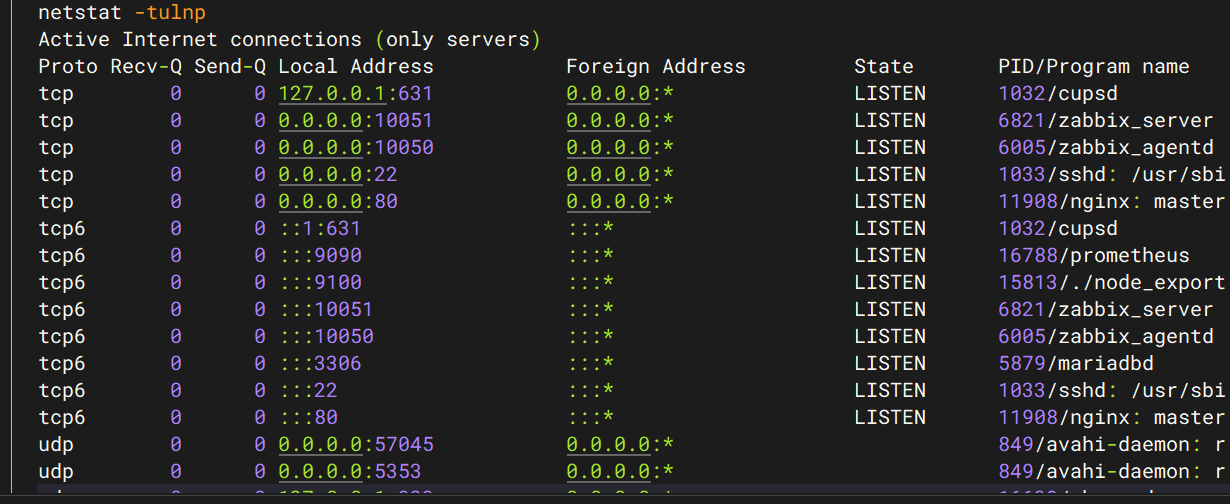
[root@localhost node_exporter]# nohup ./node_exporter &运⾏起来以后 我们使⽤"netstats -tnlp"命令可以来看下 node_exporter进程的状态,node_exporter默认监听在9100端⼝,要关闭被监控机上的防⽕墙、selinux等,确保node_exporter可以响应prometheus_server发过来的HTTP_GET请求,也可以响应其他⽅式的HTTP_GET请求,最简单的⽅式,在浏览器打开:http://"node_exporter所在服务器的IP地址":9100/metrics , 看是否有初始Node Exporter监控指标⽣成