Cesium 实现台风可视化的实现思路
在气象数据可视化领域,台风也是一种常见的需求,本文将基于和风天气API提供的台风数据和Cesium实现台风气象可视化。
实现思路:
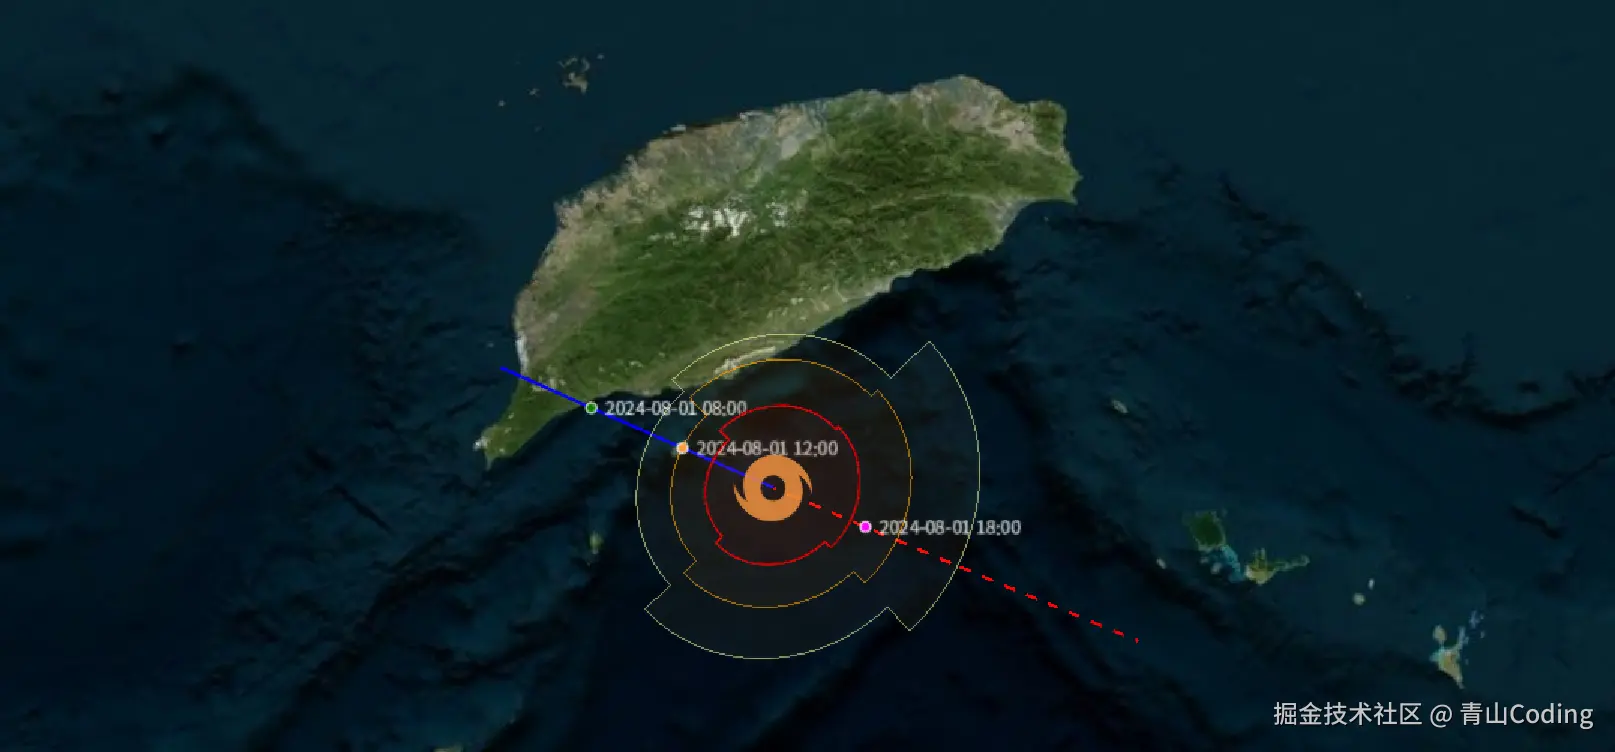
根据中国气象台台风网显示效果,请看下图,大致可分为台风历史路径,台风未来路径,台风当前所在位置这三种,路径和关键点(风力加强/减弱)很好实现,就是简单的线点的是entity实体创建,稍微麻烦的点是台风的旋转和7级、10级、12级风圈的绘制。至于台风路径回放功能,这个到后面做ceisum物体移动的时候再进行详细介绍,下面对台风气象图进行一一拆解实现最后封装成一个完整的台风控制类。
台风等级: 做好初始准备工作,统一样式管理。引入对应的台风图标,做好台风等级的颜色和图片映射。
js
// 图片可以去阿里巴巴图标库进行下载
import blue from '@/assets/img/typhoon/blue.png'
import yellow from '@/assets/img/typhoon/yellow.png'
import origin from '@/assets/img/typhoon/origin.png'
import red from '@/assets/img/typhoon/red.png'
import green from '@/assets/img/typhoon/green.png'
import pink from '@/assets/img/typhoon/pink.png'

// 配置项优化:统一管理样式和常量,支持外部部分覆盖
const DEFAULT_OPTIONS = {
    solid: {
        width: 2.0,
        color: '#005999',
        show: true // 控制历史路径显示
    },
    dashed: {
        width: 2.0,
        color24: '#FF0000',
        dashLength: 16,
        gapLength: 8,
        show: true // 控制未来路径显示
    },
    keyPoint: {
        pixelSize: 5,
        outlineWidth: 1,
        show: true, // 控制关键点显示
        label: {
            // 关键点标签配置
            show: true,
            font: '12px sans-serif',
            pixelOffset: new cesium.Cartesian2(10, 0),
            horizontalOrigin: cesium.HorizontalOrigin.LEFT
        }
    },
    typhoon: {
        rotationStep: 0.01, // 旋转速度
        opacity: 0.8, // 透明度
        show: true // 控制台风标识显示
    }
}

// 等级映射
const COLORMAP = {
    TD: '#eed139', // 热带低压 - 黄色
    TS: '#0000ff', // 热带风暴 - 蓝色
    STS: '#0f8000', // 强热带风暴 - 绿色
    TY: '#fe9c45', // 台风 - 橙色
    STY: '#fe00fe', // 强台风 - 粉色
    SuperTY: '#fe0000' // 超强台风 - 红色
}
// 图片映射
const TYPEIMAGE = {
    TD: yellow, // 热带低压 - 黄色
    TS: blue, // 热带风暴 - 蓝色
    STS: green, // 强热带风暴 - 橙色
    TY: origin, // 台风 - 橙色
    STY: pink, // 强台风 - 红色
    SuperTY: red // 超强台风 - 红色
}
创建台风管理类: 因为在全球范围内,台风的数量是不确定的,所以创建统一的管理类进行控制。
js
class TyphoonManagement{
 constructor(viewer) {
        this.viewer = viewer || window.viewer
        if (!this.viewer) {
            throw new Error('缺少Cesium Viewer实例')
        }
        // 合并配置
        this.options = {
            ...DEFAULT_OPTIONS
        }
        // 初始化实体容器
        this.entityList = []
        this.parent = this.viewer.entities.add({
            name: '台风管理根节点',
            show: true
        })
        // 旋转状态管理
        this.rotation = cesium.Math.toRadians(30)
    }
}
初始化台风和风圈: 前面就提到稍微麻烦就在这里,仔细观察气象台风网就可以看到,台风的图标是旋转的,其次是风圈的绘制,风圈不是一个完整的圆圈,而是根据四个方向的台风的影响范围绘制的,这四个方向分别是四象限:东北/东南/西南/西北。
绘制台风:关键在于台风图标的旋转,这里有两个关键的属性,一个是材质属性material,其次是两个旋转属性rotation:一个数值属性,指定椭圆从正北方向逆时针旋转的角度。与stRotation:一个数值属性,指定椭圆纹理从正北方向逆时针旋转的角度。,,那就使用最简单的方式进行实现,CallbackProperty(()=>{}),二者同步旋转以做到台风旋转。
js
/**
  * 创建台风标识
  * @param {Array} data - 台风当前状态数据数组
  */
 createTyphoon(item) {
     if (!this._validatePointData(item)) return
     const { type } = item
     const typhoonConfig = this.options.typhoon
     // 获取图片材质并设置透明度
     const imageMaterial = new cesium.ImageMaterialProperty({
         image: TYPEIMAGE[type] || TYPEIMAGE.TD,
         transparent: true,
         color: new cesium.Color(1, 1, 1, typhoonConfig.opacity)
     })

     const typhoonEntity = this.viewer.entities.add({
         name: `台风标识(${type})`,
         parent: this.parent,
         position: cesium.Cartesian3.fromDegrees(Number(item.lon), Number(item.lat)),
         ellipse: {
             semiMinorAxis: 30000.0,
             semiMajorAxis: 30000.0,
             height: 10.0,
             material: imageMaterial,
             // 关键:台风旋转实现,使用CallbackProperty
             rotation: new cesium.CallbackProperty(() => {
                 this.rotation += typhoonConfig.rotationStep
                 return this.rotation
             }, false),
             stRotation: new cesium.CallbackProperty(() => {
                 return this.rotation
             }, false),
             heightReference: cesium.HeightReference.RELATIVE_TO_GROUND,
             zIndex: 10
         }
     })
} 绘制风圈:关键是对数据的理解,因为返回的数据是是四个方向的风力影响半径,单位是KM且这四个方向是:东北/东南/西南/西北。所以真实的风圈是根据风力影响半径分别绘制四个方向的的多边形最后进行组合。所以根据台风当前的位置和四个方向上的三级风圈的影响半径分别计算多边形的经纬度进行进行组合即可。
数学逻辑计算公式:
plaintext
单位转换(公里--->经纬度):公里 / 111
    地球一圈是40000km,360°,所以一度近似等于111公里,这里转换只是将以半径单位为km画弧转为单位以经度画弧,主要是为经纬度偏移计算做铺垫。
四象限分段绘制:四个象限对应不同影响范围即影响半径不同,所以绘制的椭圆不同
    0°~90°   →  东北 NE
    90°~180° →  东南 SE
    180°~270°→  西南 SW
    270°~360°→  西北 NW
经纬度偏移计算:
    经度偏移 = 半径 × sin(角度) sin负责经度偏移
    纬度偏移 = 半径 × cos(角度) cos负责维度偏移
风圈绘制代码实现如下:
js
    drawWindCircles(viewer, now, entityList) {
     // 检查必要参数
     if (!viewer || !now || !entityList) {
         console.error('缺少必要参数,无法绘制风圈')
         return
     }

     // 风圈配置 - 对应不同风力等级(30kt, 50kt, 64kt)
     const windCircleConfigs = [
         {
             level: 30,
             data: now.windRadius30,
             color: new cesium.Color(1, 1, 0.6, 0.04), // 浅黄色半透明
             outlineColor: new cesium.Color(1, 1, 0.6, 0.8),
             outlineWidth: 2
         },
         {
             level: 50,
             data: now.windRadius50,
             color: new cesium.Color(1, 0.6, 0, 0.05), // 橙色半透明
             outlineColor: new cesium.Color(1, 0.6, 0, 0.9),
             outlineWidth: 3
         },
         {
             level: 64,
             data: now.windRadius64,
             color: new cesium.Color(1, 0, 0, 0.05), // 红色半透明
             outlineColor: new cesium.Color(1, 0, 0, 1),
             outlineWidth: 4
         }
     ]

     // 台风中心坐标
     const center = [parseFloat(now.lon), parseFloat(now.lat)]
     if (isNaN(center[0]) || isNaN(center[1])) {
         console.error('无效的台风中心坐标')
         return
     }

     // 逐个绘制风圈
     windCircleConfigs.forEach((config) => {
         // 跳过无数据的风圈
         if (!config.data || !config.data.neRadius) return

         // 解析四象限半径(公里转度)
         const radius = {
             ne: parseFloat(config.data.neRadius) / 111, // 1度≈111公里
             se: parseFloat(config.data.seRadius) / 111,
             sw: parseFloat(config.data.swRadius) / 111,
             nw: parseFloat(config.data.nwRadius) / 111
         }

         // 验证半径数据
         if (Object.values(radius).some((r) => isNaN(r) || r <= 0)) {
             console.warn(`跳过无效的${config.level}kt风圈数据`)
             return
         }

         // 计算风圈多边形顶点
         const points = []
         this.calculateQuadrantPoints(center, radius.ne, 0, points) // 东北象限(0°-90°)
         this.calculateQuadrantPoints(center, radius.se, 90, points) // 东南象限(90°-180°)
         this.calculateQuadrantPoints(center, radius.sw, 180, points) // 西南象限(180°-270°)
         this.calculateQuadrantPoints(center, radius.nw, 270, points) // 西北象限(270°-360°)

         // 绘制风圈多边形
         if (points.length > 0) {
             const windCircle = viewer.entities.add({
                 parent: this.parent,
                 name: `wind_circle_${config.level}kt`,
                 polygon: {
                     hierarchy: cesium.Cartesian3.fromDegreesArray(points),
                     material: config.color,
                     extrudedHeight: 0, // 风圈高度
                     outline: true,
                     outlineColor: config.outlineColor,
                     outlineWidth: config.outlineWidth,
                     // 显示层级 - 确保强风圈在顶层
                     zIndex: 1
                 }
             })
             entityList.push(windCircle)
         }
     })
 }
 calculateQuadrantPoints(center, radius, startAngle, points) {
     const pointCount = 30 // 每个象限采样点数量(越多越平滑)
     const endAngle = startAngle + 90 // 每个象限覆盖90度

     for (let i = 0; i <= pointCount; i++) {
         // 计算当前角度(弧度)
         const angle = cesium.Math.toRadians(startAngle + ((endAngle - startAngle) * i) / pointCount)

         // 计算经纬度偏移
         const lonOffset = radius * Math.sin(angle)
         const latOffset = radius * Math.cos(angle)

         // 计算最终坐标并添加到点数组
         points.push(center[0] + lonOffset)
         points.push(center[1] + latOffset)
     }
 }
绘制历史/未来台风路径与关键点:这里可以根据实际需求进行绘制,不做过多介绍!
js
    /**
  * 创建路径线(历史/未来)
  * @param {Array} positions - 经纬度坐标数组
  * @param {boolean} isHistory - 是否为历史路径(true:实线,false:虚线)
  */
 createLine(data, isHistory) {
     const lineConfig = isHistory ? this.options.solid : this.options.dashed
     let material = null
     if (isHistory) {
         material = cesium.Color.fromCssColorString(COLORMAP[data.type])
     } else {
         material = new cesium.PolylineDashMaterialProperty({
             color: cesium.Color.fromCssColorString(lineConfig.color24),
             dashLength: lineConfig.dashLength,
             gapLength: lineConfig.gapLength
         })
     }
     const line = this.viewer.entities.add({
         parent: this.parent,
         name: isHistory ? '台风历史路径' : '台风预测路径',
         polyline: {
             positions: isHistory ? data.coordinates : data,
             width: lineConfig.width,
             material: material,
             clampToGround: true,
             show: lineConfig.show
         }
     })

     this.entityList.push(line)
 }

 /**
  * 创建关键点(如不同时间点的位置)
  * @param {Object} data - 关键点数据 { lon, lat, type, time, wind }
  */
 createKeyPoint(data) {
     // 数据验证
     if (!this._validatePointData(data)) return

     const { lon, lat, type, time, fxTime, uniqueId } = data
     const pointConfig = this.options.keyPoint
     // const formattedTime = formatDate(time || fxTime, 'YYYY-MM-DD HH:mm')
     const point = this.viewer.entities.add({
         parent: this.parent,
         name: `台风关键点(${time})`,
         id: uniqueId,
         position: cesium.Cartesian3.fromDegrees(Number(lon), Number(lat)),
         point: {
             pixelSize: pointConfig.pixelSize,
             color: cesium.Color.fromCssColorString(COLORMAP[type] || COLORMAP.TD),
             outlineColor: cesium.Color.WHITE,
             outlineWidth: pointConfig.outlineWidth,
             show: pointConfig.show
         },
         // 关键点标签
         label: {
             text: time, //  formattedTime
             font: pointConfig.label.font,
             pixelOffset: pointConfig.label.pixelOffset,
             horizontalOrigin: pointConfig.label.horizontalOrigin,
             backgroundColor: cesium.Color.BLACK.withAlpha(0.5),
             padding: new cesium.Cartesian2(5, 5),
             show: pointConfig.show,
             distanceDisplayCondition: new cesium.DistanceDisplayCondition(10000,4100000)
         }
     })

     this.entityList.push(point)
 }
模拟数据如下:根据和风天气API返回的数据进行处理后模拟数据,后续以实际开发数据为准!
js
const mockTyphoonData = [
 {
     // 单条台风数据(支持多台风,数组可包含多个对象)
     history: [
         // 历史路径(实线)
         {
             type: 'TS', // 热带风暴(对应COLORMAP的蓝色)
             coordinates: cesium.Cartesian3.fromDegreesArray([
                 120.5, 22.3,
                 121.0, 22.5,
                 121.5, 22.7,
                 122.0, 22.9
             ])
         }
     ],
     future: cesium.Cartesian3.fromDegreesArray([
         // 未来路径(虚线)
         122.0, 22.9,
         122.5, 23.1,
         123.0, 23.3,
         123.5, 23.5,
         124.0, 23.7
     ]),
     now: {
         // 当前台风核心信息
         lon: 122.0, // 中心经度
         lat: 22.9, // 中心纬度
         type: 'TY', // 台风等级(对应TYPEIMAGE的origin图片)
         // 风圈半径数据(30/50/64kt,四象限:东北/东南/西南/西北)
         windRadius30: {
             neRadius: 120, // 东北象限半径(公里)
             seRadius: 100,
             swRadius: 80,
             nwRadius: 90
         },
         windRadius50: {
             neRadius: 80,
             seRadius: 70,
             swRadius: 60,
             nwRadius: 75
         },
         windRadius64: {
             neRadius: 50,
             seRadius: 45,
             swRadius: 40,
             nwRadius: 48
         }
     },
     keyPoints: [
         // 台风关键点(如不同时间节点的位置)
         {
             lon: 121.0,
             lat: 22.5,
             type: 'STS', // 强热带风暴
             time: '2024-08-01 08:00', // 时间
             fxTime: '2024-08-01 08:00', // 备用时间
             uniqueId: 'typhoon_key_001' // 唯一标识
         },
         {
             lon: 121.5,
             lat: 22.7,
             type: 'TY',
             time: '2024-08-01 12:00',
             fxTime: '2024-08-01 12:00',
             uniqueId: 'typhoon_key_002'
         },
         {
             lon: 122.5,
             lat: 23.1,
             type: 'STY', // 强台风
             time: '2024-08-01 18:00',
             fxTime: '2024-08-01 18:00',
             uniqueId: 'typhoon_key_003'
         }
     ]
 }
];
完整代码台风管理类:
kotlin
import * as cesium from 'cesium'
// import { formatDate } from '@/utils'

import blue from '@/assets/img/typhoon/blue.png'
import yellow from '@/assets/img/typhoon/yellow.png'
import origin from '@/assets/img/typhoon/origin.png'
import red from '@/assets/img/typhoon/red.png'
import green from '@/assets/img/typhoon/green.png'
import pink from '@/assets/img/typhoon/pink.png'

// 配置项优化:统一管理样式和常量,支持外部部分覆盖
const DEFAULT_OPTIONS = {
 solid: {
     width: 2.0,
     color: '#005999',
     show: true // 控制历史路径显示
 },
 dashed: {
     width: 2.0,
     color24: '#FF0000',
     dashLength: 16,
     gapLength: 8,
     show: true // 控制未来路径显示
 },
 keyPoint: {
     pixelSize: 5,
     outlineWidth: 1,
     show: true, // 控制关键点显示
     label: {
         // 关键点标签配置
         show: true,
         font: '12px sans-serif',
         pixelOffset: new cesium.Cartesian2(10, 0),
         horizontalOrigin: cesium.HorizontalOrigin.LEFT
     }
 },
 typhoon: {
     rotationStep: 0.01, // 旋转速度
     opacity: 0.8, // 透明度
     show: true // 控制台风标识显示
 }
}

// 等级映射
const COLORMAP = {
 TD: '#eed139', // 热带低压 - 黄色
 TS: '#0000ff', // 热带风暴 - 蓝色
 STS: '#0f8000', // 强热带风暴 - 绿色
 TY: '#fe9c45', // 台风 - 橙色
 STY: '#fe00fe', // 强台风 - 粉色
 SuperTY: '#fe0000' // 超强台风 - 红色
}
// 图片映射
const TYPEIMAGE = {
 TD: yellow, // 热带低压 - 黄色
 TS: blue, // 热带风暴 - 蓝色
 STS: green, // 强热带风暴 - 橙色
 TY: origin, // 台风 - 橙色
 STY: pink, // 强台风 - 红色
 SuperTY: red // 超强台风 - 红色
}

export class TyphoonManagement {
 /**
  * 台风管理类,负责台风相关实体的创建、更新和删除
  * @param {cesium.Viewer} viewer - cesium viewer实例
  * @param {Object} options - 配置项,可部分覆盖默认配置
  */
 constructor(viewer) {
     this.viewer = viewer || window.viewer
     if (!this.viewer) {
         throw new Error('缺少Cesium Viewer实例')
     }

     // 合并配置
     this.options = {
         ...DEFAULT_OPTIONS
     }

     // 初始化实体容器
     this.entityList = []
     this.parent = this.viewer.entities.add({
         name: '台风管理根节点',
         show: true
     })

     // 旋转状态管理
     this.rotation = cesium.Math.toRadians(30)
 }

 /**
  * 初始化台风数据,创建所有相关实体
  * @param {Array} data - 台风数据数组
  */
 initTyphoon(data) {
     // 先清除已有实体,避免重复
     this.clearTyphoon()
     const points = []
     if (!Array.isArray(data)) {
         console.warn('台风数据格式错误,应为数组')
         return
     }

     data.forEach((item) => {
         // 创建历史路径(实线)
         if (this.options.solid.show && item.history?.length) {
             item.history.forEach((history) => {
                 this.createLine(history, true)
             })
         }

         // 创建未来路径(虚线)
         if (this.options.dashed.show && item.future?.length) {
             this.createLine(item.future, false)
         }

         // 创建当前台风标识
         if (this.options.typhoon.show && item.now) {
             this.drawWindCircles(this.viewer, item.now, this.entityList)
             this.createTyphoon(item.now)

             points.push(item.now)
         }

         // // 创建关键点
         if (this.options.keyPoint.show && item.keyPoints?.length) {
             item.keyPoints.forEach((point) => {
                 this.createKeyPoint(point)
                 points.push(point)
             })
         }
     })

     return points
 }

 /**
  * 切换台风实体显示状态
  * @returns {boolean} 切换后的显示状态
  */
 toggleTyphoonShow() {
     this.parent.show = !this.parent.show
     return this.parent.show
 }

 /**
  * 创建路径线(历史/未来)
  * @param {Array} positions - 经纬度坐标数组
  * @param {boolean} isHistory - 是否为历史路径(true:实线,false:虚线)
  */
 createLine(data, isHistory) {
     const lineConfig = isHistory ? this.options.solid : this.options.dashed
     let material = null
     if (isHistory) {
         material = cesium.Color.fromCssColorString(COLORMAP[data.type])
     } else {
         material = new cesium.PolylineDashMaterialProperty({
             color: cesium.Color.fromCssColorString(lineConfig.color24),
             dashLength: lineConfig.dashLength,
             gapLength: lineConfig.gapLength
         })
     }
     const line = this.viewer.entities.add({
         parent: this.parent,
         name: isHistory ? '台风历史路径' : '台风预测路径',
         polyline: {
             positions: isHistory ? data.coordinates : data,
             width: lineConfig.width,
             material: material,
             clampToGround: true,
             show: lineConfig.show
         }
     })

     this.entityList.push(line)
 }

 /**
  * 创建关键点(如不同时间点的位置)
  * @param {Object} data - 关键点数据 { lon, lat, type, time, wind }
  */
 createKeyPoint(data) {
     // 数据验证
     if (!this._validatePointData(data)) return

     const { lon, lat, type, time, fxTime, uniqueId } = data
     const pointConfig = this.options.keyPoint
     // const formattedTime = formatDate(time || fxTime, 'YYYY-MM-DD HH:mm')
     const point = this.viewer.entities.add({
         parent: this.parent,
         name: `台风关键点(${time})`,
         id: uniqueId,
         position: cesium.Cartesian3.fromDegrees(Number(lon), Number(lat)),
         point: {
             pixelSize: pointConfig.pixelSize,
             color: cesium.Color.fromCssColorString(COLORMAP[type] || COLORMAP.TD),
             outlineColor: cesium.Color.WHITE,
             outlineWidth: pointConfig.outlineWidth,
             show: pointConfig.show
         },
         // 关键点标签
         label: {
             text: time, //  formattedTime
             font: pointConfig.label.font,
             pixelOffset: pointConfig.label.pixelOffset,
             horizontalOrigin: pointConfig.label.horizontalOrigin,
             backgroundColor: cesium.Color.BLACK.withAlpha(0.5),
             padding: new cesium.Cartesian2(5, 5),
             show: pointConfig.show,
             distanceDisplayCondition: new cesium.DistanceDisplayCondition(10000, 4100000)
         }
     })

     this.entityList.push(point)
 }

 /**
  * 创建台风标识(旋转矩形)
  * @param {Array} data - 台风当前状态数据数组
  */
 createTyphoon(item) {
     if (!this._validatePointData(item)) return
     const { type } = item
     const typhoonConfig = this.options.typhoon
     // 获取图片材质并设置透明度
     const imageMaterial = new cesium.ImageMaterialProperty({
         image: TYPEIMAGE[type] || TYPEIMAGE.TD,
         transparent: true,
         color: new cesium.Color(1, 1, 1, typhoonConfig.opacity)
     })

     const typhoonEntity = this.viewer.entities.add({
         name: `台风标识(${type})`,
         parent: this.parent,
         position: cesium.Cartesian3.fromDegrees(Number(item.lon), Number(item.lat)),
         ellipse: {
             semiMinorAxis: 30000.0,
             semiMajorAxis: 30000.0,
             height: 10.0,
             material: imageMaterial,
             rotation: new cesium.CallbackProperty(() => {
                 this.rotation += typhoonConfig.rotationStep
                 return this.rotation
             }, false),
             stRotation: new cesium.CallbackProperty(() => {
                 return this.rotation
             }, false),
             heightReference: cesium.HeightReference.RELATIVE_TO_GROUND,
             zIndex: 10
         }
     })

     this.entityList.push(typhoonEntity)
 }
 drawWindCircles(viewer, now, entityList) {
     // 检查必要参数
     if (!viewer || !now || !entityList) {
         console.error('缺少必要参数,无法绘制风圈')
         return
     }

     // 风圈配置 - 对应不同风力等级(30kt, 50kt, 64kt)
     const windCircleConfigs = [
         {
             level: 30,
             data: now.windRadius30,
             color: new cesium.Color(1, 1, 0.6, 0.04), // 浅黄色半透明
             outlineColor: new cesium.Color(1, 1, 0.6, 0.8),
             outlineWidth: 2
         },
         {
             level: 50,
             data: now.windRadius50,
             color: new cesium.Color(1, 0.6, 0, 0.05), // 橙色半透明
             outlineColor: new cesium.Color(1, 0.6, 0, 0.9),
             outlineWidth: 3
         },
         {
             level: 64,
             data: now.windRadius64,
             color: new cesium.Color(1, 0, 0, 0.05), // 红色半透明
             outlineColor: new cesium.Color(1, 0, 0, 1),
             outlineWidth: 4
         }
     ]

     // 台风中心坐标
     const center = [parseFloat(now.lon), parseFloat(now.lat)]
     if (isNaN(center[0]) || isNaN(center[1])) {
         console.error('无效的台风中心坐标')
         return
     }

     // 逐个绘制风圈
     windCircleConfigs.forEach((config) => {
         // 跳过无数据的风圈
         if (!config.data || !config.data.neRadius) return

         // 解析四象限半径(公里转度)
         const radius = {
             ne: parseFloat(config.data.neRadius) / 111, // 1度≈111公里
             se: parseFloat(config.data.seRadius) / 111,
             sw: parseFloat(config.data.swRadius) / 111,
             nw: parseFloat(config.data.nwRadius) / 111
         }

         // 验证半径数据
         if (Object.values(radius).some((r) => isNaN(r) || r <= 0)) {
             console.warn(`跳过无效的${config.level}kt风圈数据`)
             return
         }

         // 计算风圈多边形顶点
         const points = []
         this.calculateQuadrantPoints(center, radius.ne, 0, points) // 东北象限(0°-90°)
         this.calculateQuadrantPoints(center, radius.se, 90, points) // 东南象限(90°-180°)
         this.calculateQuadrantPoints(center, radius.sw, 180, points) // 西南象限(180°-270°)
         this.calculateQuadrantPoints(center, radius.nw, 270, points) // 西北象限(270°-360°)

         // 绘制风圈多边形
         if (points.length > 0) {
             const windCircle = viewer.entities.add({
                 parent: this.parent,
                 name: `wind_circle_${config.level}kt`,
                 polygon: {
                     hierarchy: cesium.Cartesian3.fromDegreesArray(points),
                     material: config.color,
                     extrudedHeight: 0, // 风圈高度
                     outline: true,
                     outlineColor: config.outlineColor,
                     outlineWidth: config.outlineWidth,
                     // 显示层级 - 确保强风圈在顶层
                     zIndex: 1
                 }
             })
             entityList.push(windCircle)
         }
     })
 }
 calculateQuadrantPoints(center, radius, startAngle, points) {
     const pointCount = 30 // 每个象限30个点(越多越圆滑)
     const endAngle = startAngle + 90 // 每个象限90度

     for (let i = 0; i <= pointCount; i++) {
         // 角度转弧度(JS 三角函数只认弧度)
         const angle = cesium.Math.toRadians(
             startAngle + ((endAngle - startAngle) * i) / pointCount
         )

         // 【核心数学公式】计算经纬度偏移
         const lonOffset = radius * Math.sin(angle)
         const latOffset = radius * Math.cos(angle)

         // 计算最终点坐标并推入数组
         points.push(center[0] + lonOffset)
         points.push(center[1] + latOffset)
     }
 }
 /**
  * 清除所有台风相关实体
  */
 clearTyphoon() {
     this.entityList.forEach((entity) => {
         this.viewer.entities.remove(entity)
     })
     this.entityList = []
     this.rotation = cesium.Math.toRadians(30) // 重置旋转角度
 }

 /**
  * 验证点数据有效性
  * @param {Object} data - 包含lon和lat的点数据
  * @returns {boolean} 是否有效
  */
 _validatePointData(data) {
     if (!data || typeof data !== 'object') {
         console.warn('无效的点数据格式')
         return false
     }
     const lon = Number(data.lon)
     const lat = Number(data.lat)
     if (isNaN(lon) || isNaN(lat) || lon < -180 || lon > 180 || lat < -90 || lat > 90) {
         console.warn('无效的经纬度数据:', data)
         return false
     }
     return true
 }
}
模拟数据显示效果:
至于鼠标悬浮显示提示框可以使用HtmlOverlay进行实现,这里就不过多介绍了htmlOverlay
总结:
以上就是根据和风天气API实现的Cesium台风管理类,实际并不复杂,至于24/48警戒线,可以自行实现。有问题可以下方交流。(有帮助的话希望一键三连哦!)