一、Pushgateway 二进制安装(不用 Docker、不用联网)
cd /usr/local
wget https://github.com/prometheus/pushgateway/releases/download/v1.5.1/pushgateway-1.5.1.linux-amd64.tar.gz
tar zxvf pushgateway-1.5.1.linux-amd64.tar.gz
mv pushgateway-1.5.1.linux-amd64 pushgateway
cd pushgateway
二、后台启动 Pushgateway(端口 9091)
nohup ./pushgateway --web.listen-address=":9091" --persistence.file="pushgateway.data" >/dev/null 2>&1 &三、验证是否启动成功
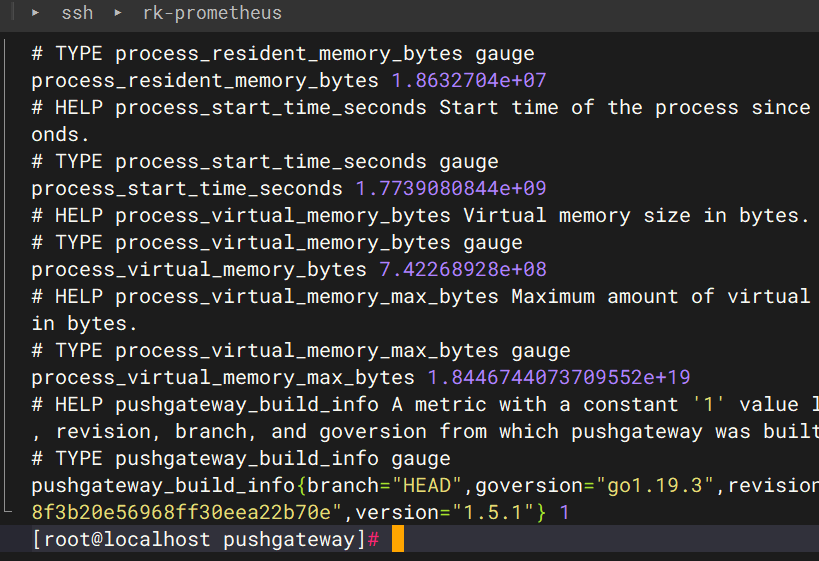
curl 127.0.0.1:9091/metrics出现指标 = 成功。
四、把 Pushgateway 加入 prometheus.yml
编辑你找到的配置文件:
vi /etc/prometheus/prometheus.yml在 scrape_configs 下面添加:
- job_name: 'pushgateway'
    static_configs:
      - targets: ['192.168.52.130:9091']
    honor_labels: true
五、重启 Prometheus
systemctl restart prometheus浏览器访问 IP:9091 验证pushgateway⻚⾯即可
六、推送数据示例
示例 1:最简单推送指标
echo "test_metric 100" | curl --data-binary @- http://192.168.52.130:9091/metrics/job/test_job示例 2:带标签推送
echo "test_metric{instance=\"server-130\",job=\"push_test\"} 88" | curl --data-binary @- http://192.168.52.130:9091/metrics/job/push_test/instance/server-130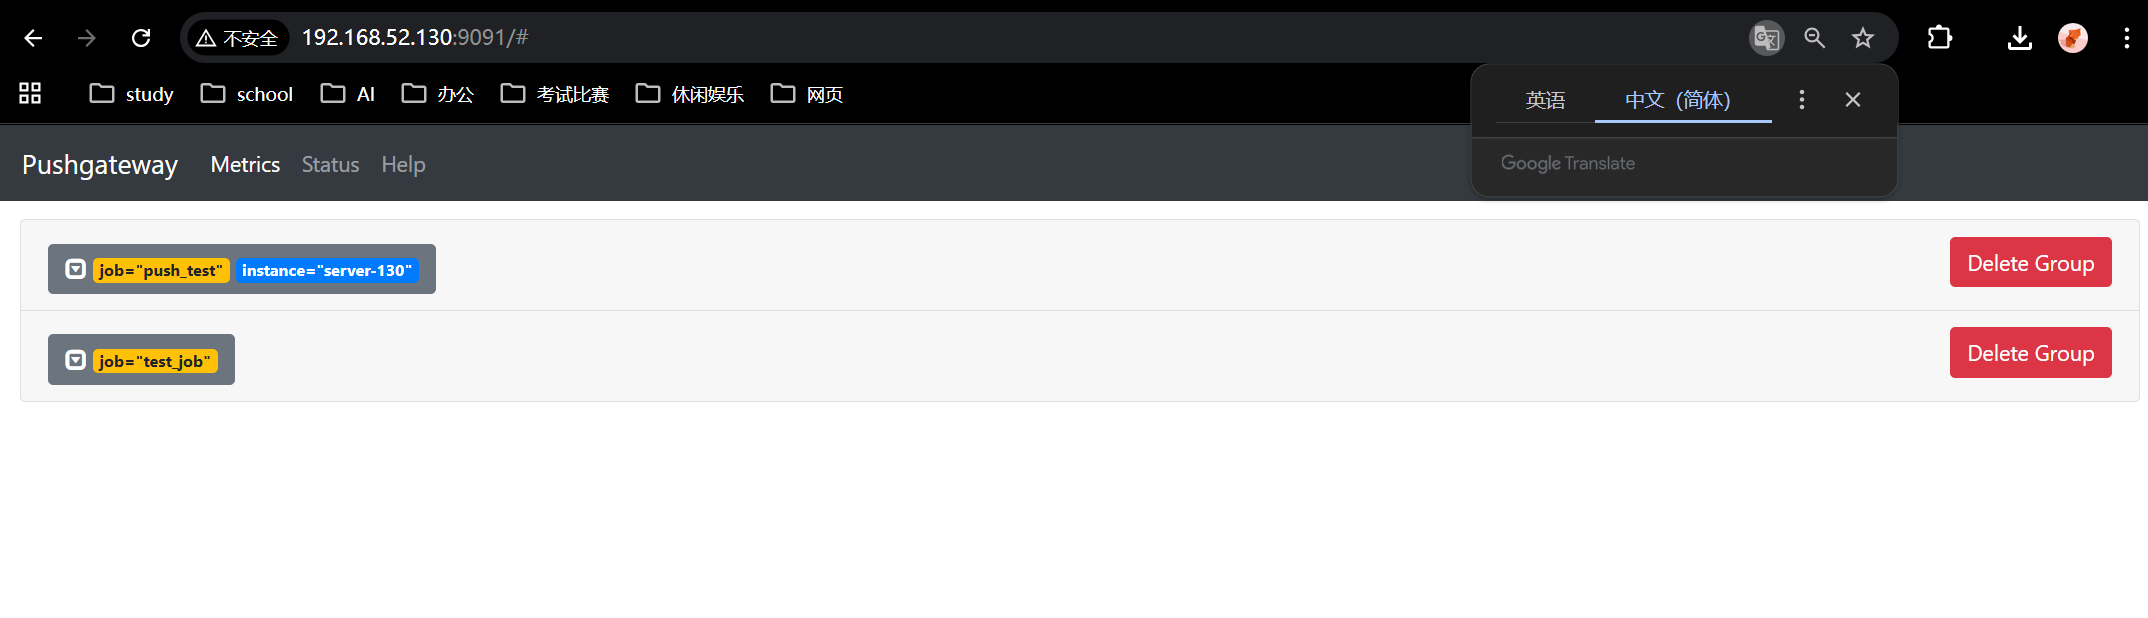
示例 3:删除数据
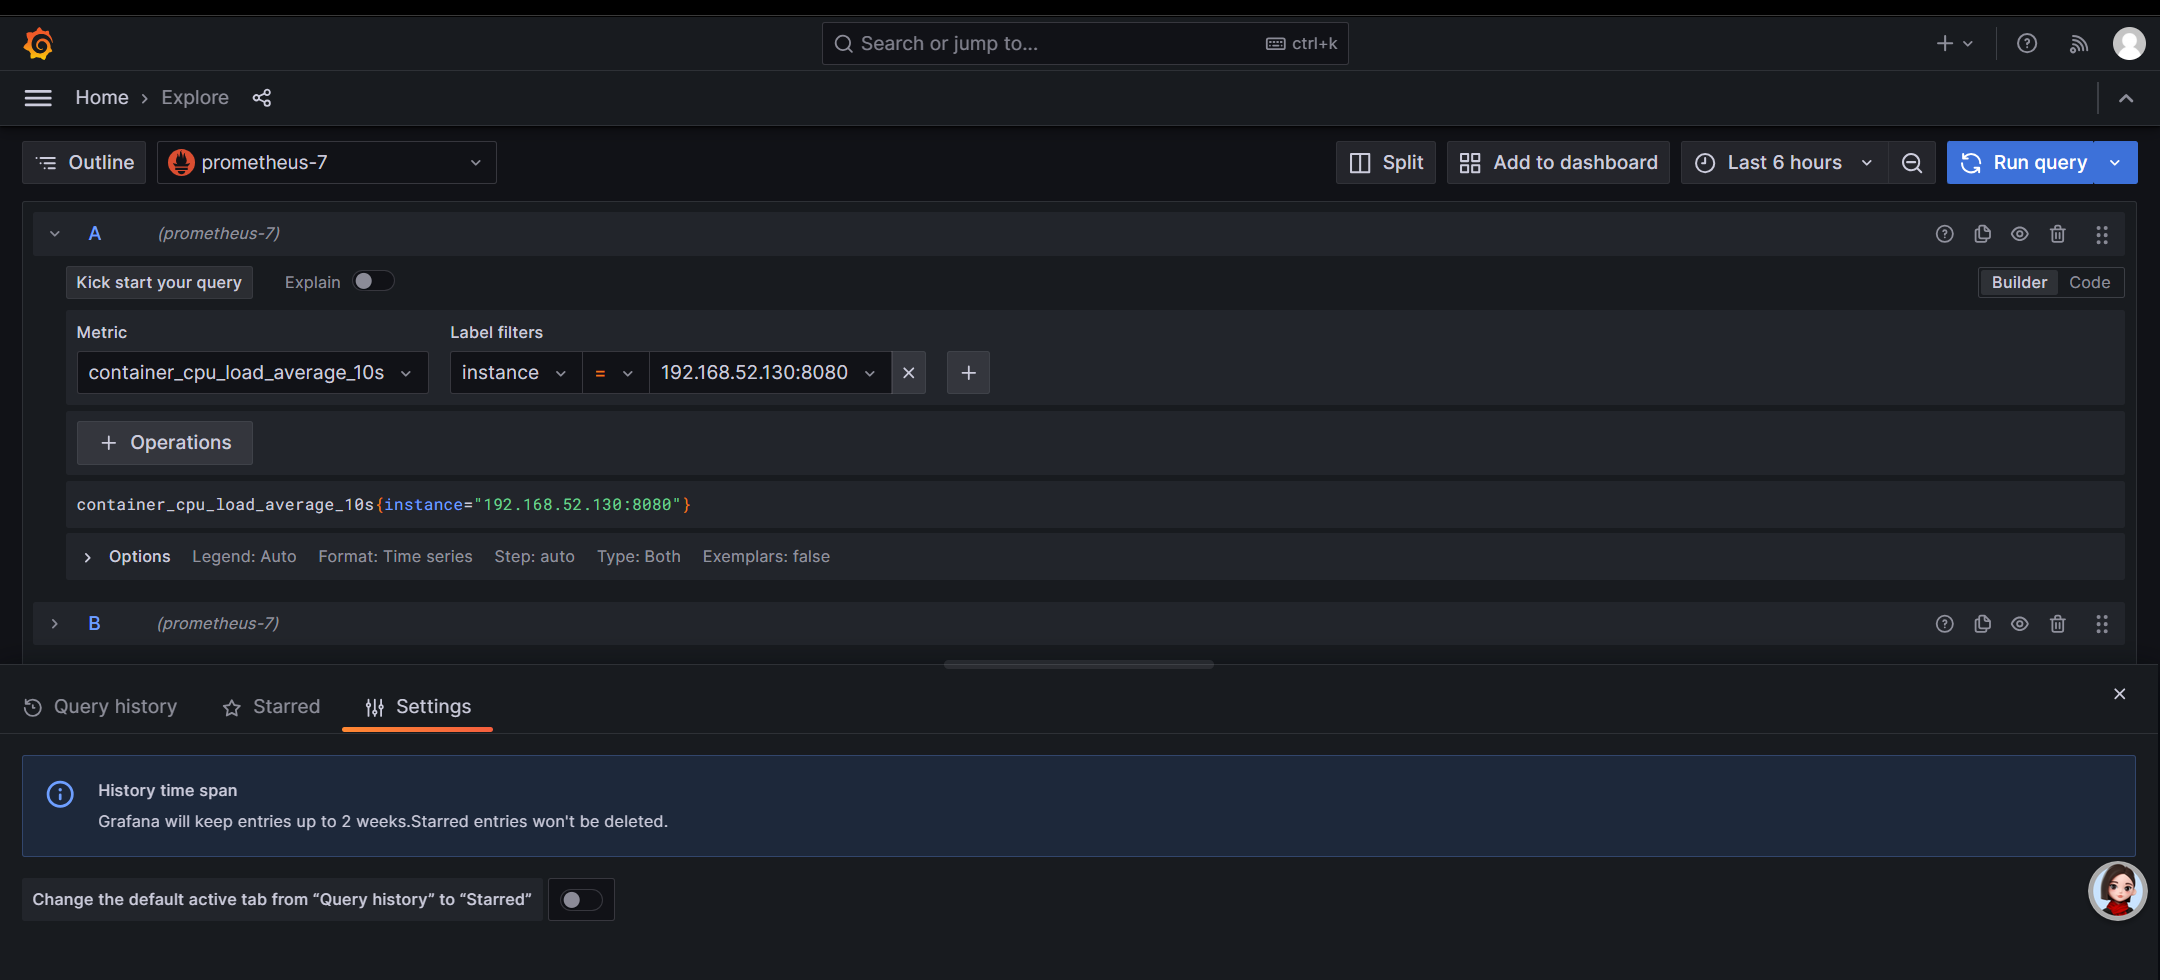
curl -X DELETE http://192.168.52.130:9091/metrics/job/push_test/instance/server-130七、Grafana 出图(可视化)
- 打开 Grafana:
http://192.168.52.130:3000 - 导入面板:11434(Pushgateway 官方面板)
- 数据源选择 Prometheus
- 立刻出现:
-
- 推送速率
- 推送时间
- 任务状态
- 自定义指标图表
八、完成验证
- Prometheus targets 里出现 pushgateway (UP)
- 能执行推送 / 删除命令
- Grafana 面板正常出图