ScottPlot
在 WPF 中使用ScottPlot (目前主流版本为ScottPlot 5)非常简便,它是一个高性能、开源的 .NET 绘图库,特别适合科学计算、工程数据显示和实时波形监控。
以下是完整的集成和使用指南:
1. 安装 NuGet 包
首先,你需要在 WPF 项目中安装专用的 WPF 包。
- 包名 :
ScottPlot.WPF - 操作方法 :
-
Visual Studio : 右键项目 -> "管理 NuGet 程序包" -> 搜索
ScottPlot.WPF-> 安装。 -
命令行 :
bashdotnet add package ScottPlot.WPF
-
注意 : 不要只安装
ScottPlot核心库,WPF 项目必须安装ScottPlot.WPF才能使用专用的控件。
2. 在 XAML 中添加控件
安装完成后,你可以在 XAML 文件中直接使用该控件。
步骤:
-
在根元素(如
<Window>或<UserControl>)中添加命名空间声明:xmlxmlns:sp="clr-namespace:ScottPlot.WPF;assembly=ScottPlot.WPF" -
在布局容器中添加
WpfPlot控件:
xml
<Window x:Class="MyWpfApp.MainWindow"
        xmlns="http://schemas.microsoft.com/winfx/2006/xaml/presentation"
        xmlns:x="http://schemas.microsoft.com/winfx/2006/xaml"
        xmlns:sp="clr-namespace:ScottPlot.WPF;assembly=ScottPlot.WPF"
        Title="ScottPlot WPF Demo" Height="450" Width="800">

    <Grid>
        <!-- 使用 WpfPlot 控件 -->
        <sp:WpfPlot Name="MyPlot" />
    </Grid>
</Window>
启动效果:已经有图表了
3. 在C#代码添加数据绘制图表
ScottPlot 5 的核心逻辑是通过Plot对象进行的。在 WPF 中,你可以通过WpfPlot.Plot 属性访问它。
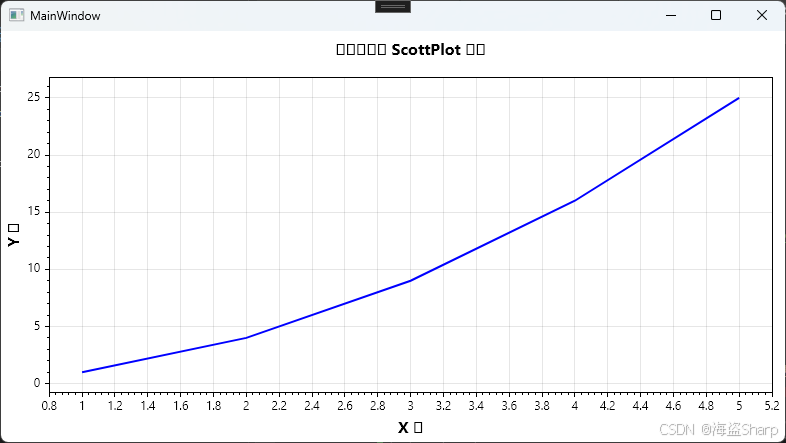
基本示例 (绘制折线图):
csharp
using System.Windows;
using ScottPlot; // 引入核心命名空间
namespace MyWpfApp
{
public partial class MainWindow : Window
{
public MainWindow()
{
InitializeComponent();
InitializePlot();
}
private void InitializePlot()
{
// 1. 获取 Plot 对象
var plot = MyPlot.Plot;
// 2. 准备数据
double[] xs = { 1, 2, 3, 4, 5 };
double[] ys = { 1, 4, 9, 16, 25 };
// 3. 添加图形 (Add 系列方法)
var line = plot.Add.Line(xs, ys);
//加一段
// var line = plot.Add.Line(1, 1, 2, 4);
//批量加点
var line = plot.Add.ScatterLine(xs, ys);
line.LineWidth = 2;
line.Color = Colors.Blue; // 可以使用 System.Windows.Media.Color 或 ScottPlot 颜色
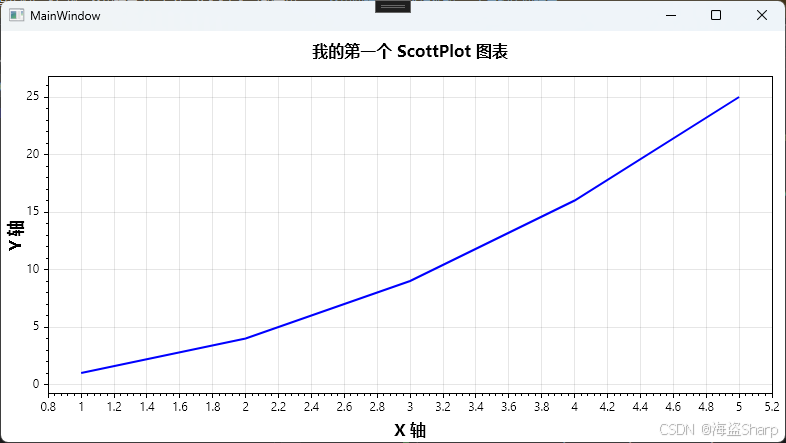
// 4. 设置标题和标签
plot.Title("我的第一个 ScottPlot 图表");
plot.Axes.Bottom.Label.Text = "X 轴";
plot.Axes.Left.Label.Text = "Y 轴";
plot.Font.Automatic();
// 5. 刷新显示 (非常重要!)
MyPlot.Refresh();
}
}
}
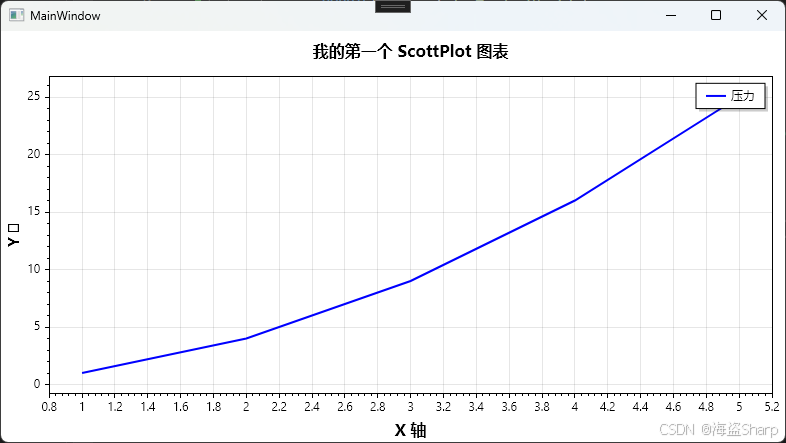
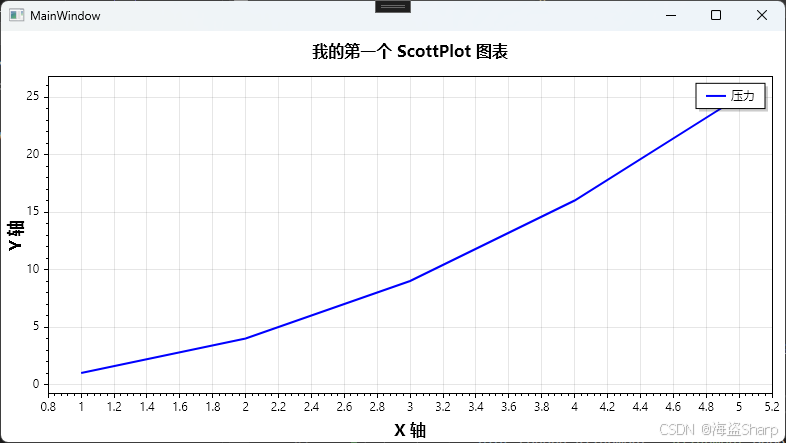
4.图例位置设置
设置曲线的图例文本,然后设置图表的图例Legend属性
csharp
//设置图例
line.LegendText = "压力";

// 将图例设置在右上角
plot.Legend.Location = Alignment.UpperRight;
plot.Legend.IsVisible = true;
csharp
       // 1. 获取 Plot 对象
       var plot = MyPlot.Plot;
       // 2. 准备数据
       double[] xs = { 1, 2, 3, 4, 5 };
       double[] ys = { 1, 4, 9, 16, 25 };
       // 3. 添加图形 (Add 系列方法)
       //加一段
       // var line = plot.Add.Line(1, 1, 2, 4);

       var line = plot.Add.ScatterLine(xs, ys);
       line.LineWidth = 2;
       line.Color = ScottPlot.Colors.Blue; // 可以使用 System.Windows.Media.Color 或 ScottPlot 颜色
       line.LegendText = "压力";
       // 4. 设置标题和标签
       plot.Title("我的第一个 ScottPlot 图表");
       plot.Axes.Bottom.Label.Text = "X 轴";
       plot.Font.Automatic();
       plot.Axes.Left.Label.Text = "Y 轴";
       // 将图例设置在右上角
       plot.Legend.Alignment = Alignment.UpperRight;
       plot.Legend.IsVisible = true;
       // 5. 刷新显示 (非常重要!)
       MyPlot.Refresh();
   }
常见问题
中文乱码
默认字体可能不支持中文,导致方框乱码。你需要修改让其支持中文。
只需要使用Font.Automatic()
csharp
plot.Title("我的第一个 ScottPlot 图表");
plot.Axes.Bottom.Label.Text = "X 轴";
plot.Axes.Left.Label.Text = "Y 轴";
plot.Font.Automatic();
📌需要注意的是,必须在设置完中文Text之后再调用才能生效
如下代码,显示效果就是Y轴中文没有生效
csharp
     // 4. 设置标题和标签
     plot.Title("我的第一个 ScottPlot 图表");
     plot.Axes.Bottom.Label.Text = "X 轴";
     plot.Font.Automatic();
     plot.Axes.Left.Label.Text = "Y 轴";