文章目录
背景
官网参考:https://dwzhu-pku.github.io/PaperBanana/
PaperBanana想必大家都听说过了,一个面向人工智能研究人员的智能框架,借助PaperBanana,可从文本或参考文献中生成高质量的方法图和图表。
我想做计算的,其实对于普通的统计图表、调包组合图表,应该都是得心应手,
但是问题就在于一些繁琐的graphical abstract,以及方法学方面的框架、流程搭图,尤为麻烦。
在实际的学术级图表的绘制和生成中情况会比较复杂,但是我们此处降低我们的场景难度,
本篇博客先来讲一讲如果是在组会汇报、小组小团队场景展示中,如果要快速迭代、更新一些偏向于总结性、描述性、方法学、框架流程图之类,非核心统计图表类的文生图方案。
本篇博客的示例:
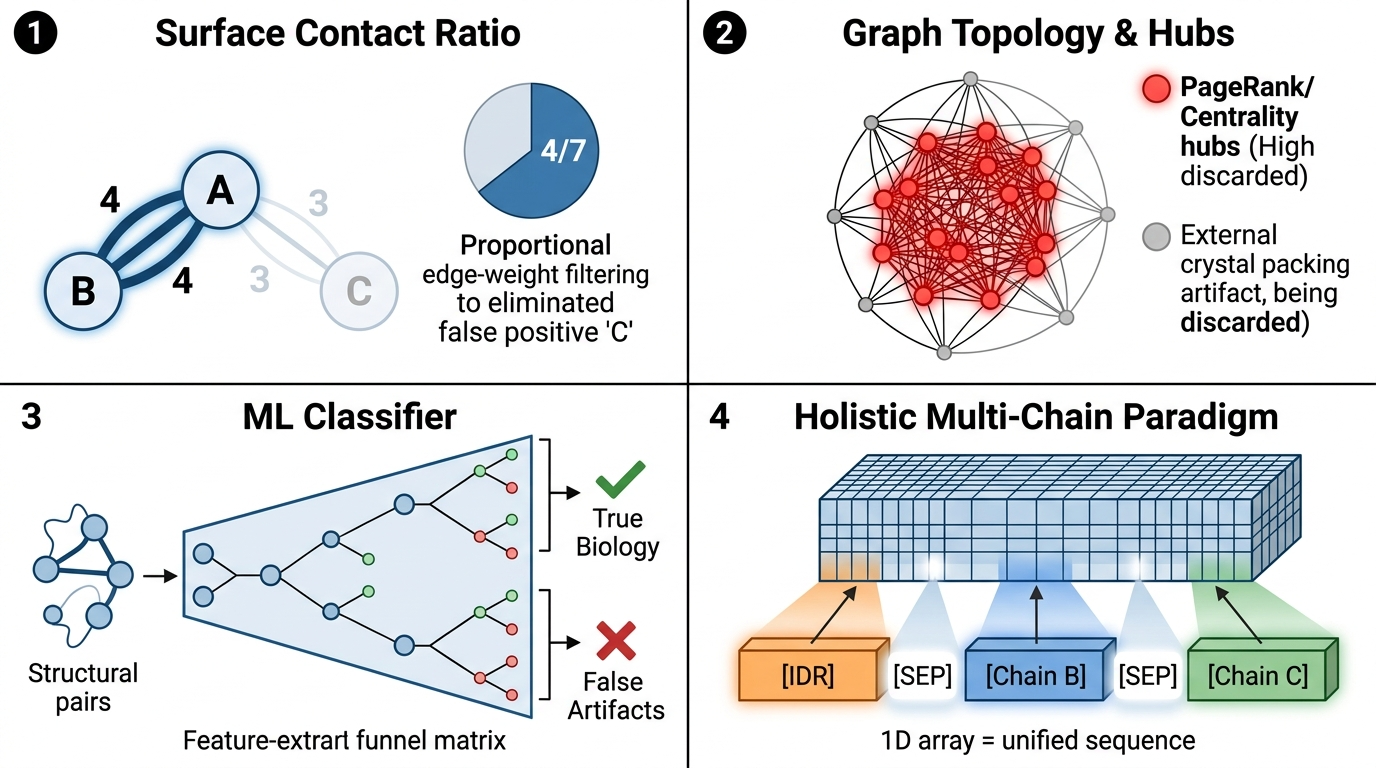
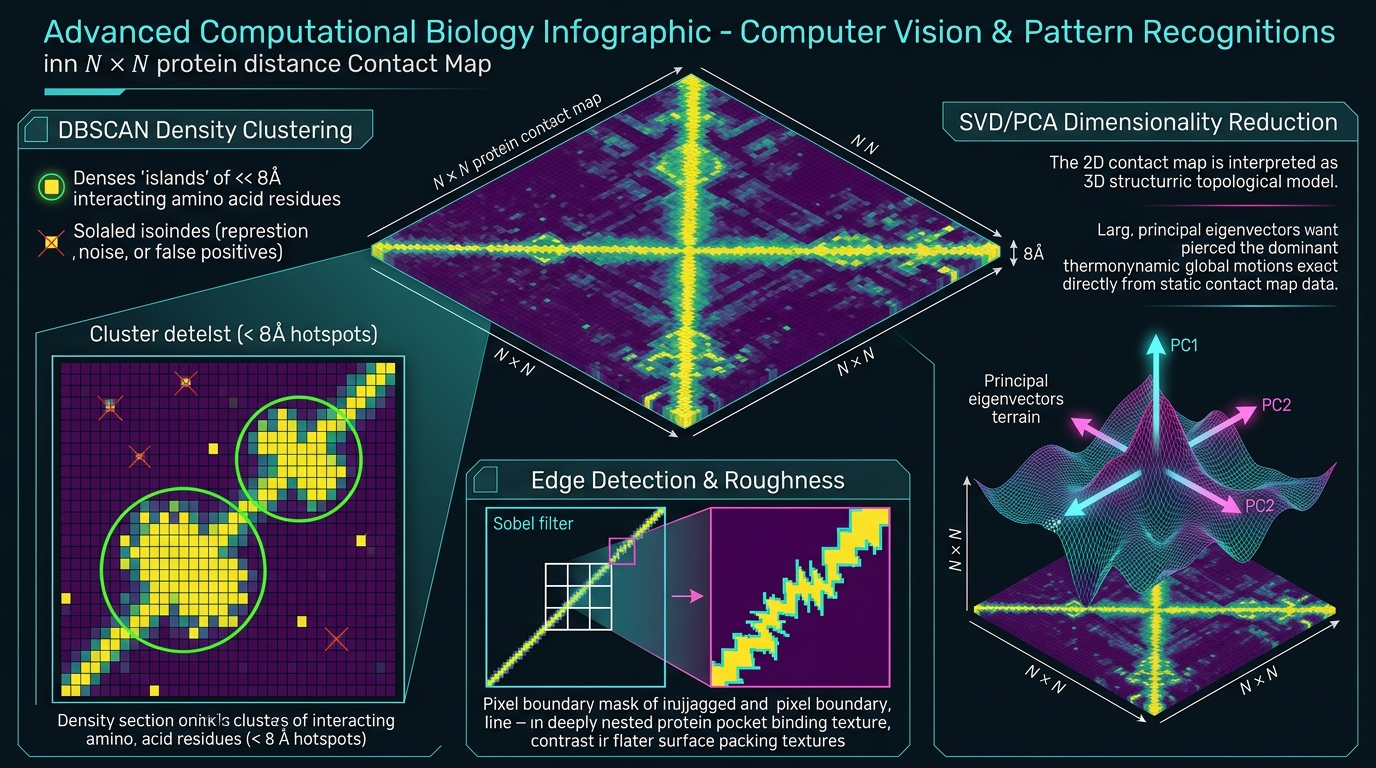
给出1个算法流程概览(我的一个算法),然后生成对算法文字的总结,并展示每个算法执行过程的基本图例。
适用场景:ppt汇报中快速生成同等文字的图片可视化描述
专用Agent:PaperBanana等
各大LLM生态圈
1,Gemini:NanoBanana
但是需要消耗credit,也就是积分-套餐那一套
生成的算法流程图总结:
2,ChatGPT
官网:https://chatgpt.com/images/

同样的问题需求,效果如下:
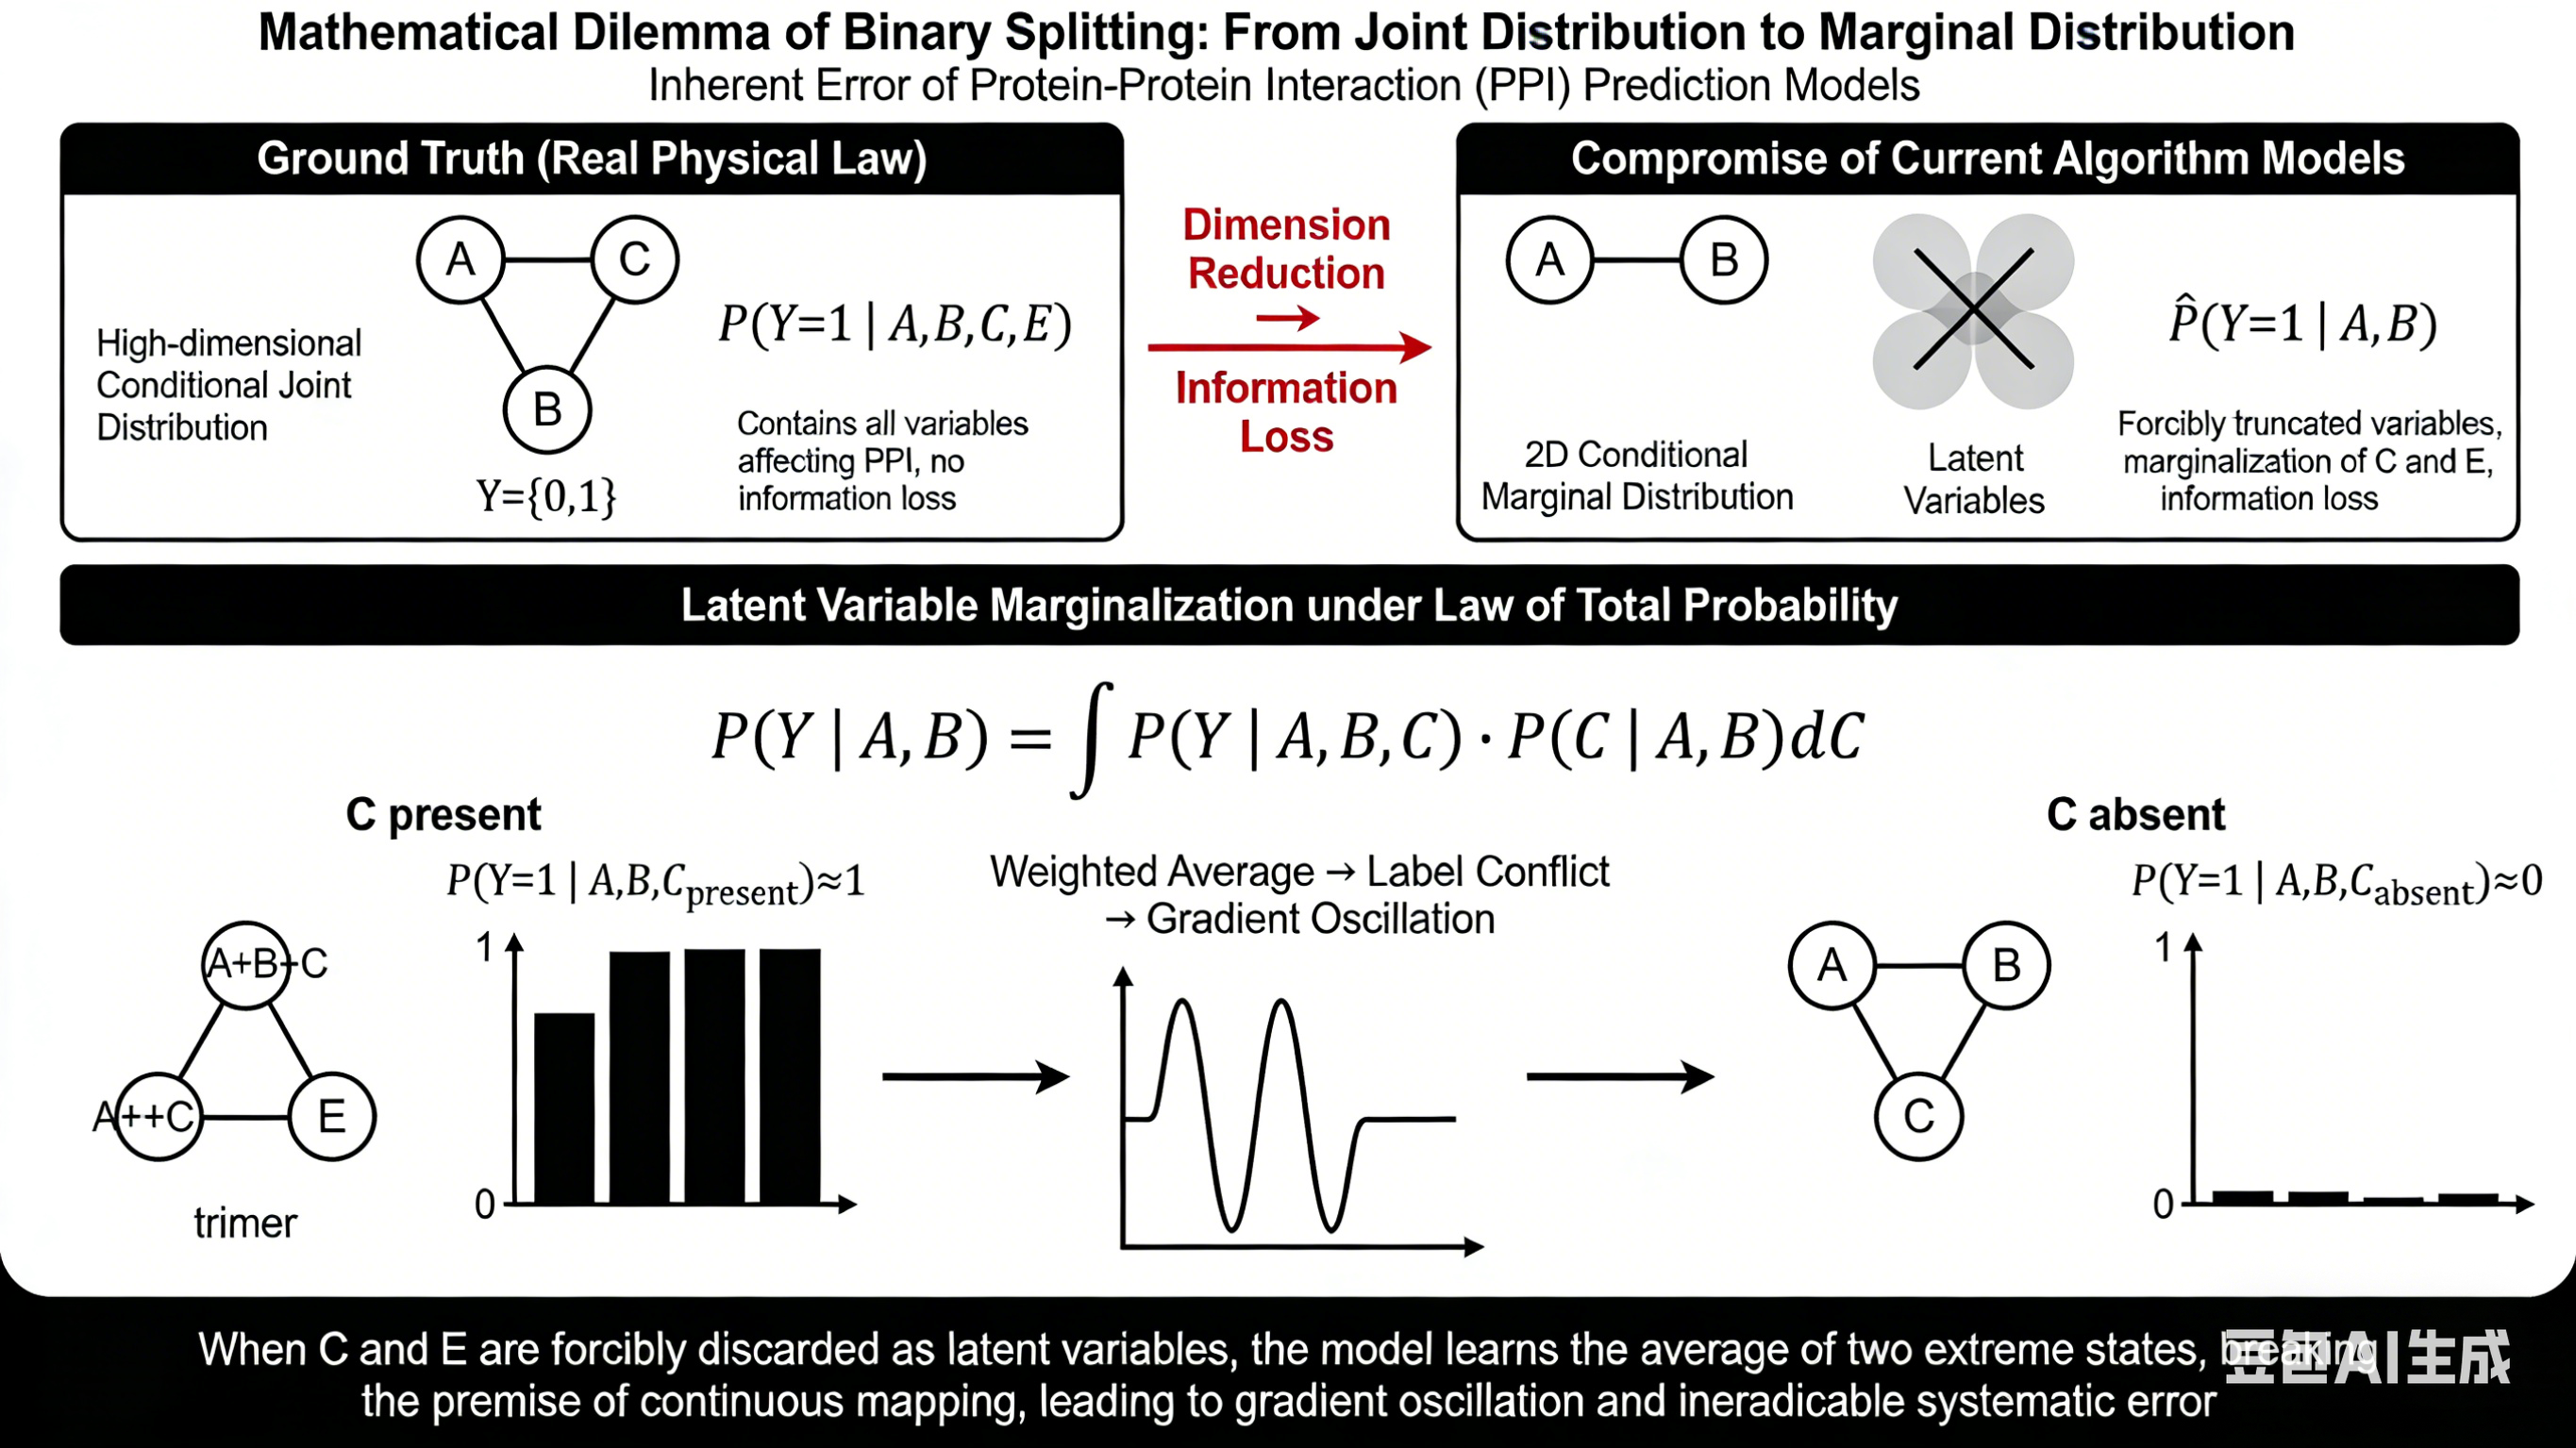
文字还是有生成错误的,颜色也不一致,图片基本上都是豆豆挤来挤去,
效果上其实一般般,主要是内容一多挤在一起必然会爆。
而且还不免费
3,国产各大厂商Image生成model
1,豆包
官网:https://www.doubao.com/chat/create-image

豆包好就好在一点,相比前面的生成工具,至少这个是免费的。
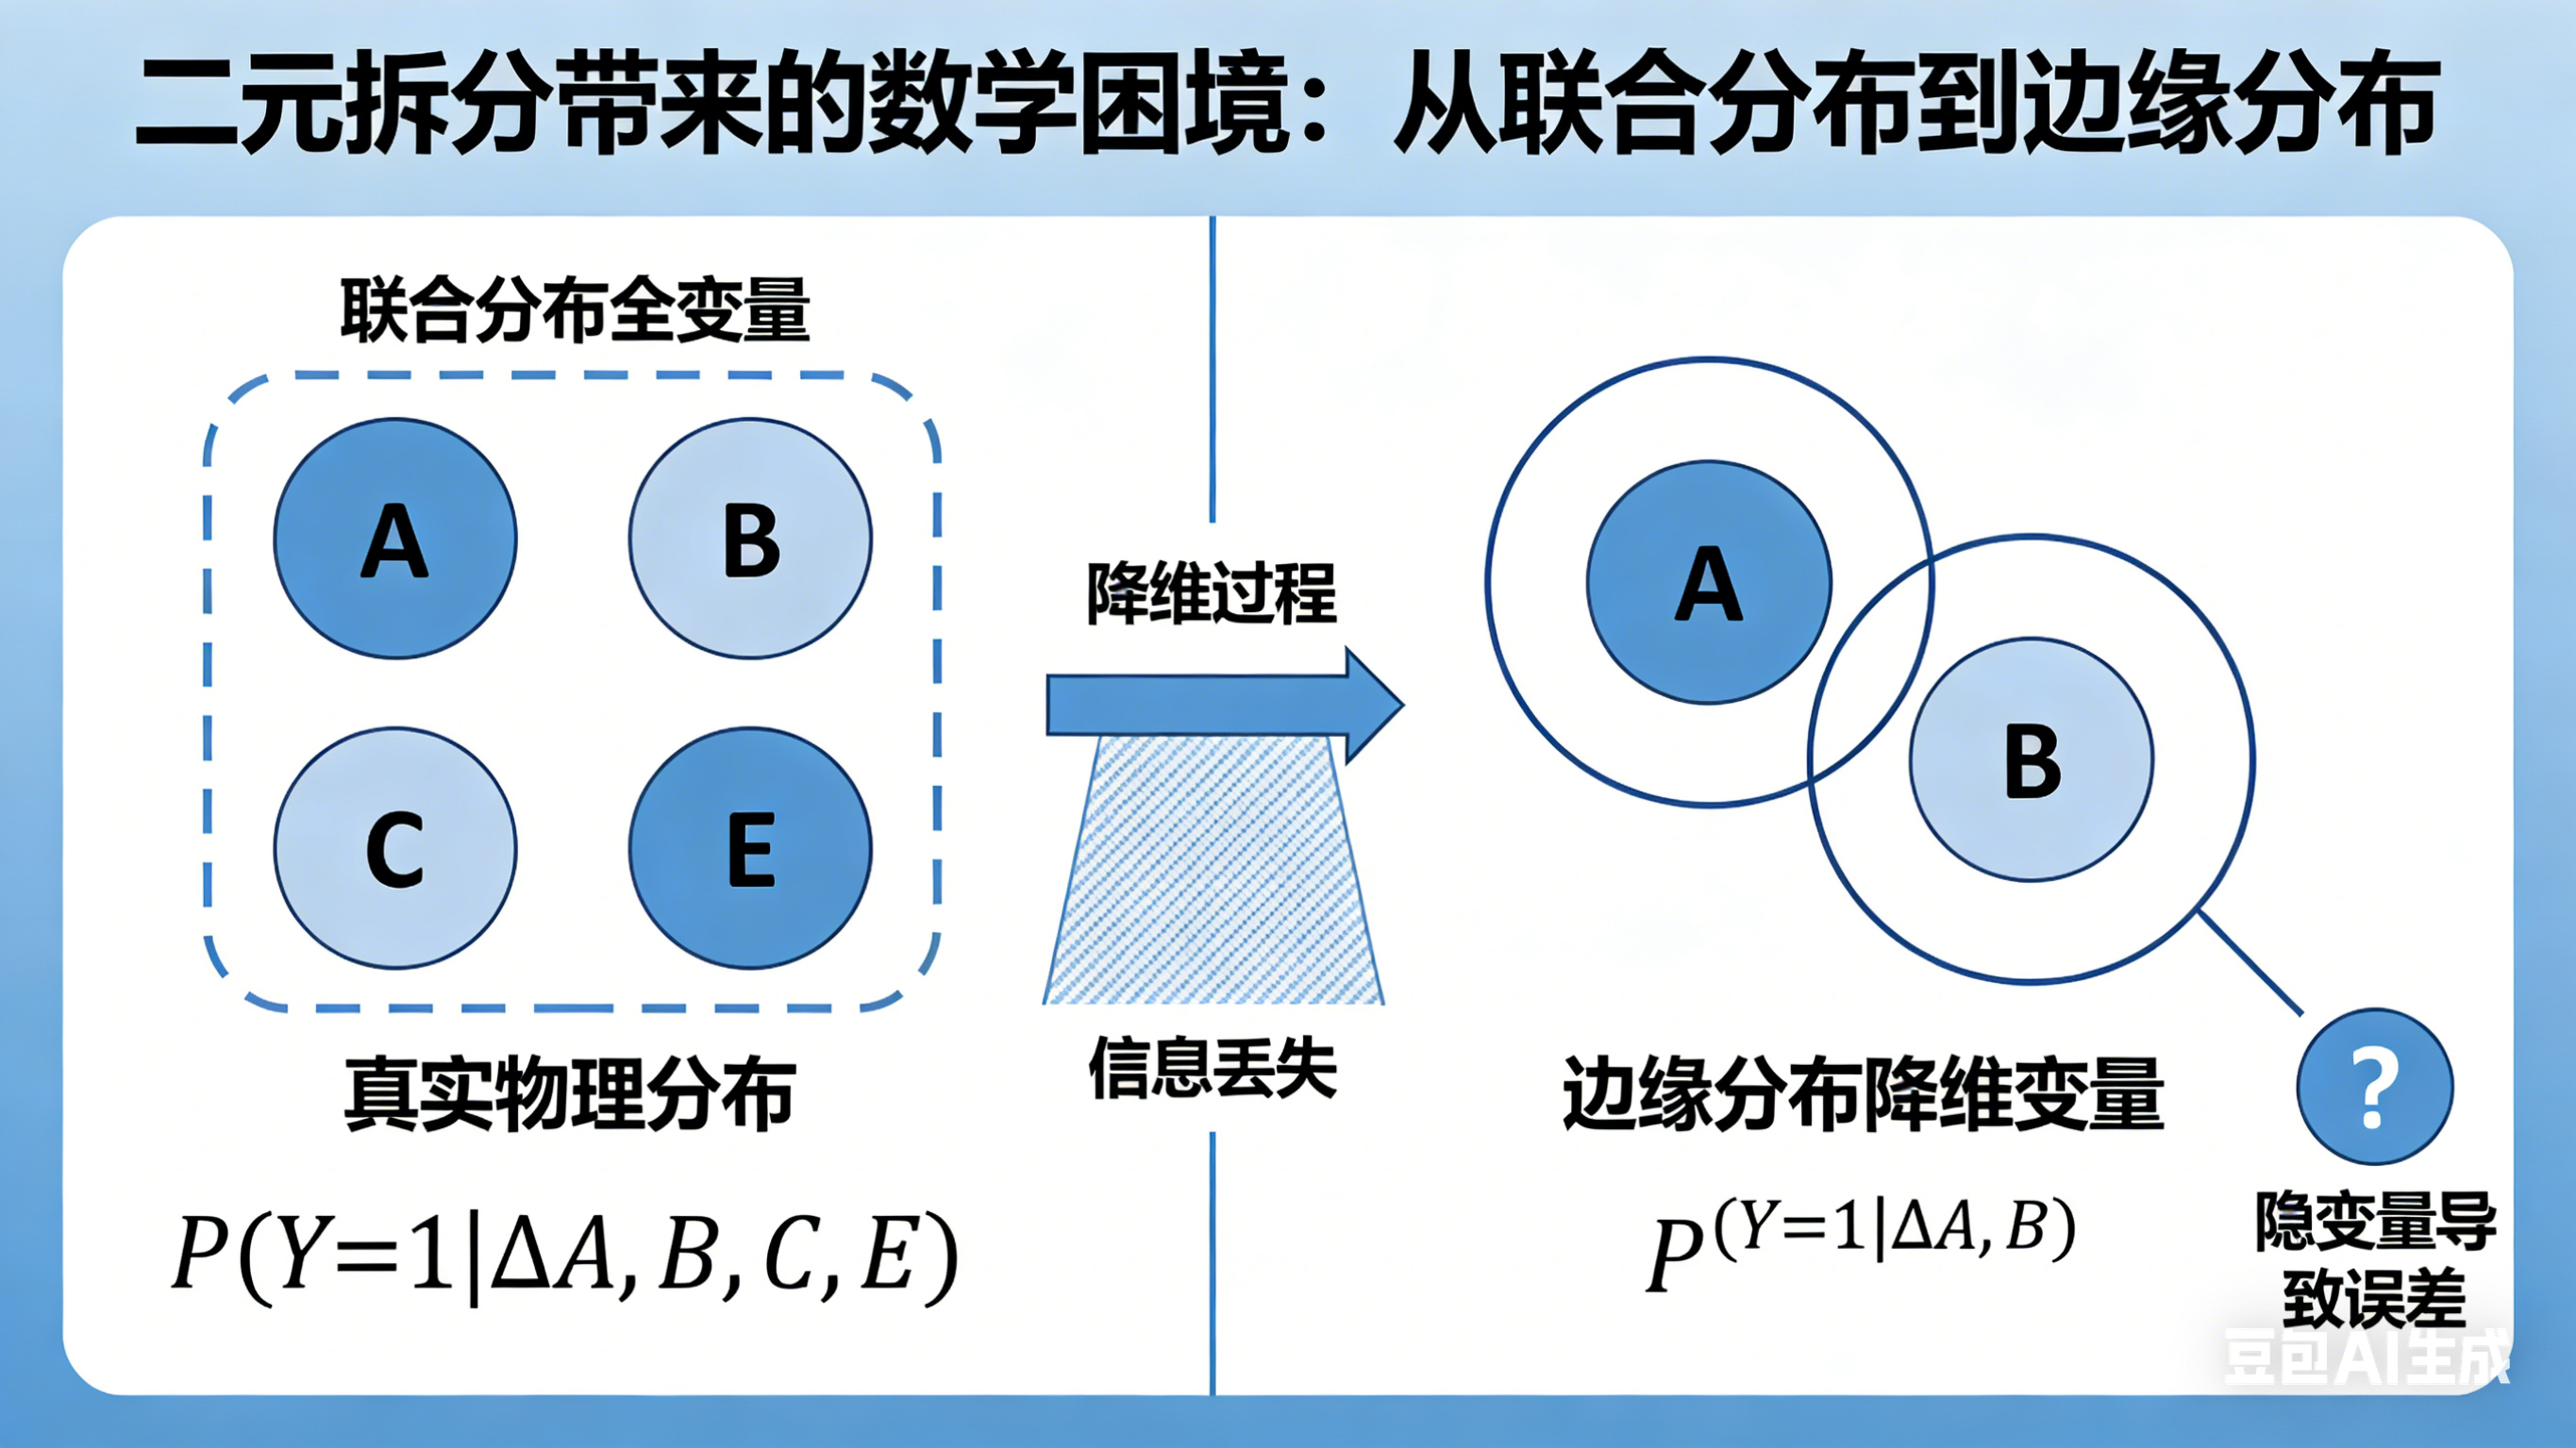
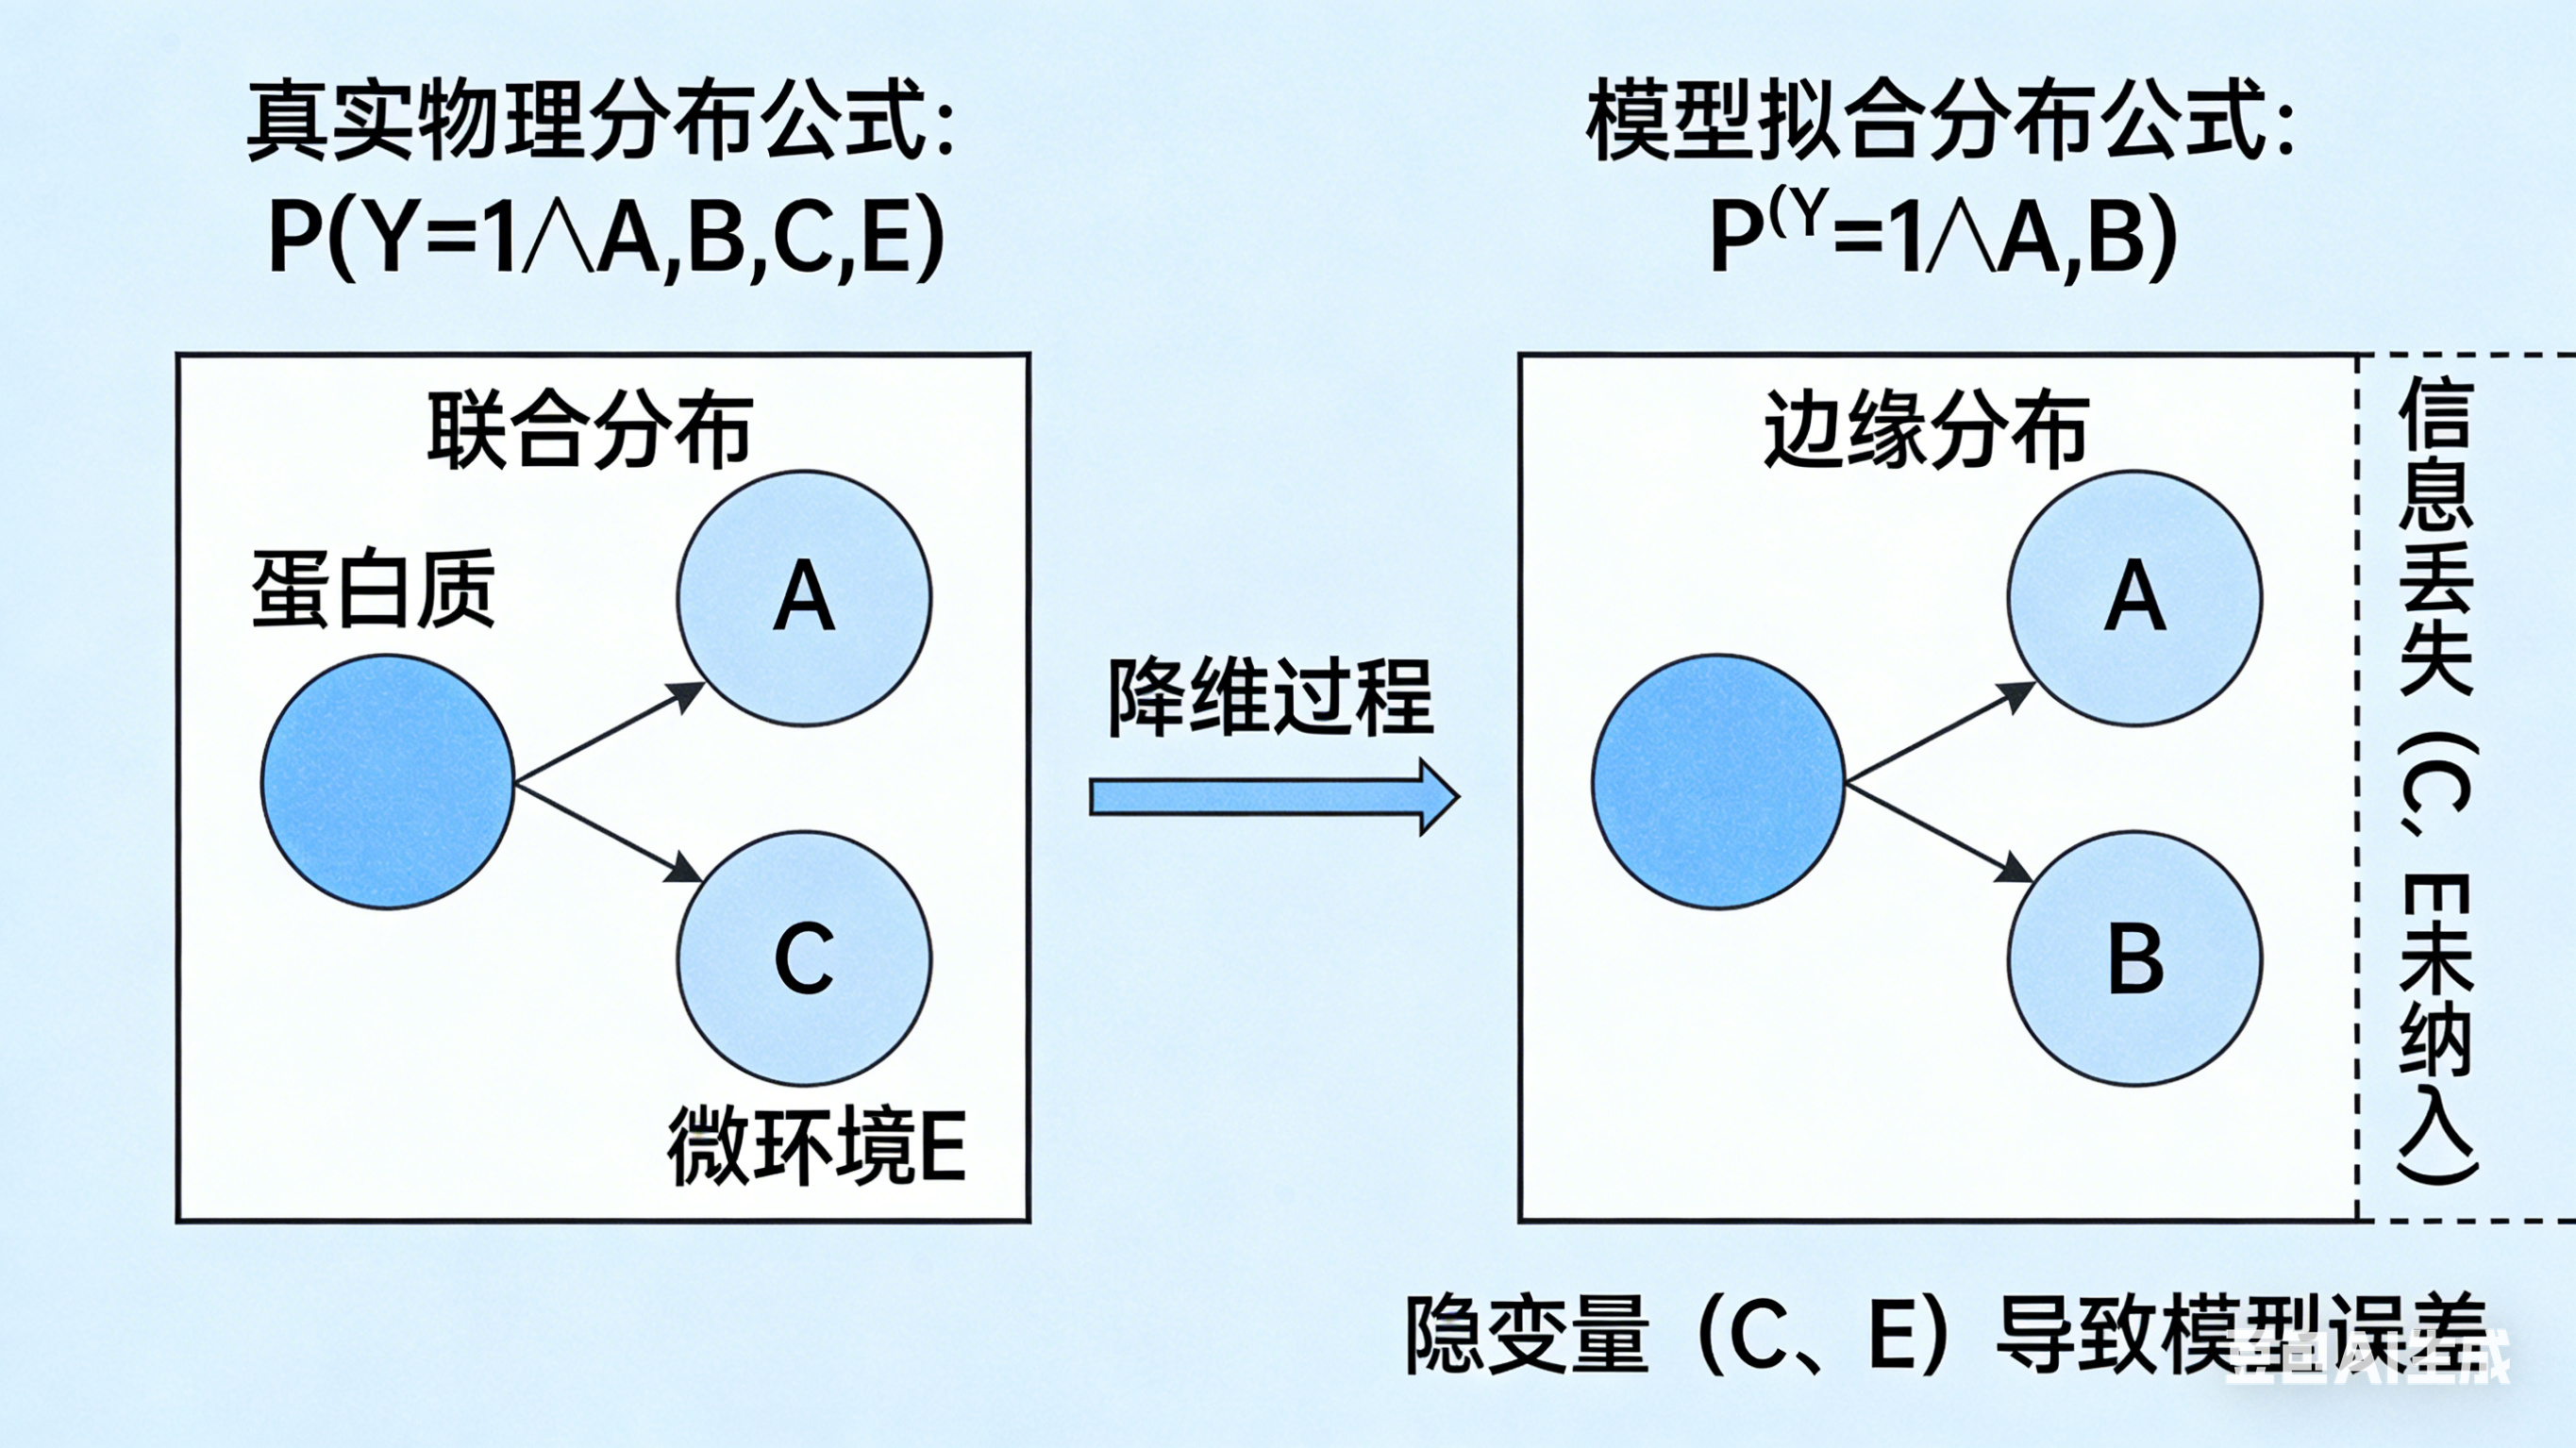
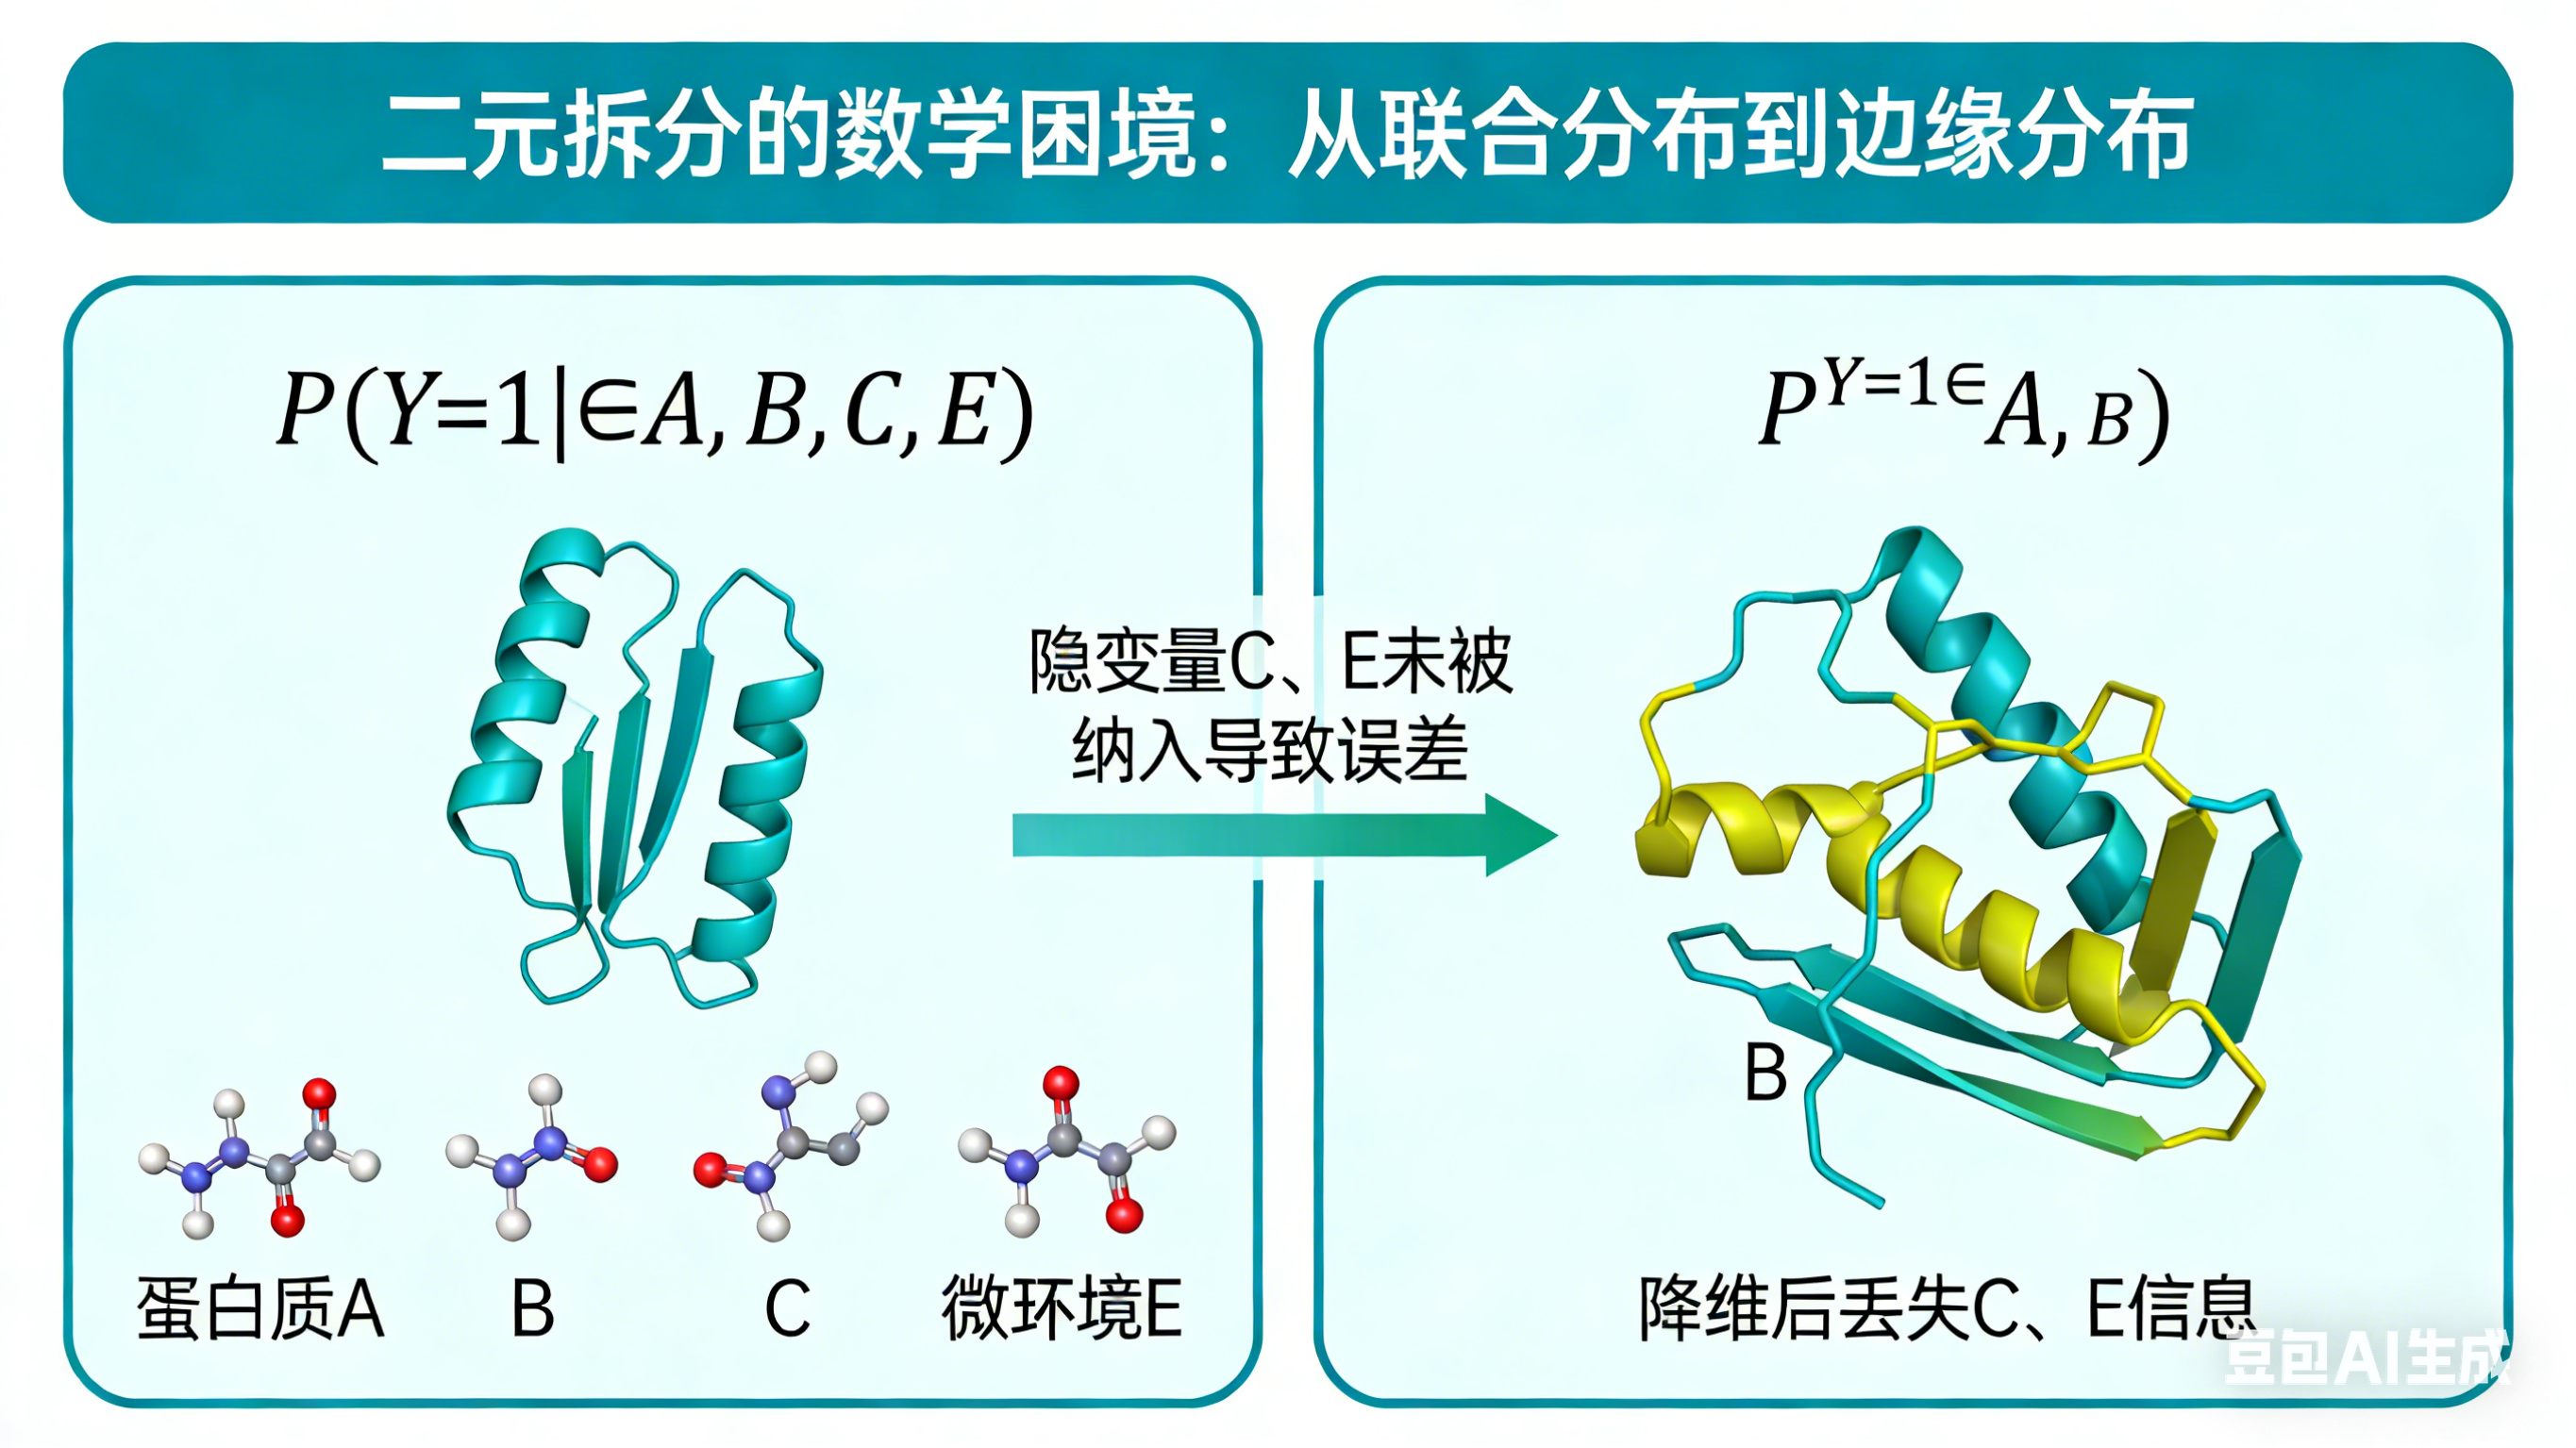
同样的问题以及需求,我们看看绘制出来的效果:豆包绘制的话首次会生成连续的几张图
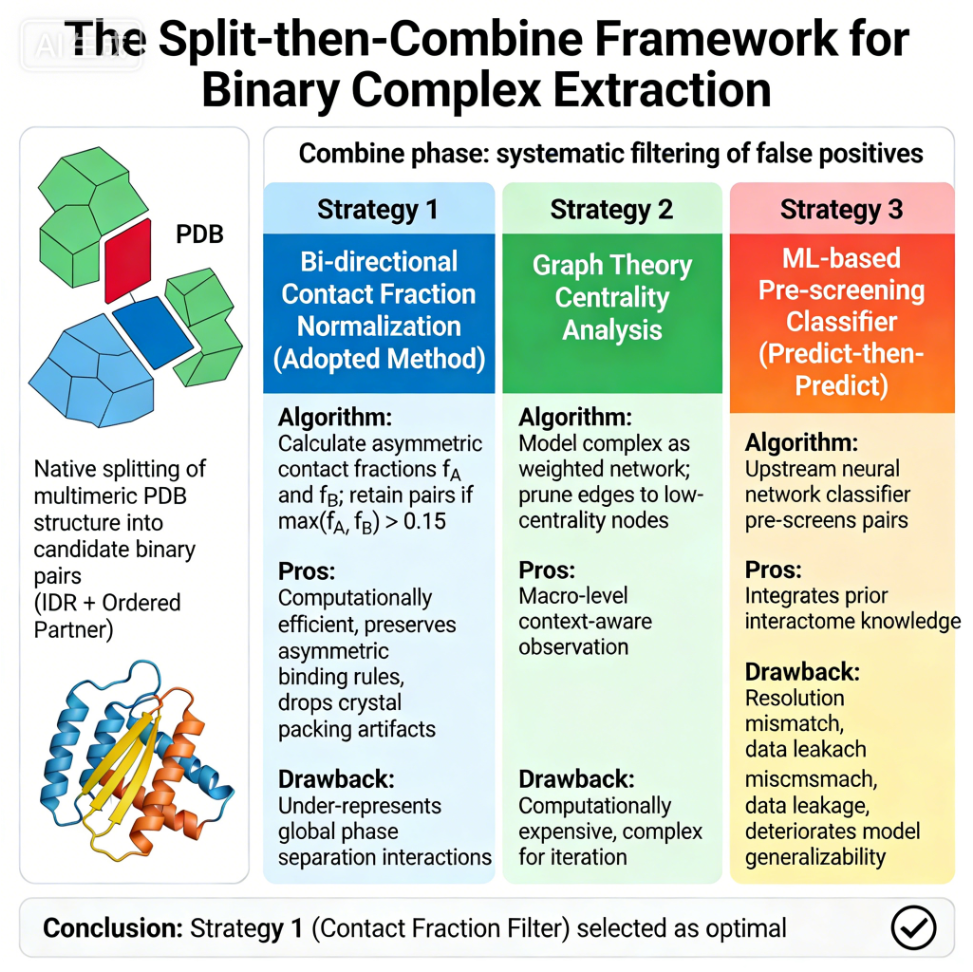
我们可以发现,总体配色和风格上其实挺像1张正式的总结图的,也挺美观;
但是!
仔细一看文字,就是一塌糊涂,文字有拼错单词、错字、单词重叠在一起的各种情况。
我们一般没法直接用。
这种情况下只有2种解决方法:
-
- 祈祷图片一开始生成的文字就是没问题的,当然看上去颜色浅、颜色怪是小问题,我们的忍耐度基线是起码文字得没错,这样至少我们放到ppt上汇报总结的时候,把图缩小点文字颜色效果其实台下看ppt的人是看不出来的。实在不行,就在同一页ppt中加点其他内容,从主观以及客观条件上削弱大家对于纯粹图片的注意力
-
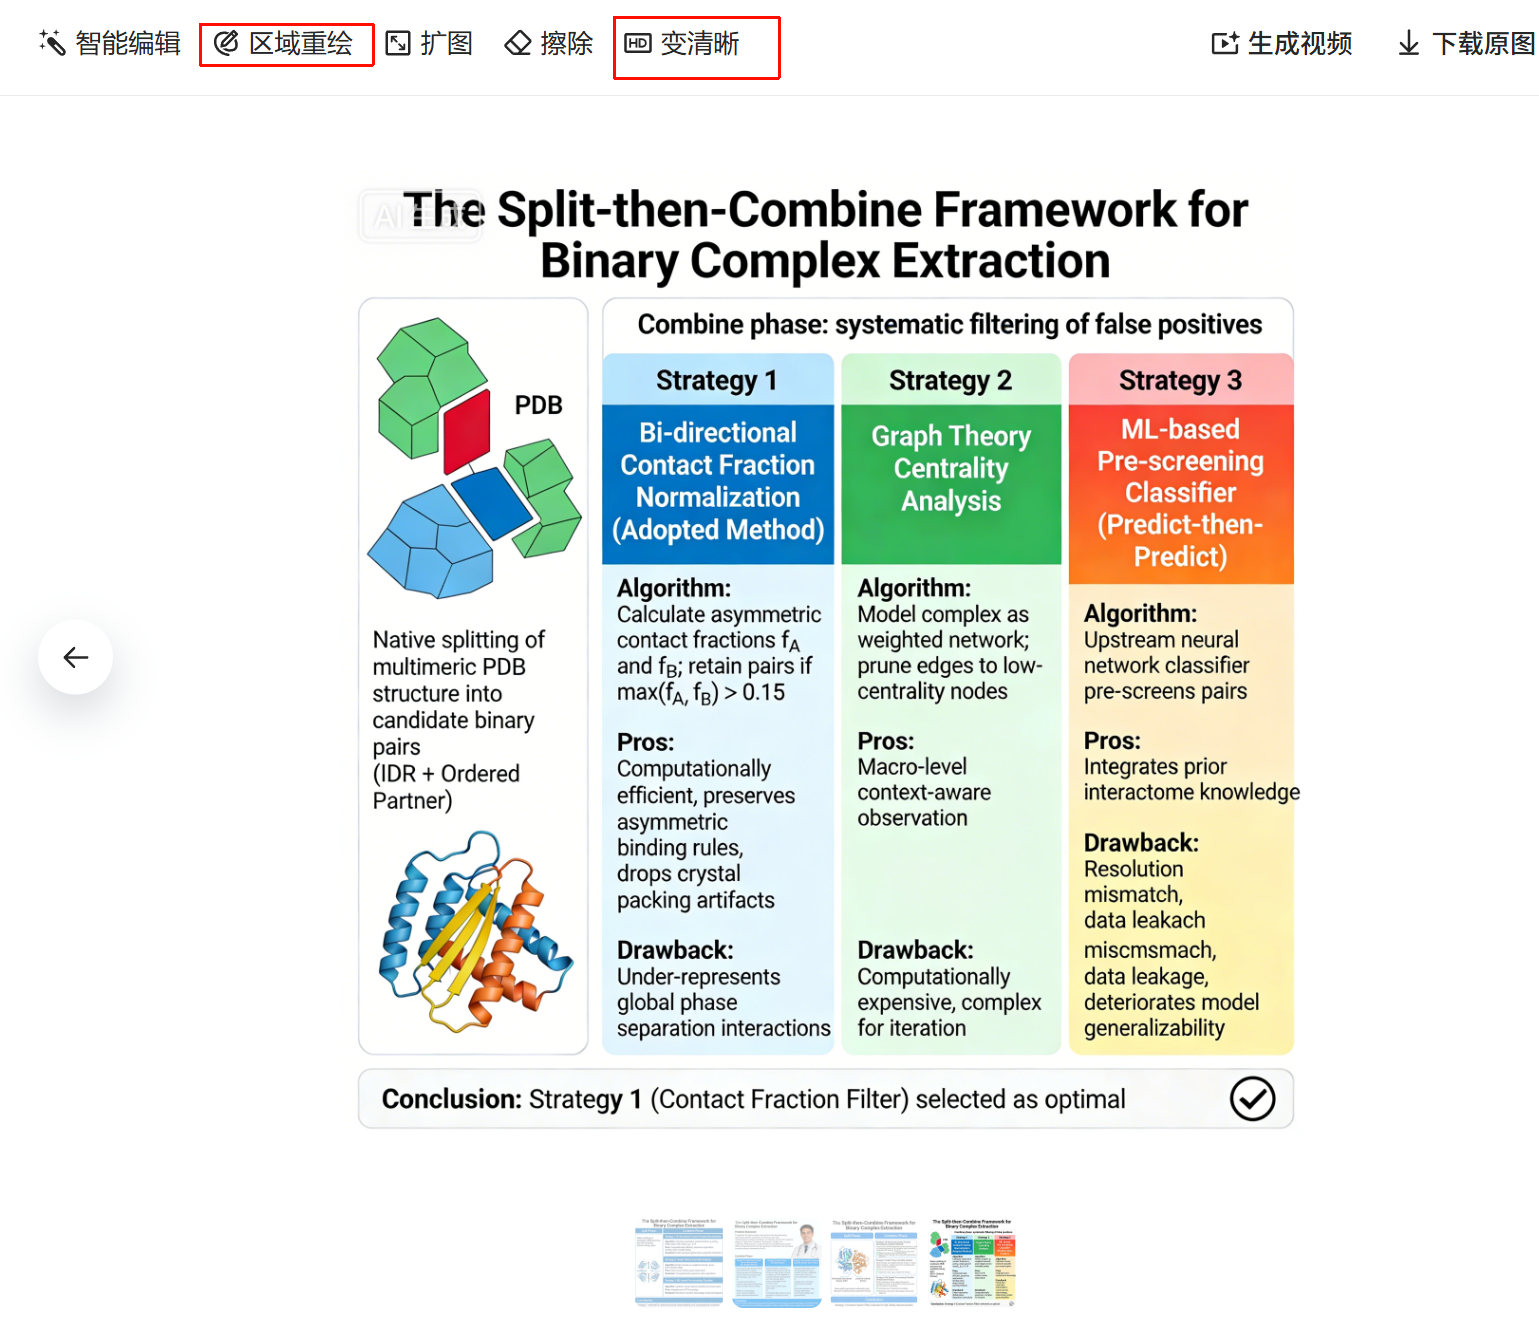
- 如果一开始没生成合格,要么不断重新生成直到达成条件1。要么,就是选择区域重绘、不断修改prompt
⚠️ 但是我个人多次体验下来,基本上区域重绘会直接把文字变成真正的火星文,完全不是人类可读的文字,所以一般不推荐,变清晰倒是可以试试。
但是,我们能不能通过精细的prompt从源头上去生成一些高质量的图呢?
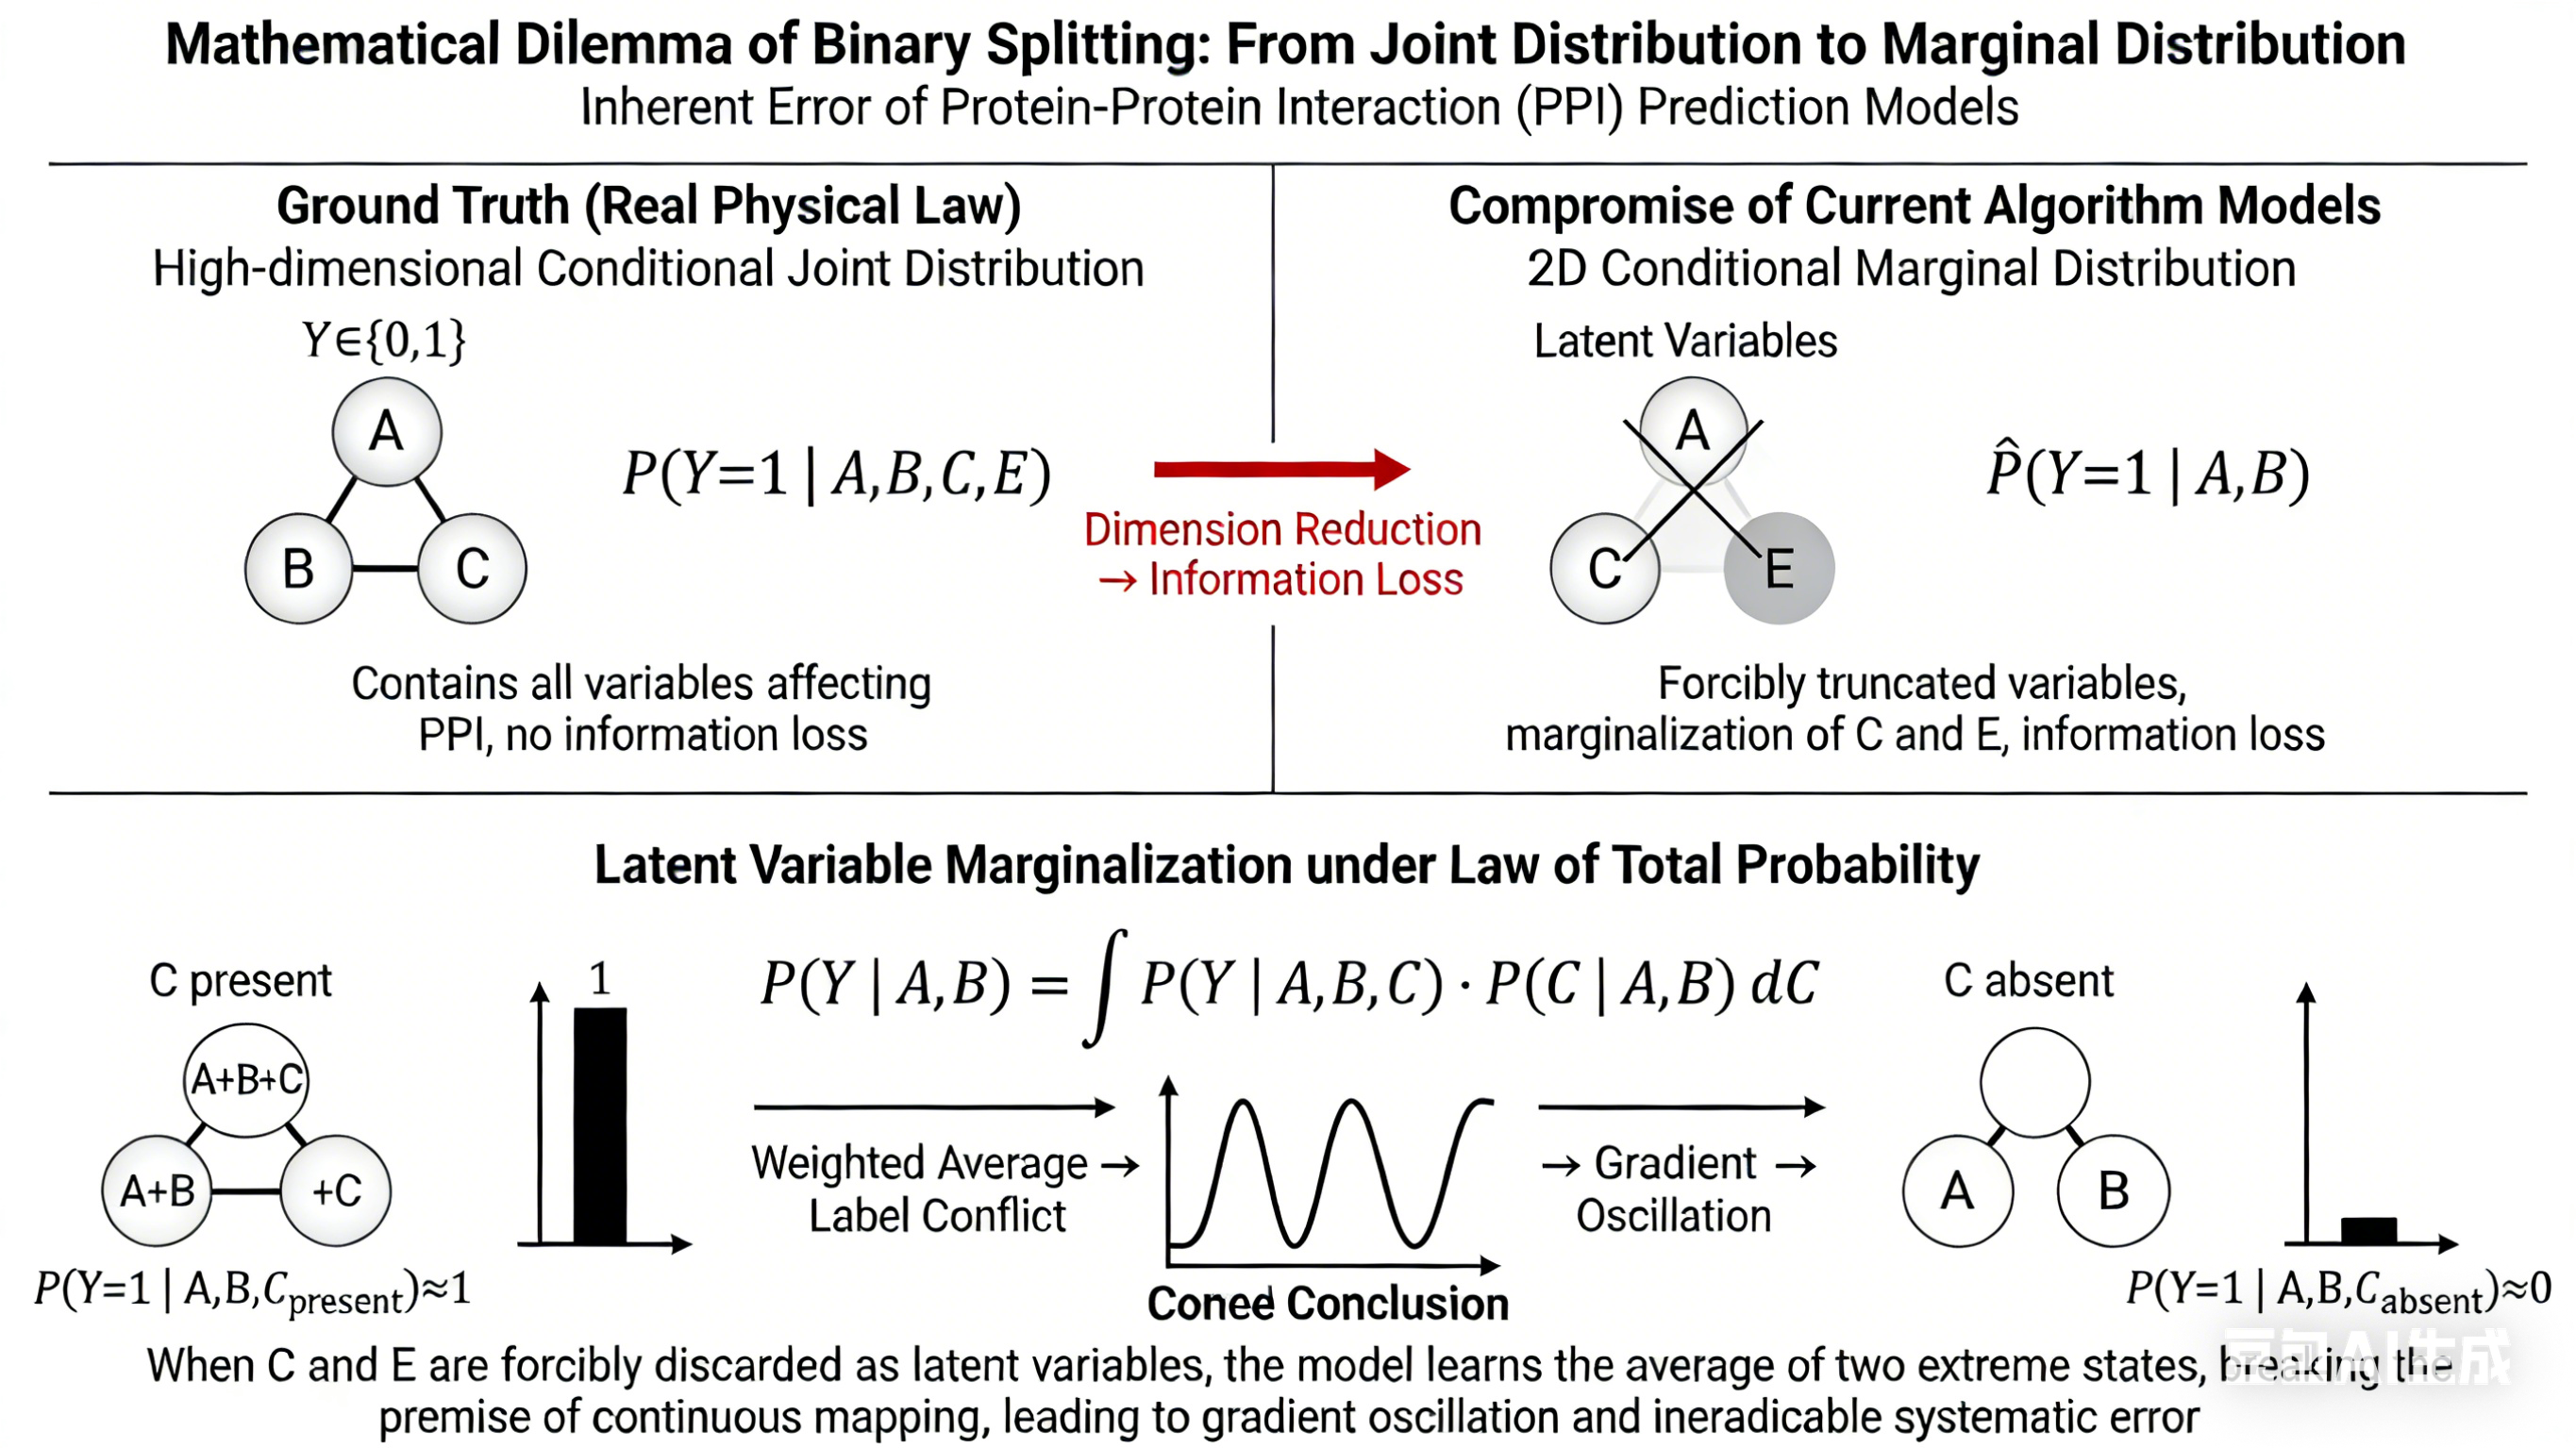
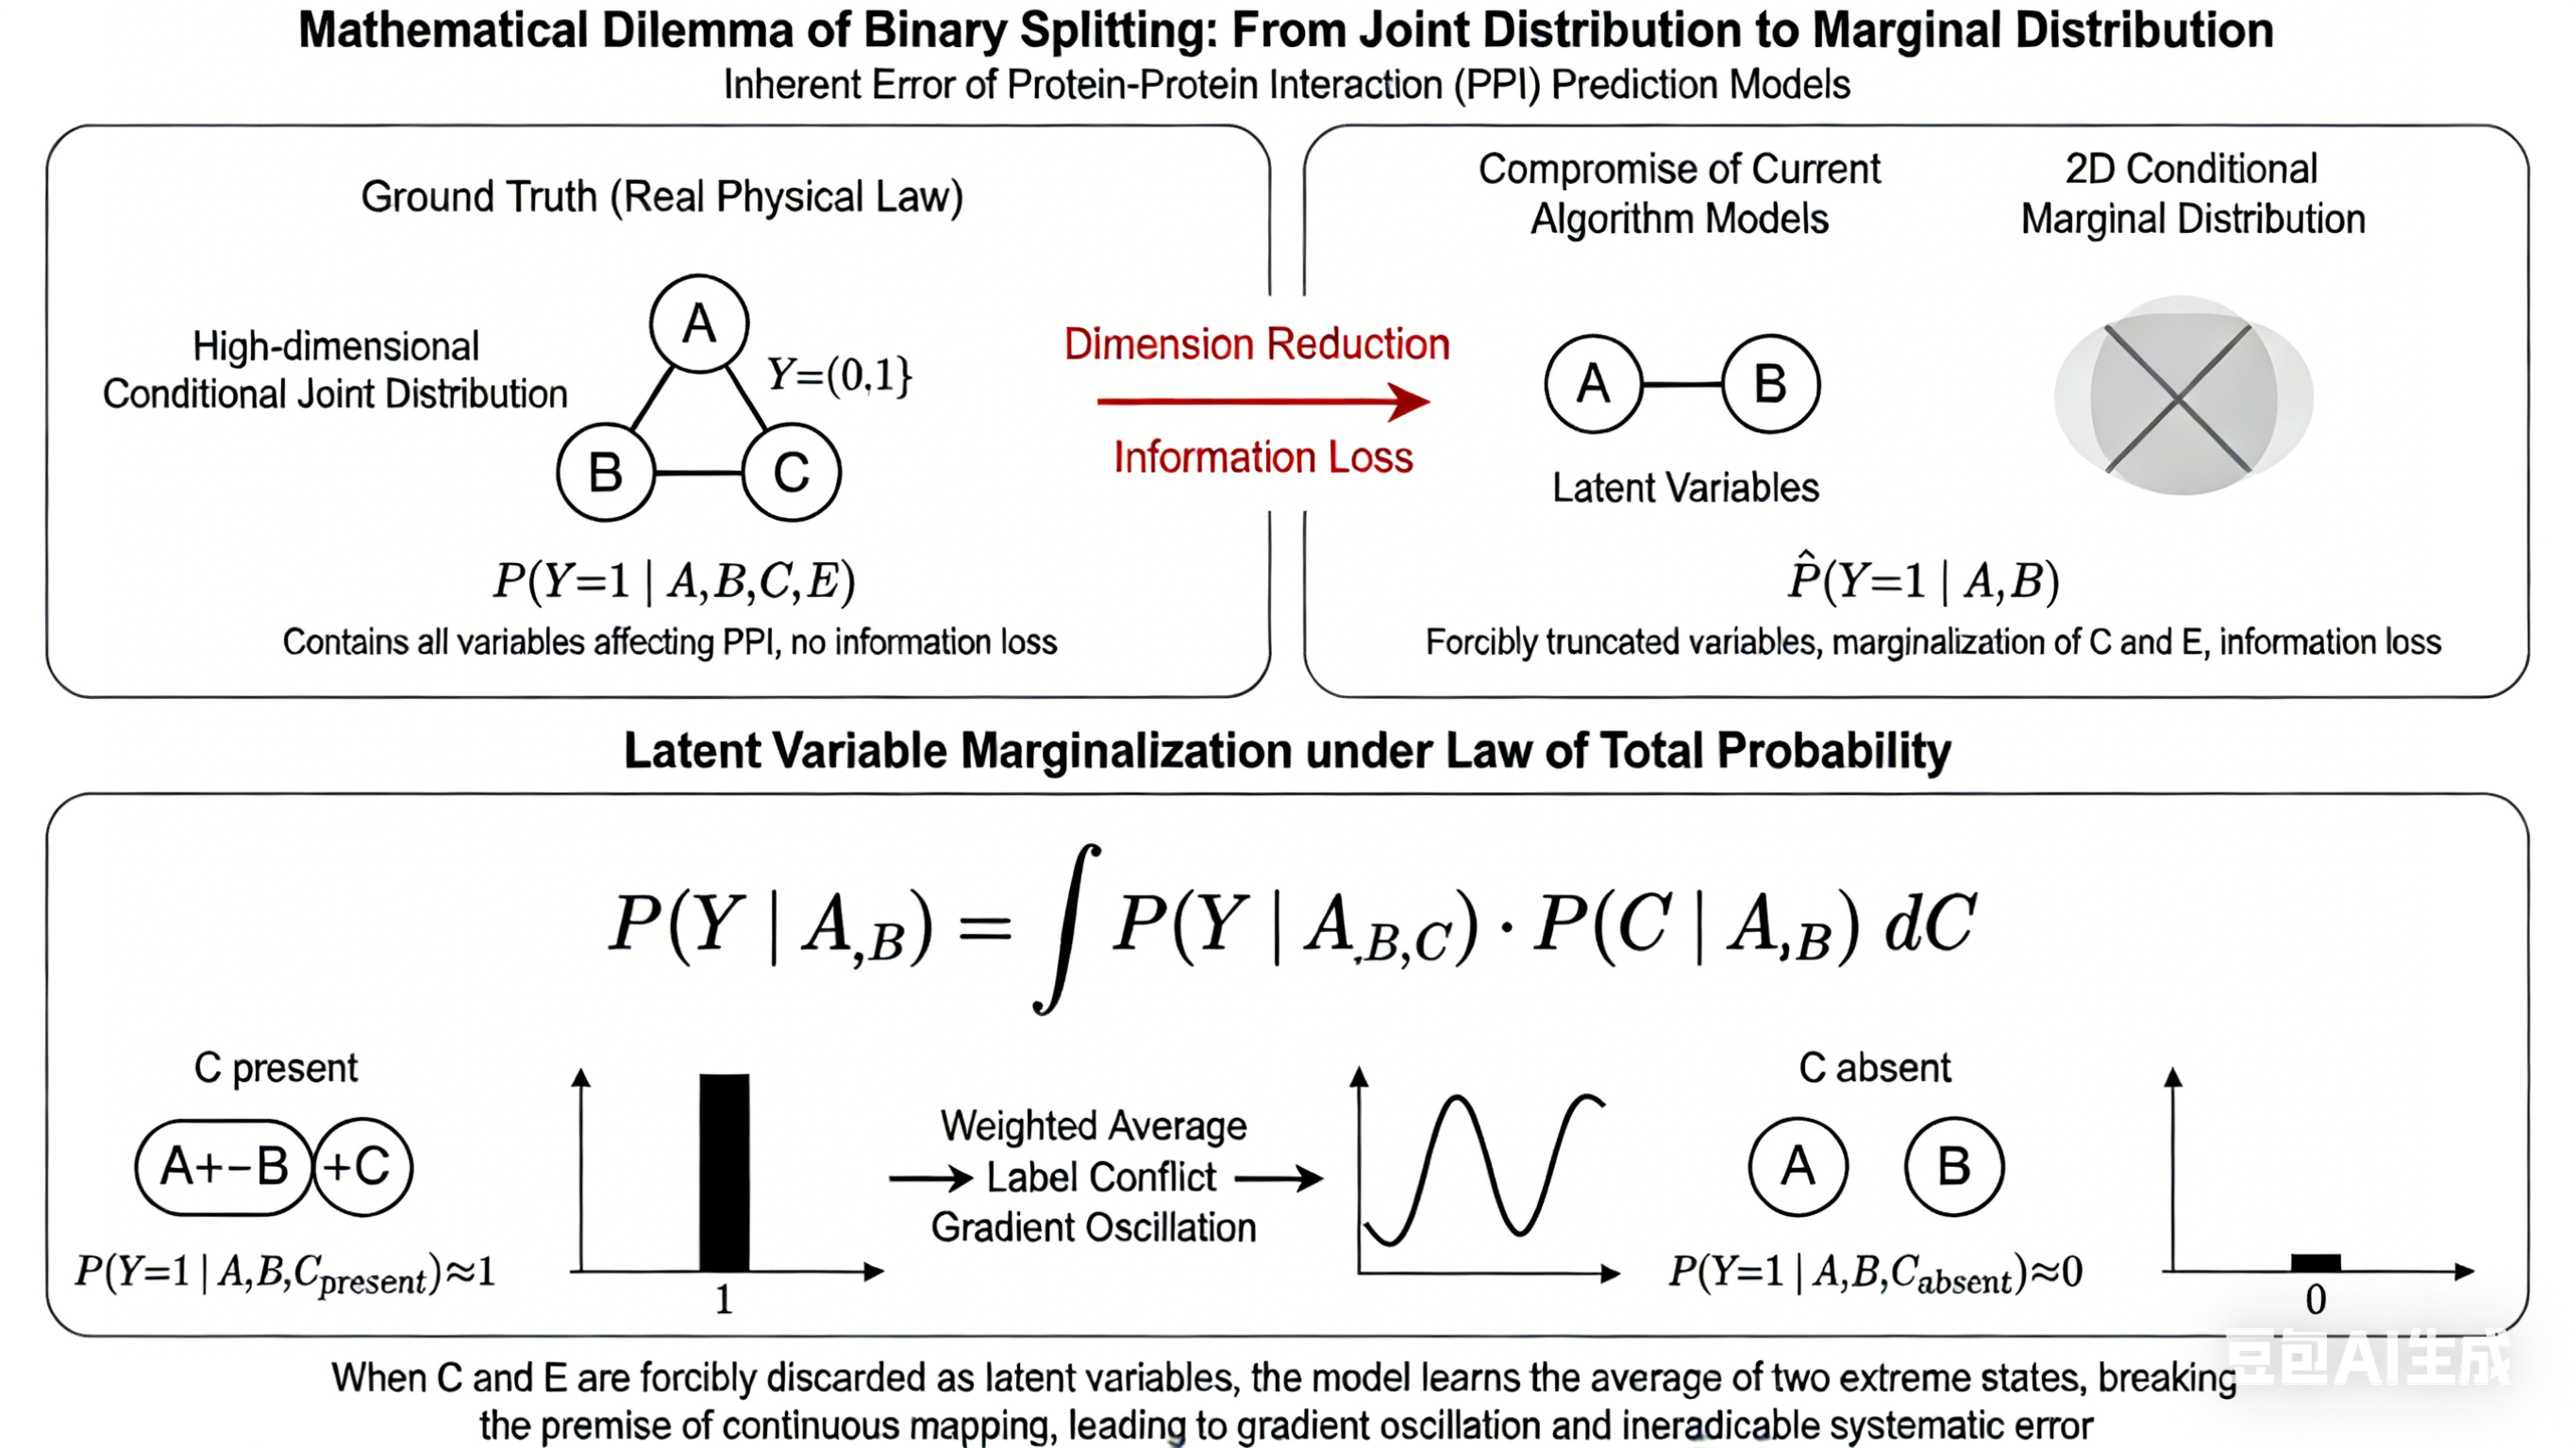
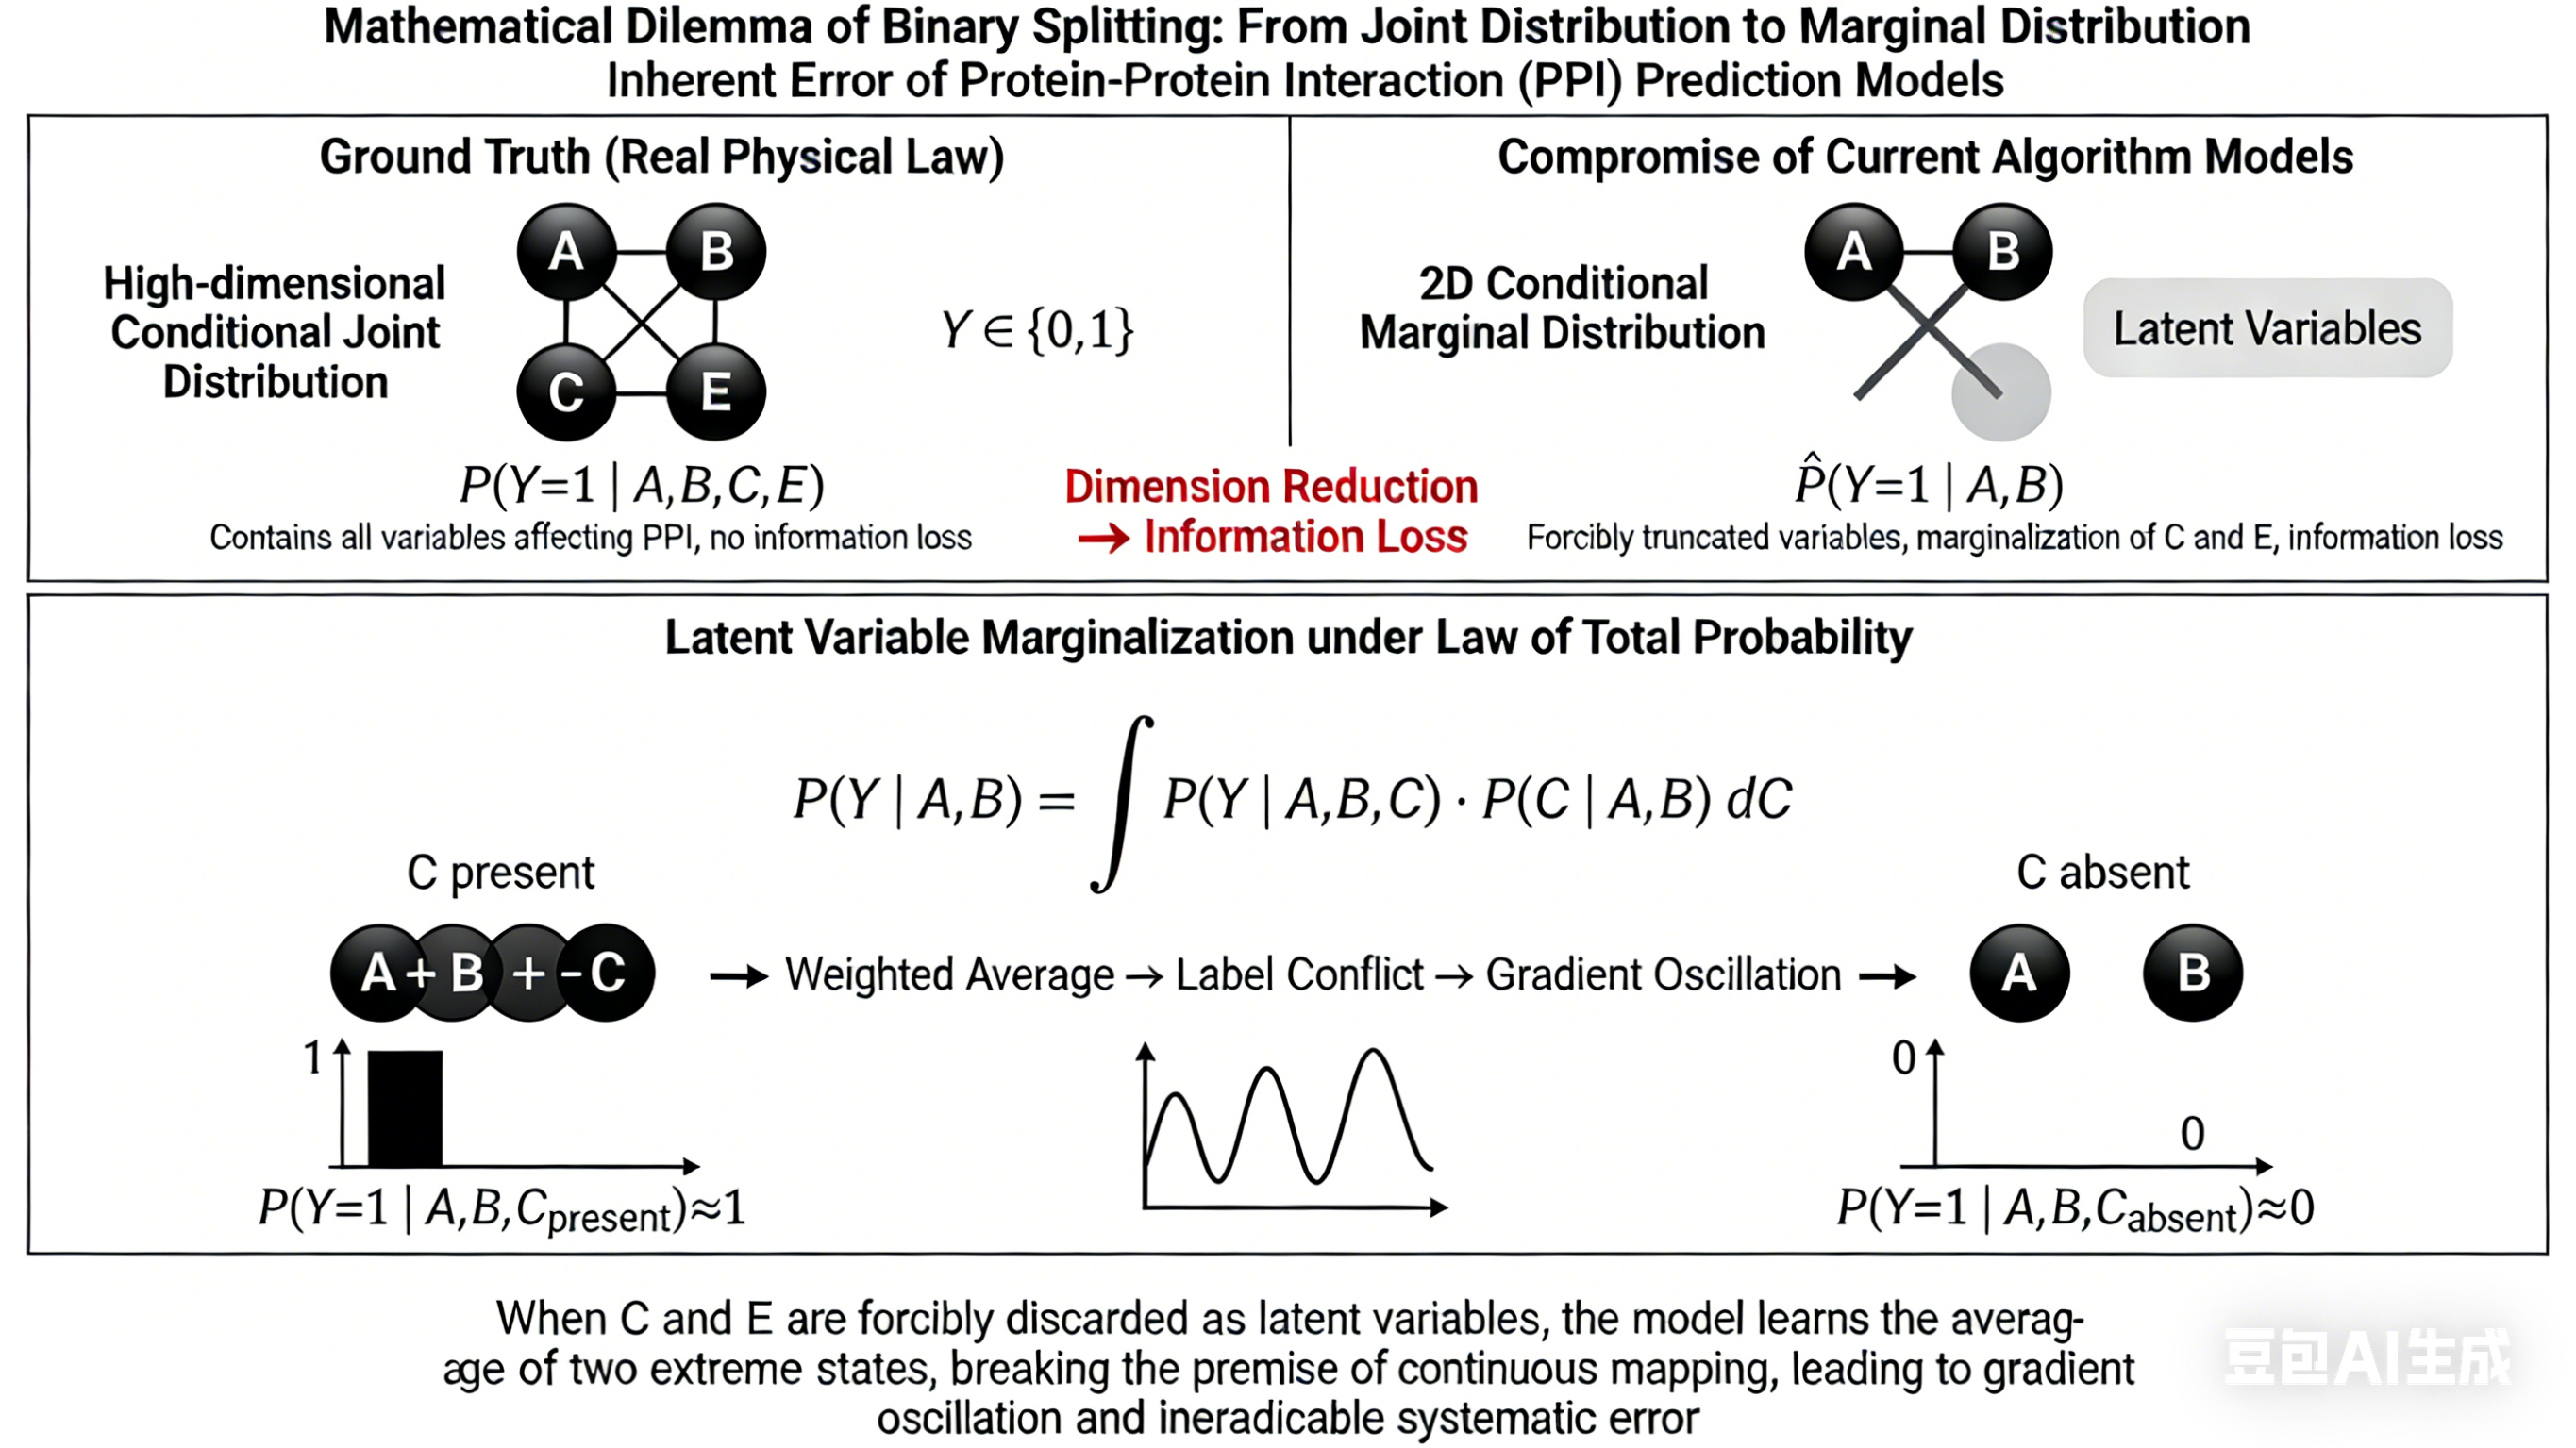
我试了以下这个关于1个简单的统计方面(也就是数学方面)的提示词,专门由gemini润色过
python
帮我生成图片:Academic PPT illustration for scientific report, 16:9 widescreen, minimalist flat design, white background, high contrast black text, professional and clean, no redundant decoration, 300DPI, print quality, all mathematical formulas are standard LaTeX typeset, no garbled characters.
Top main title: Mathematical Dilemma of Binary Splitting: From Joint Distribution to Marginal Distribution, subtitle: Inherent Error of Protein-Protein Interaction (PPI) Prediction Models
The image is divided into upper and lower modules:
[Upper Module: Left-Right Comparison]
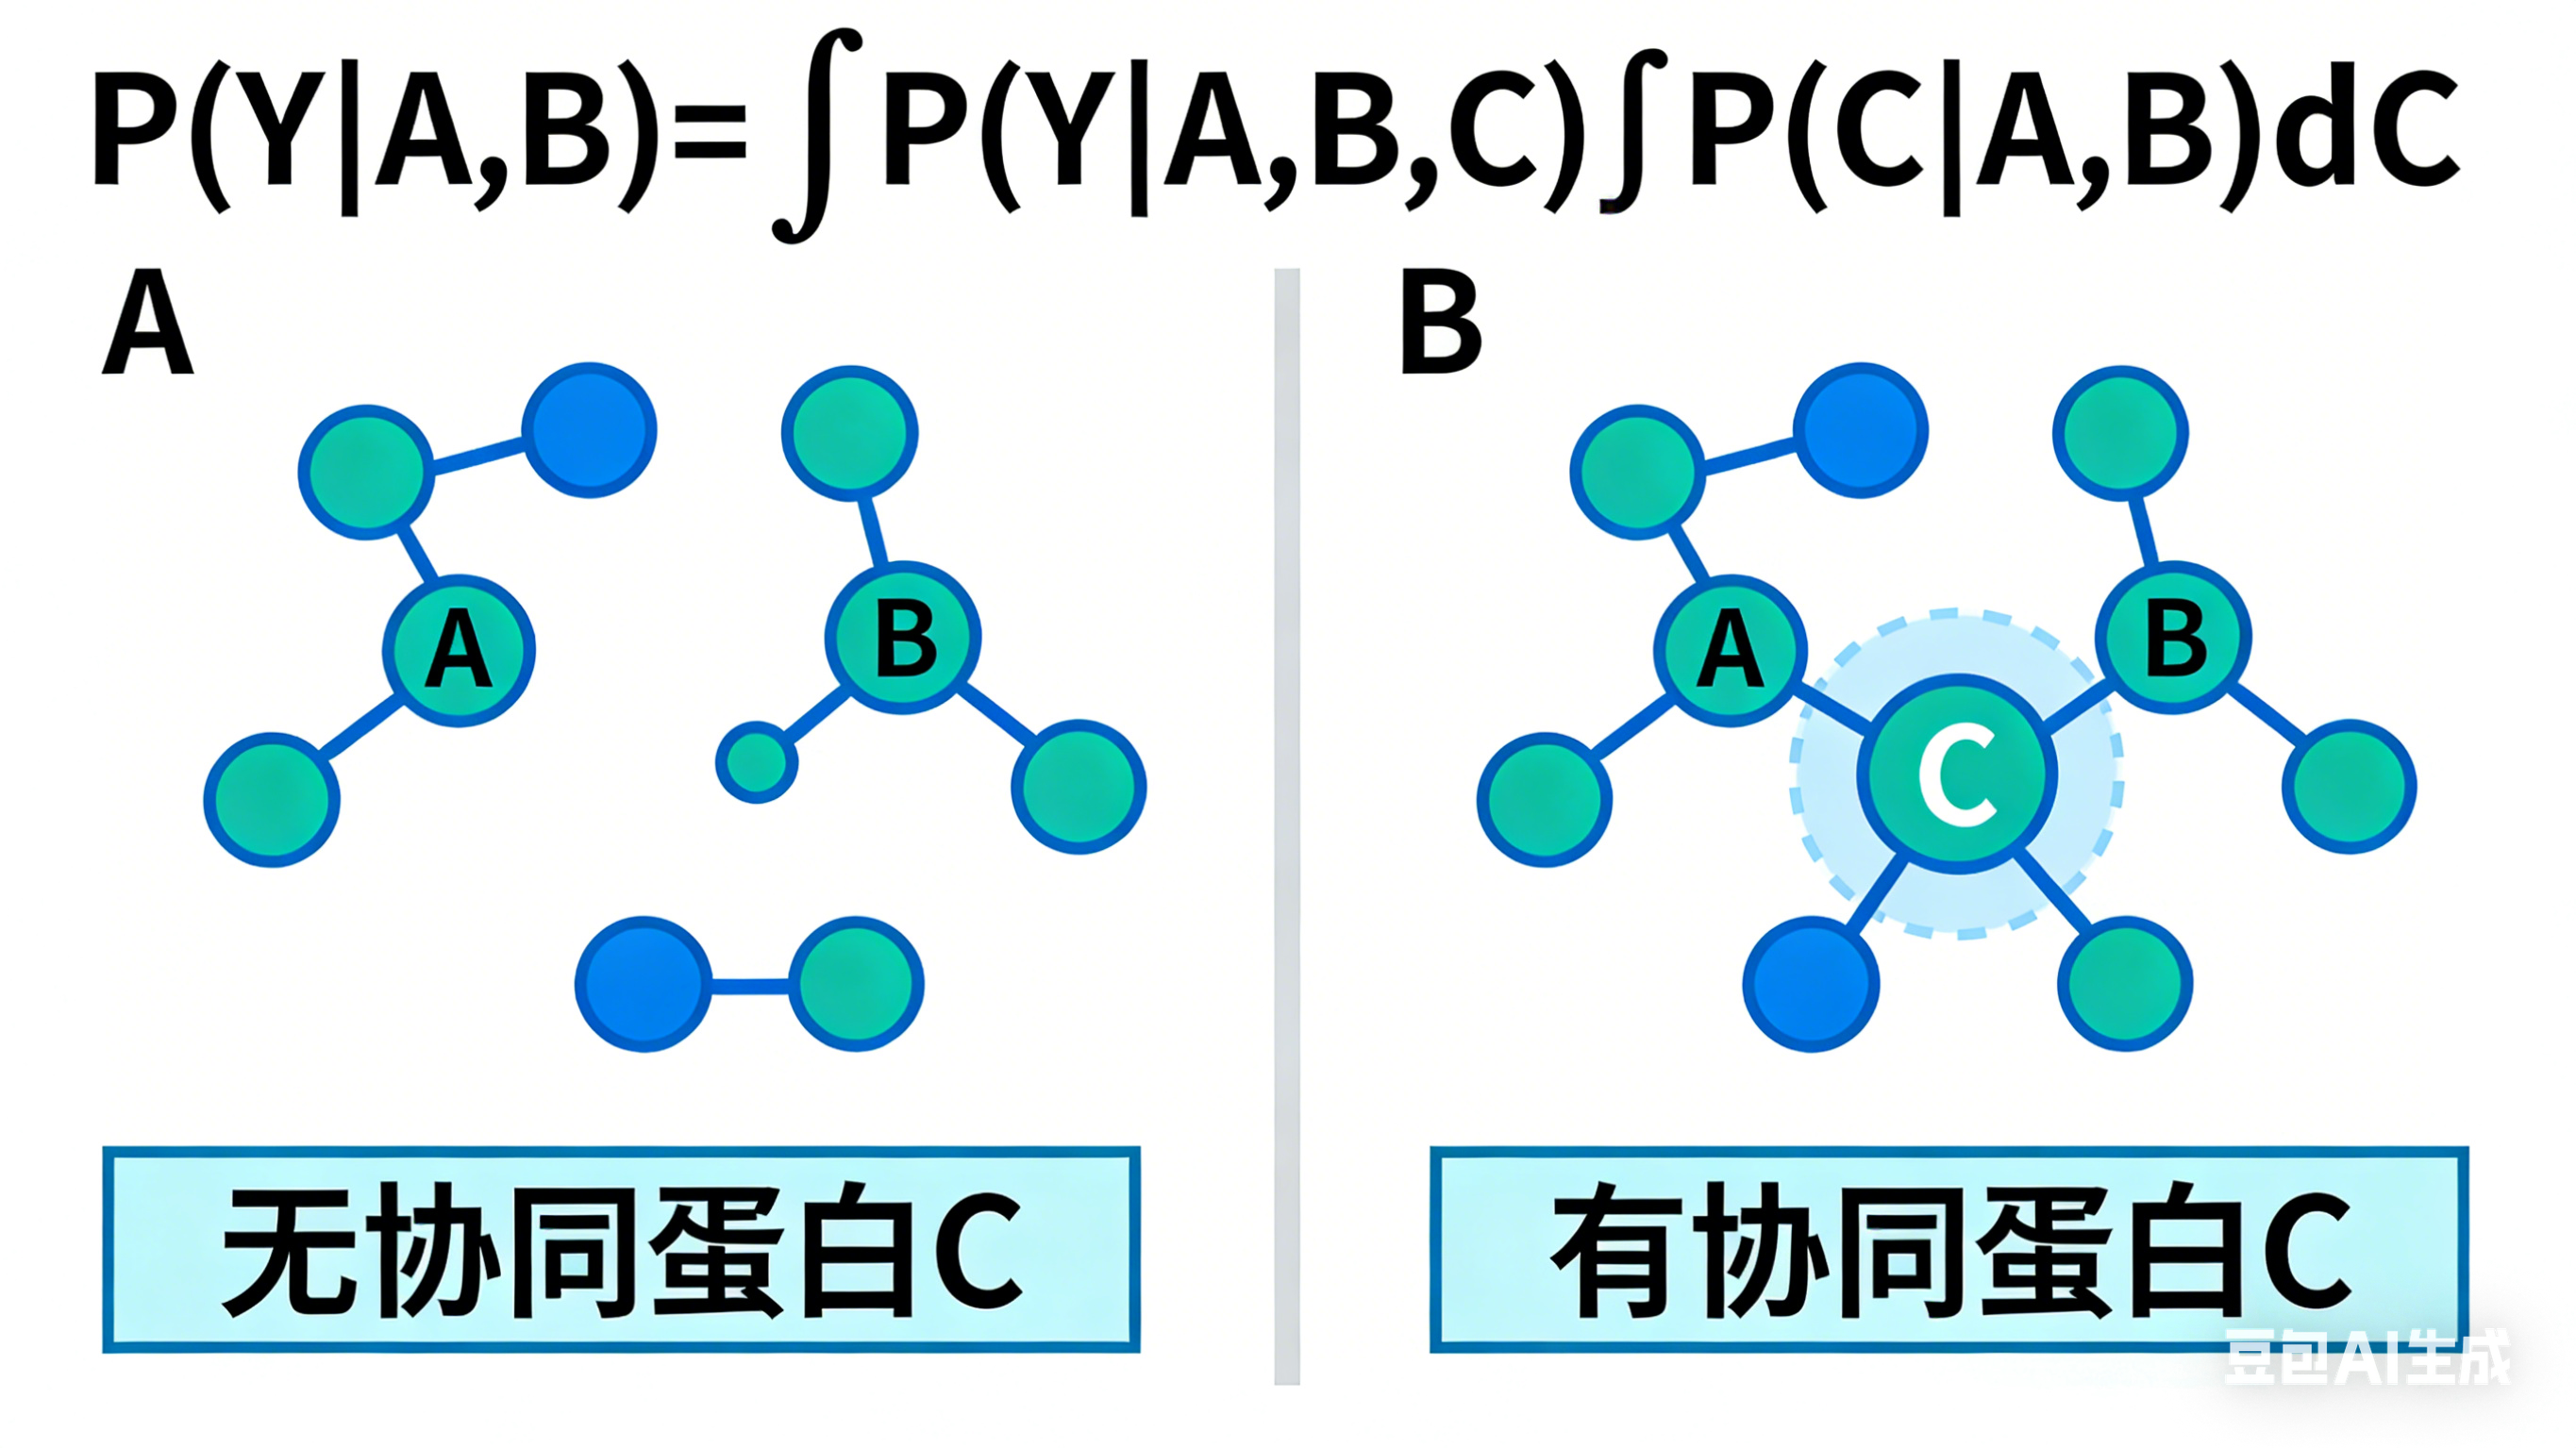
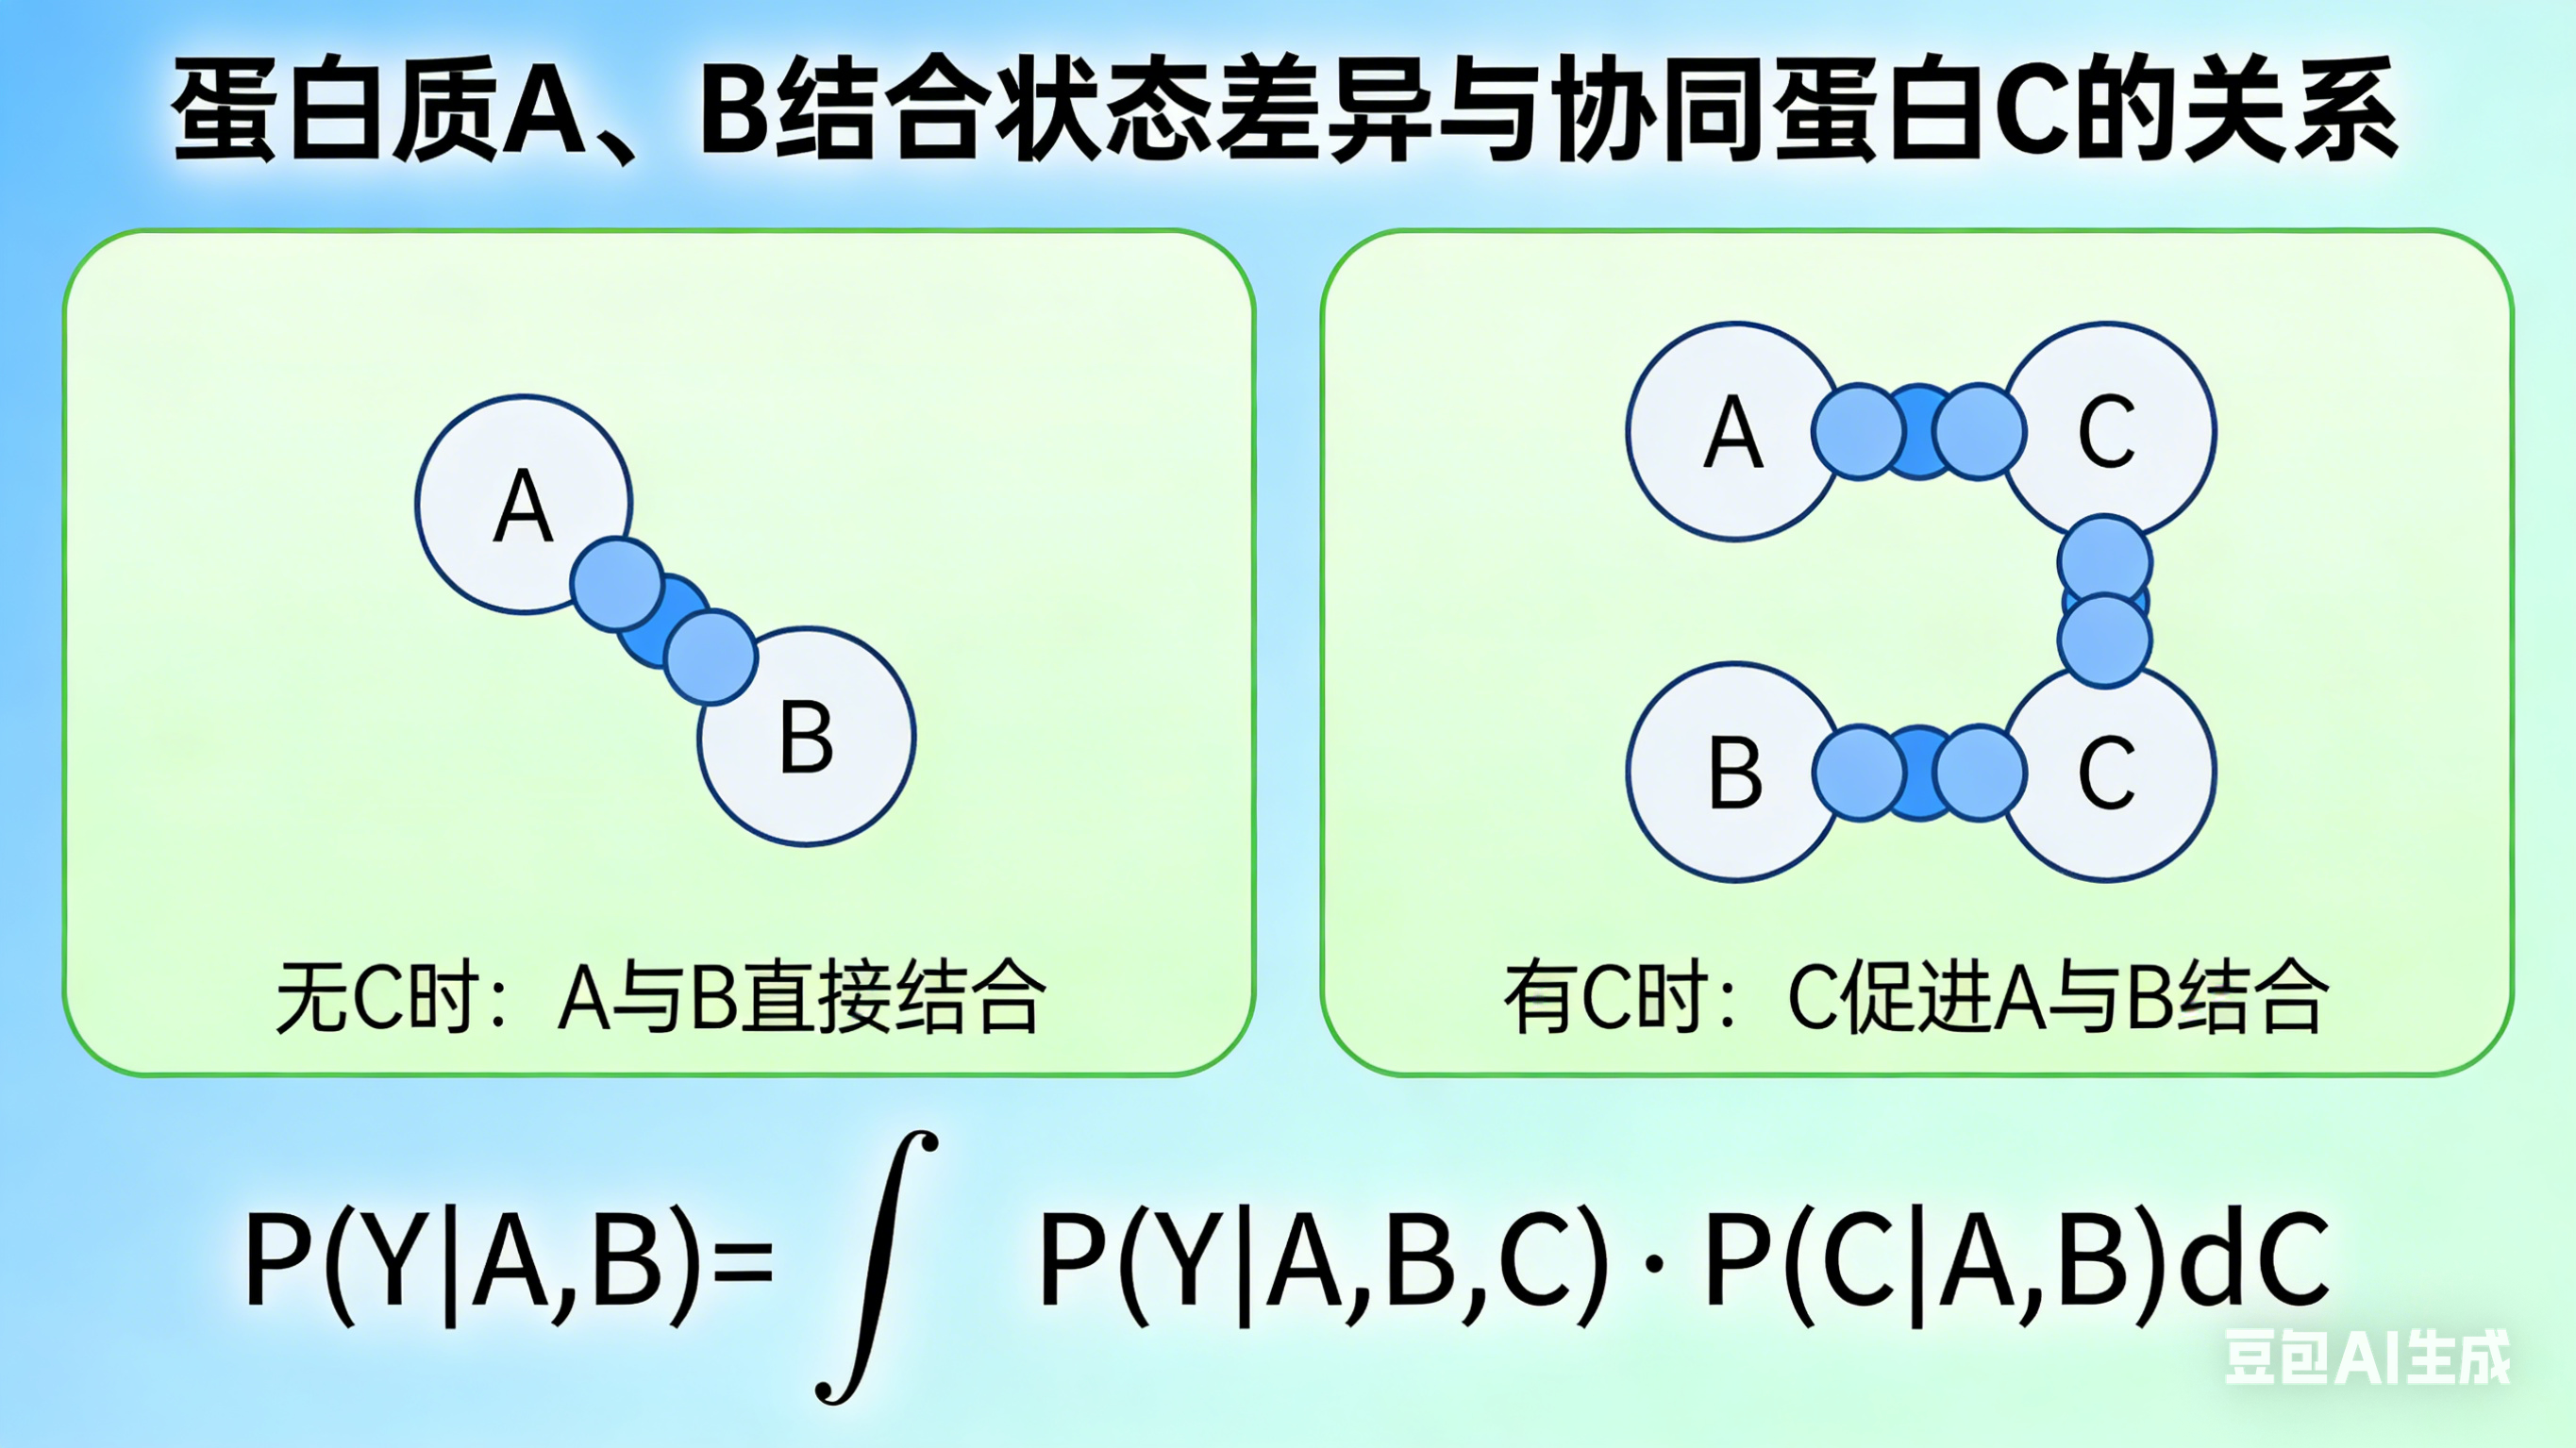
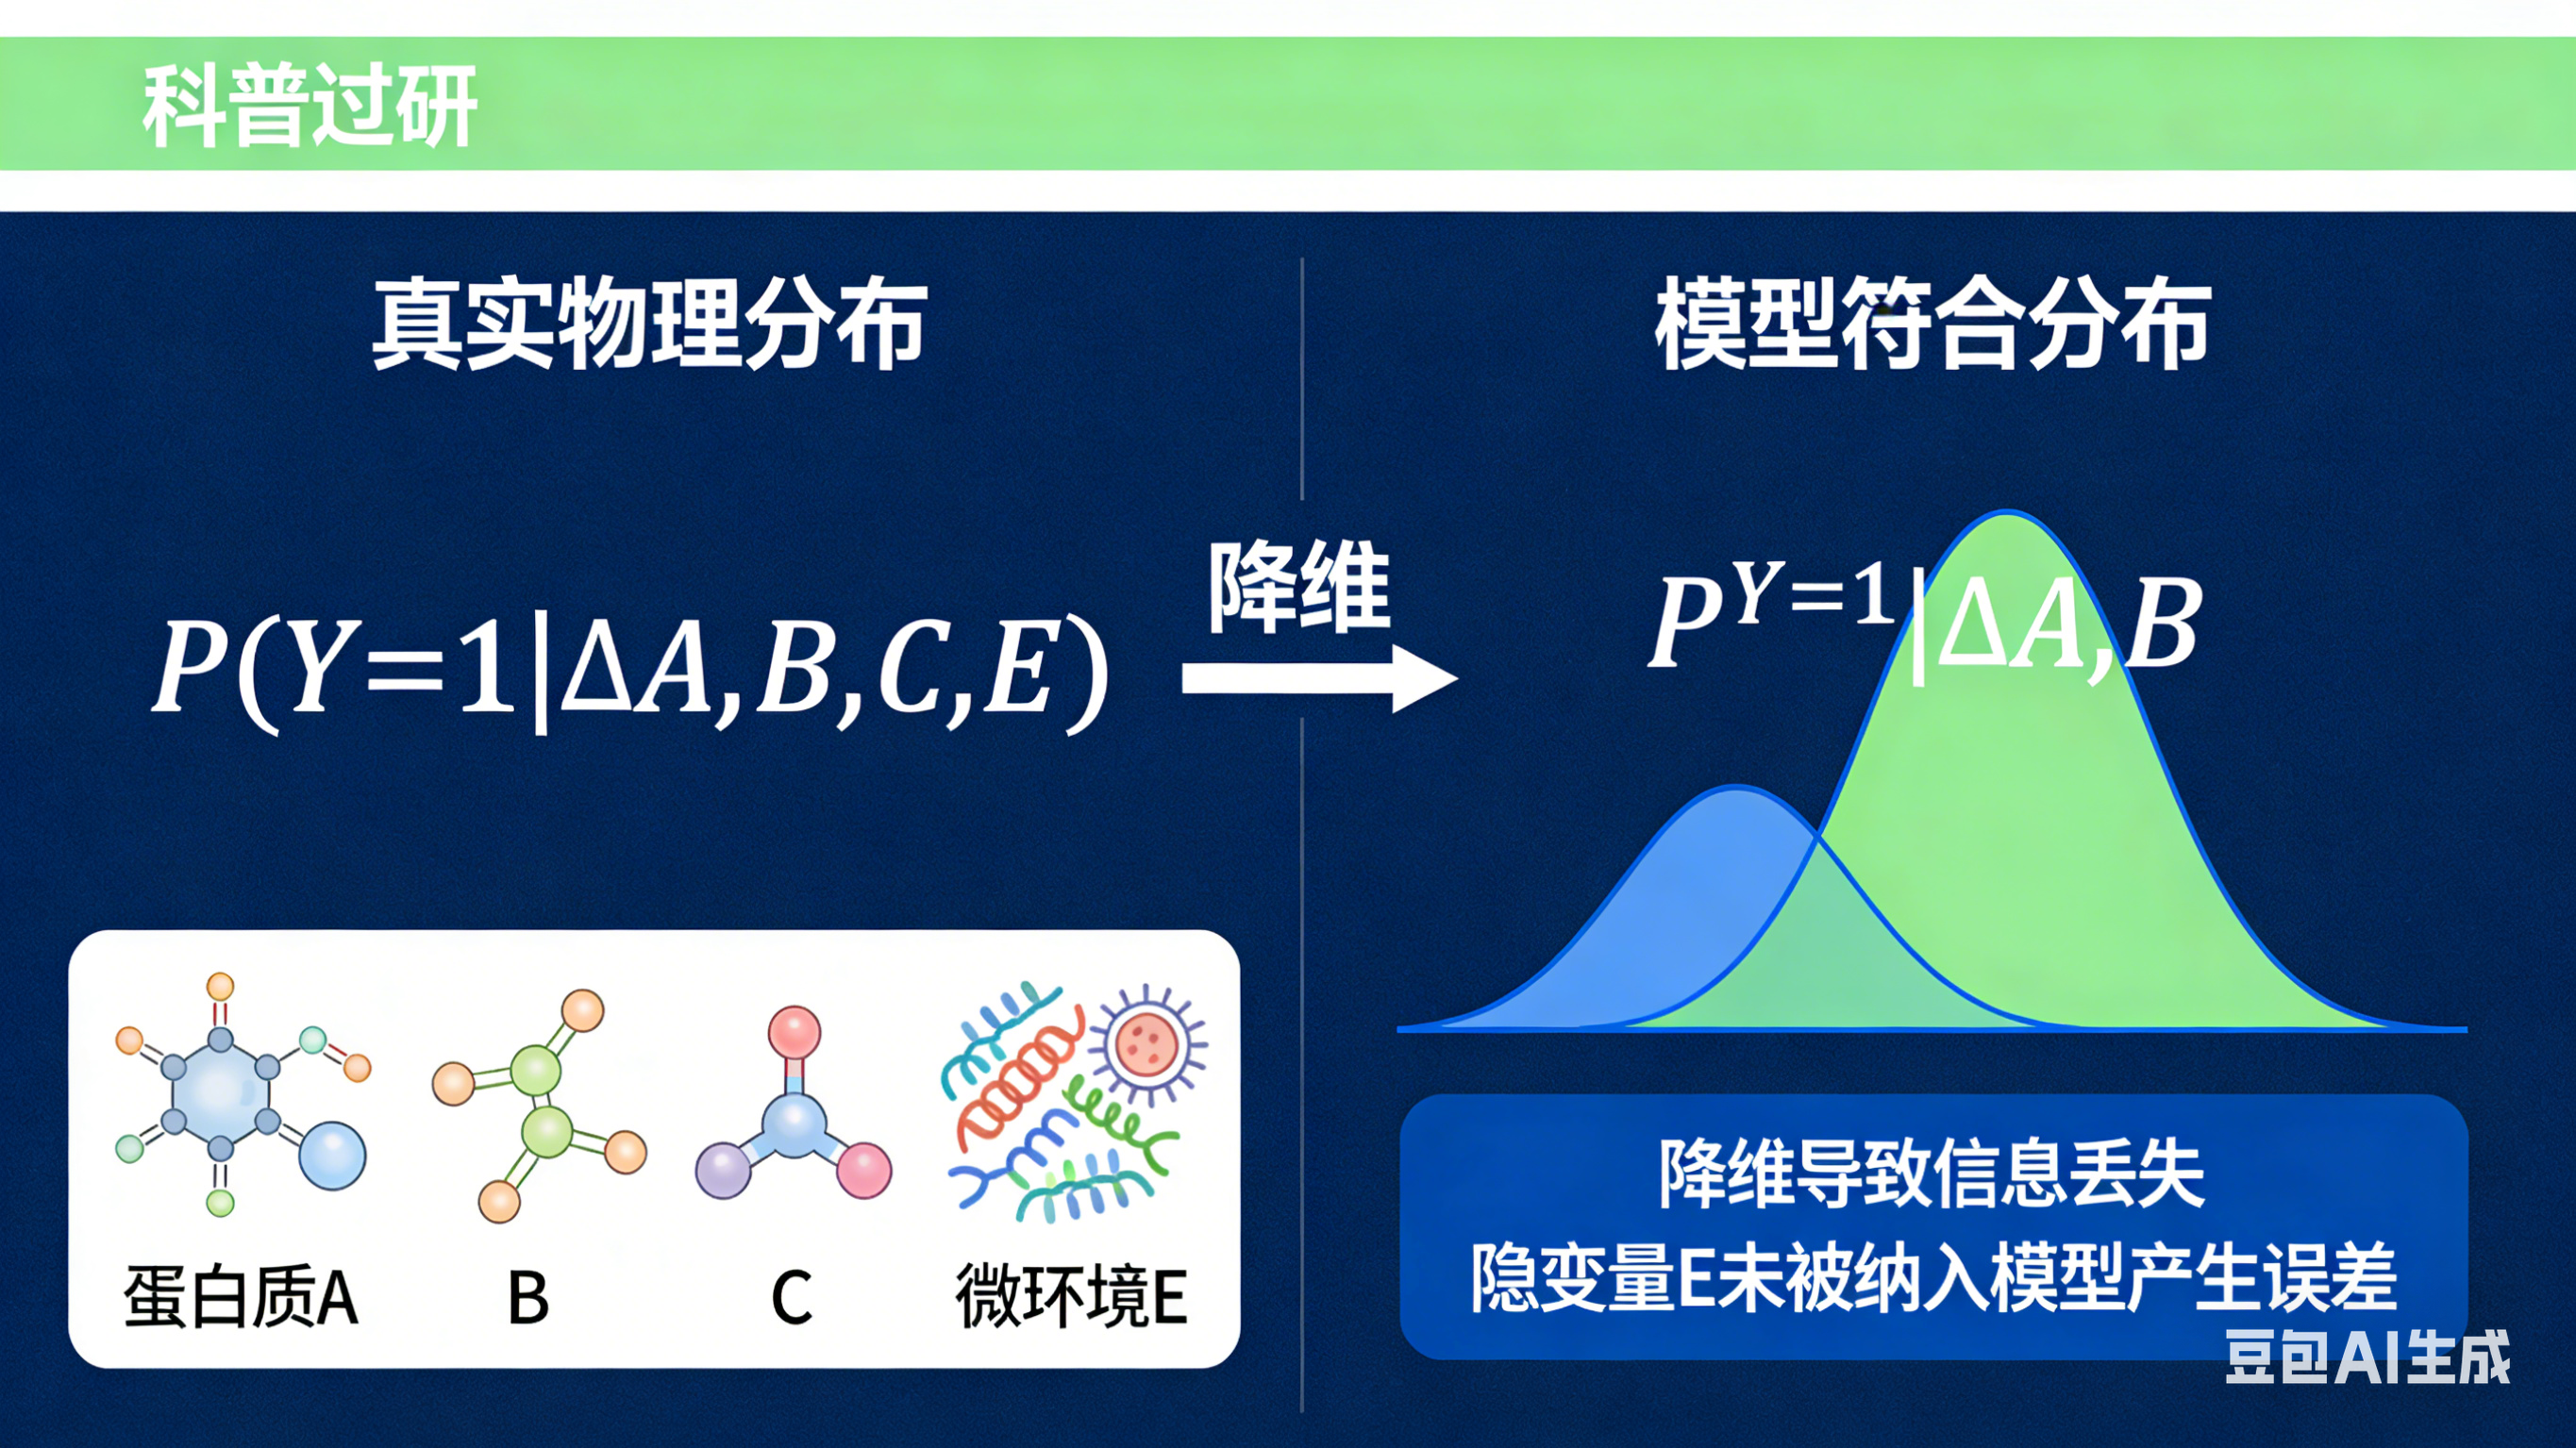
Left panel title: Ground Truth (Real Physical Law), marked "High-dimensional Conditional Joint Distribution"
- Minimalist schematic: 4 spheres labeled A, B, C, E form a stable complex, with interaction event Y∈{0,1} marked
- Standard formula below: P(Y=1 | A,B,C,E)
- Small text note: Contains all variables affecting PPI, no information loss
Right panel title: Compromise of Current Algorithm Models, marked "2D Conditional Marginal Distribution"
- Corresponding schematic: Only spheres A and B are retained, C and E are crossed out and turned into gray translucent, marked "Latent Variables"
- Standard formula below: \hat{P}(Y=1 | A,B)
- Small text note: Forcibly truncated variables, marginalization of C and E, information loss
A red arrow between the two panels is marked "Dimension Reduction → Information Loss"
[Lower Module: Mathematical Essence of Error]
Centered top title: Latent Variable Marginalization under Law of Total Probability
- Centered enlarged standard integral formula: P(Y | A,B) = ∫ P(Y | A,B,C) · P(C | A,B) dC
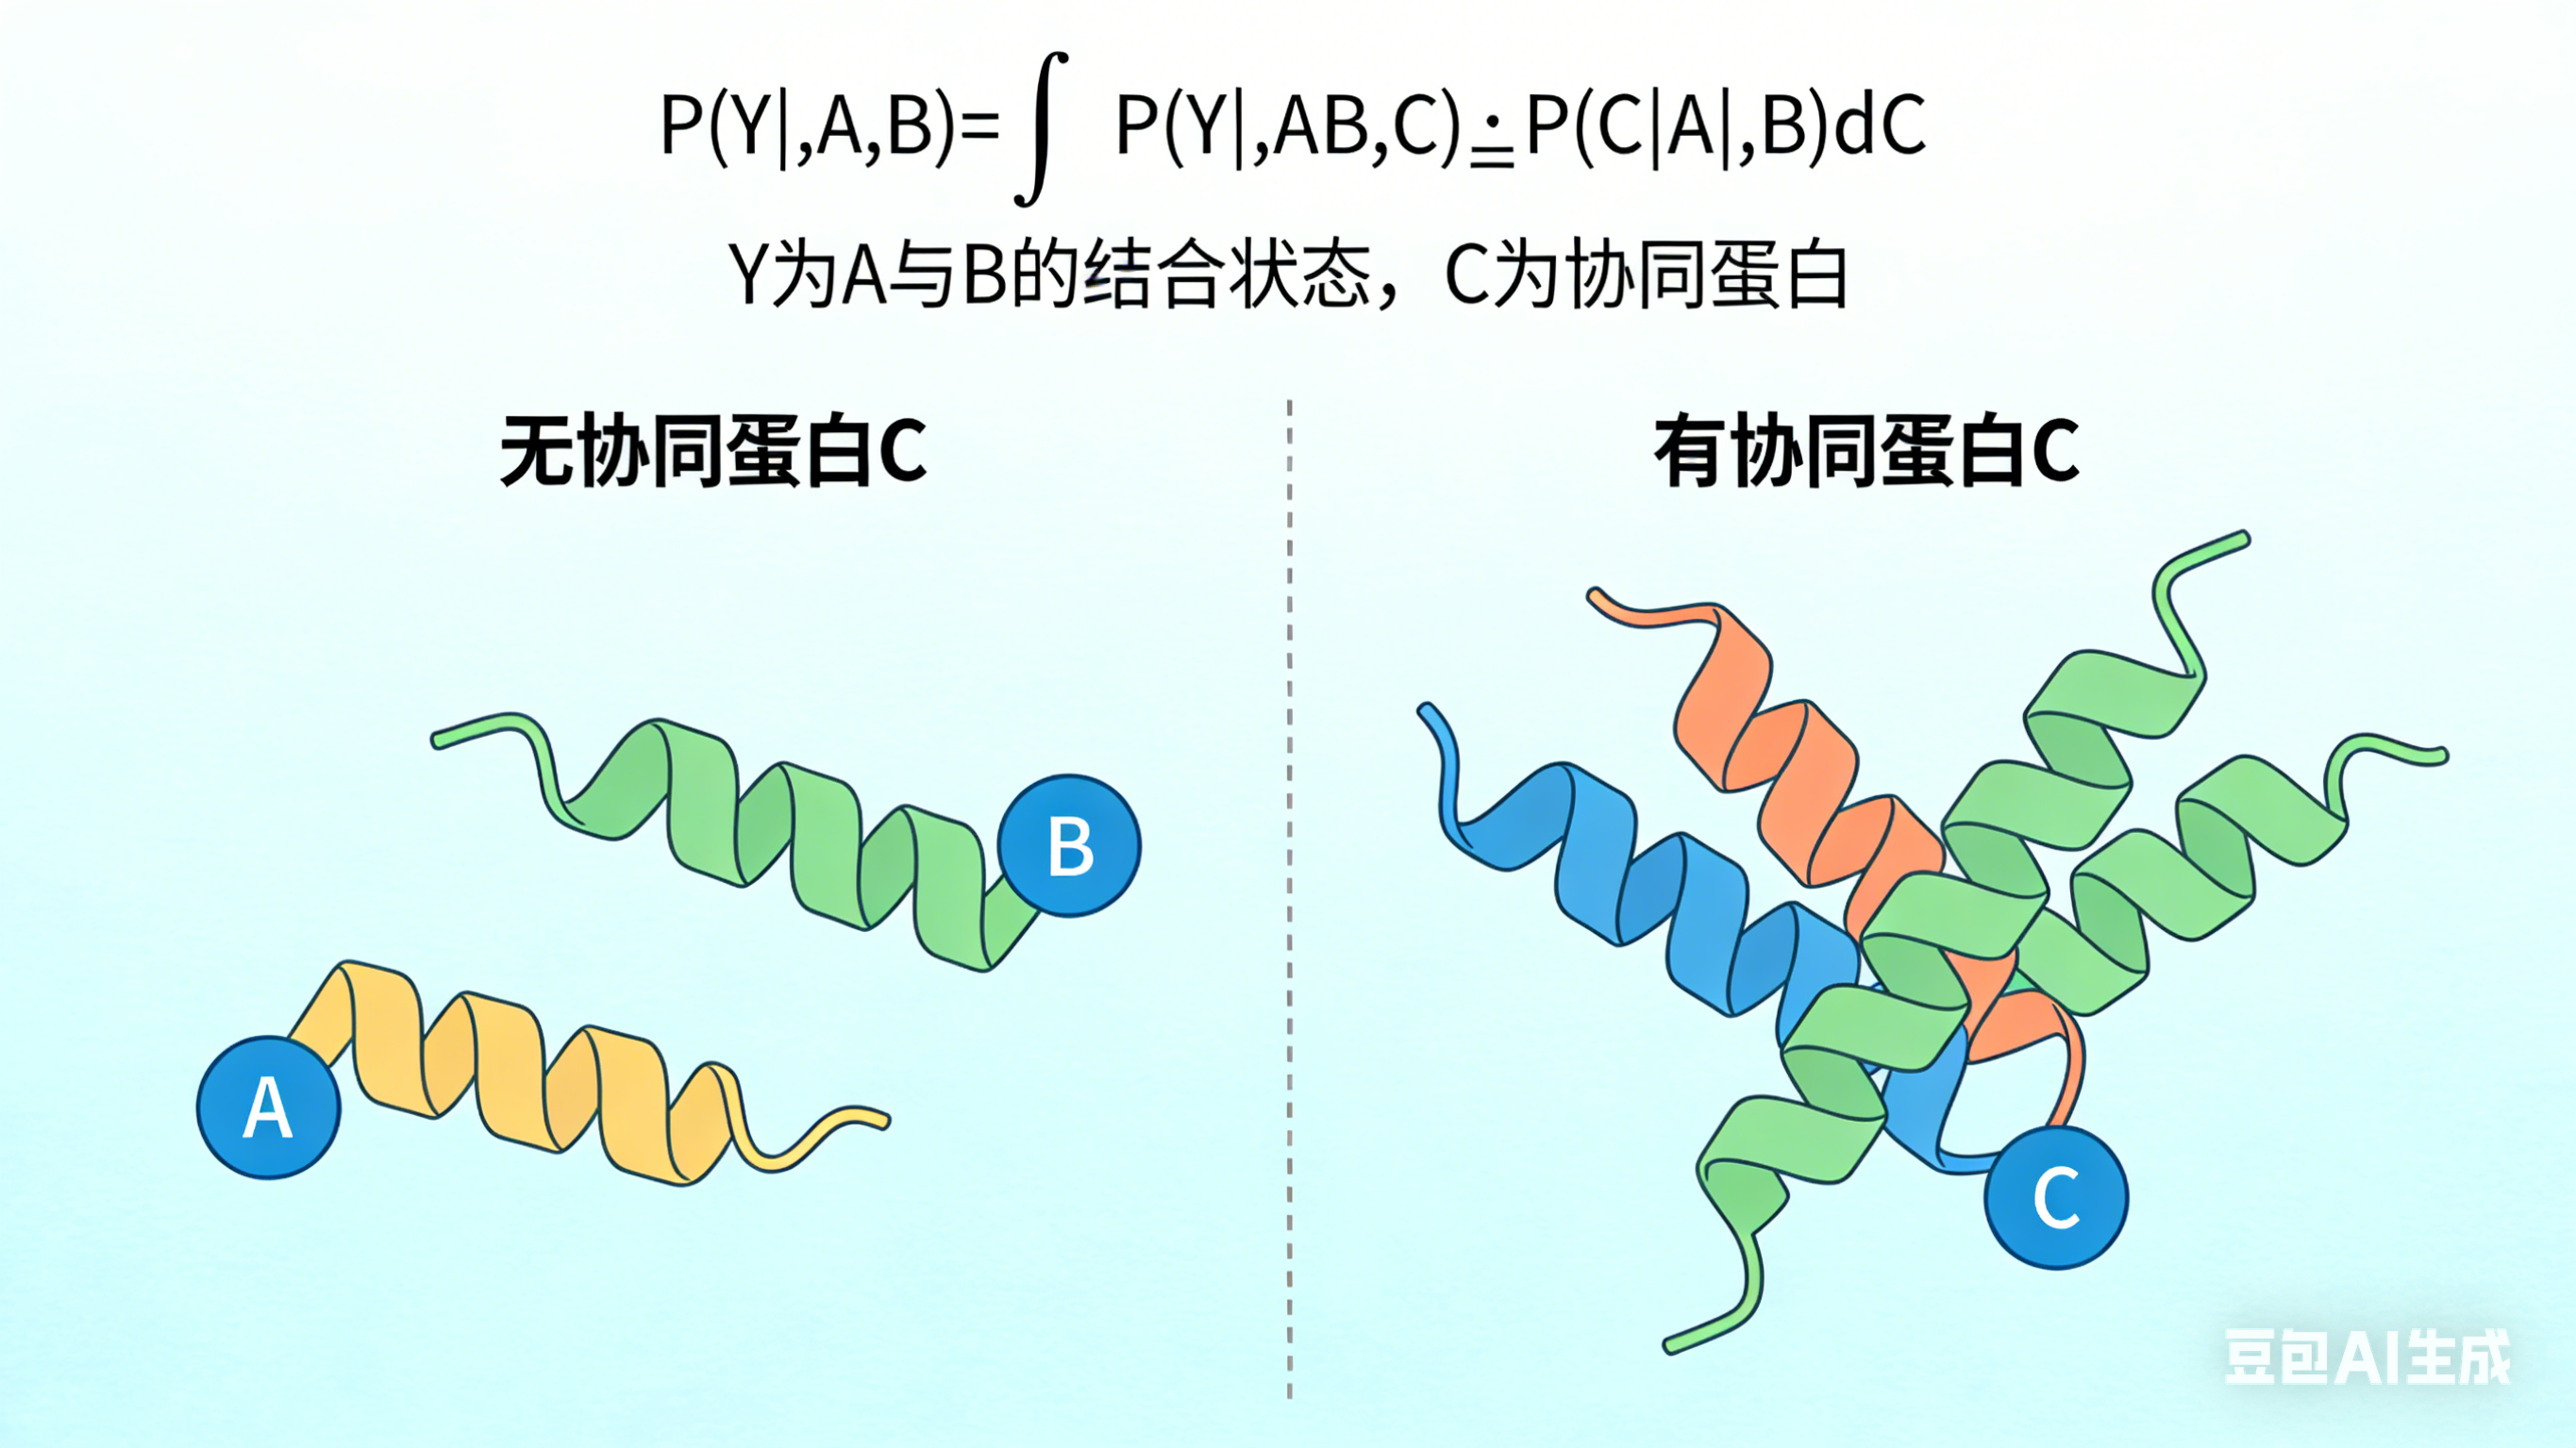
- Left-right comparison below the formula:
Left: Marked "C present", schematic: A+B+C form a trimer, formula P(Y=1 | A,B,C_present)≈1, with a bar graph with probability full to 1
Right: Marked "C absent", schematic: A and B are free without binding, formula P(Y=1 | A,B,C_absent)≈0, with a bar graph with probability 0
- Arrow between the two groups points to the middle, marked "Weighted Average → Label Conflict → Gradient Oscillation", with a schematic of a oscillating loss function curve next to it
[Bottom of the image]
Centered core conclusion: When C and E are forcibly discarded as latent variables, the model learns the average of two extreme states, breaking the premise of continuous mapping, leading to gradient oscillation and ineradicable systematic error
--ar 16:9 --style raw --v 6.0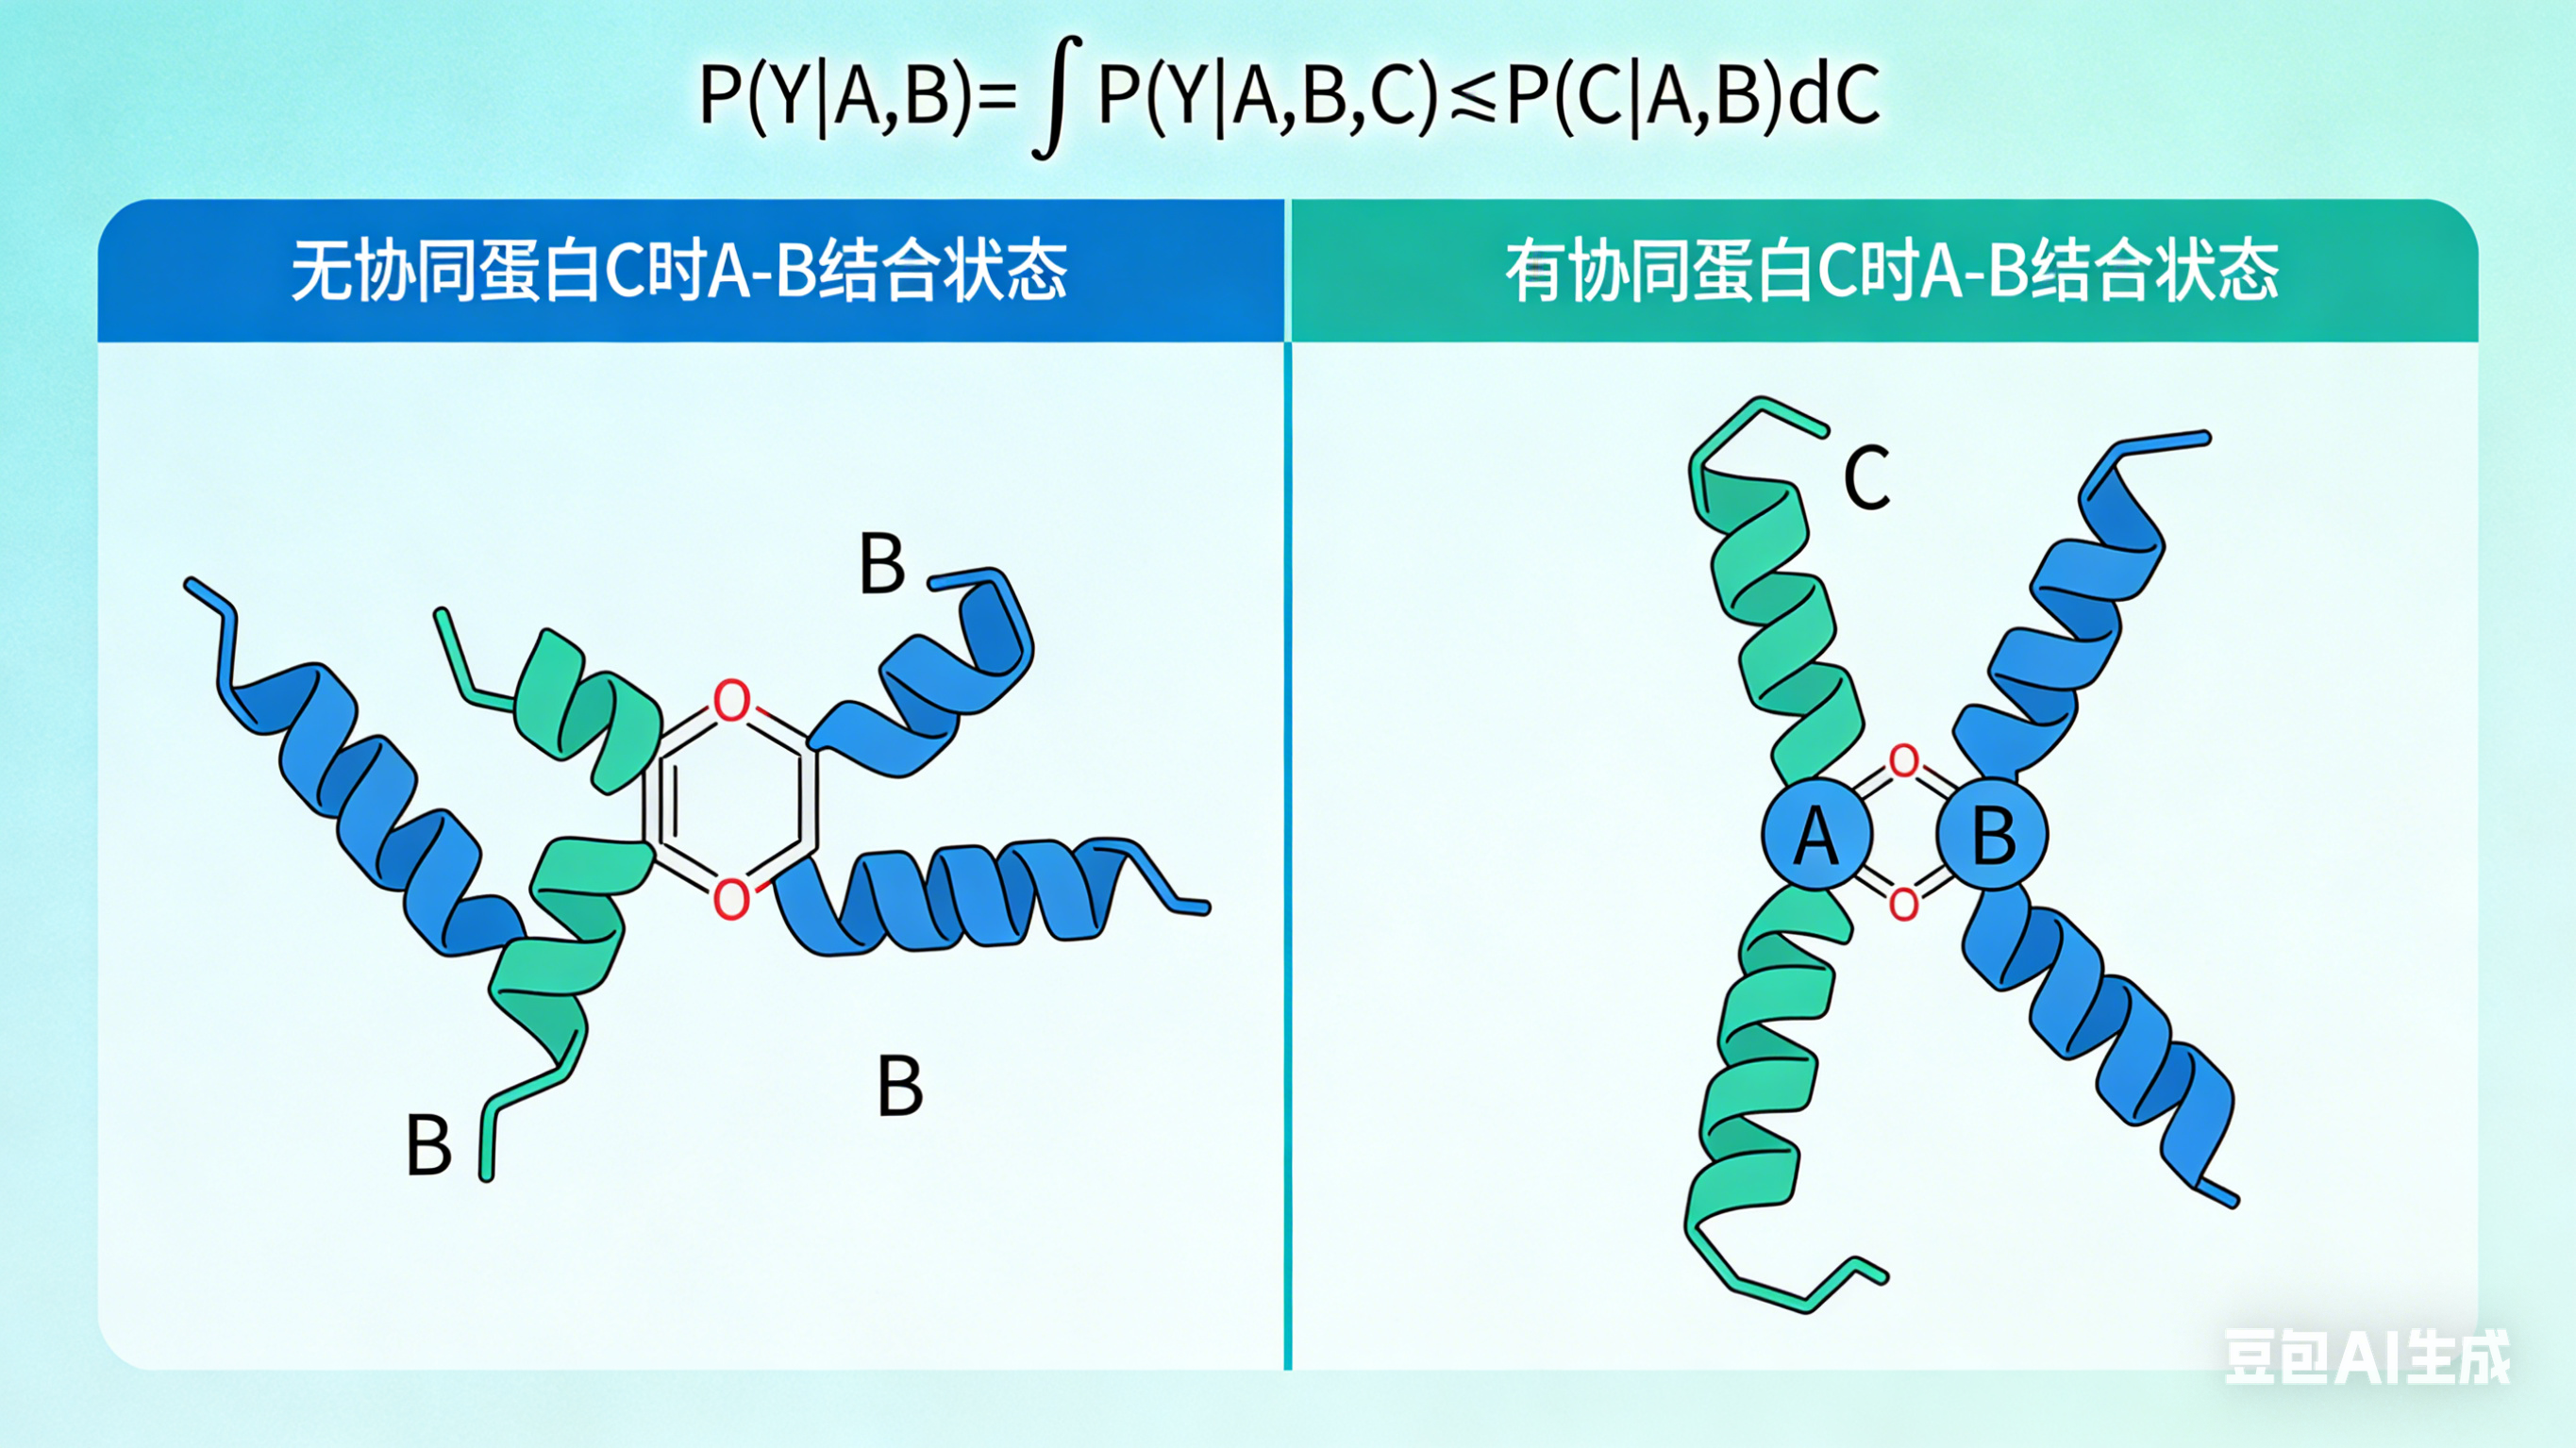
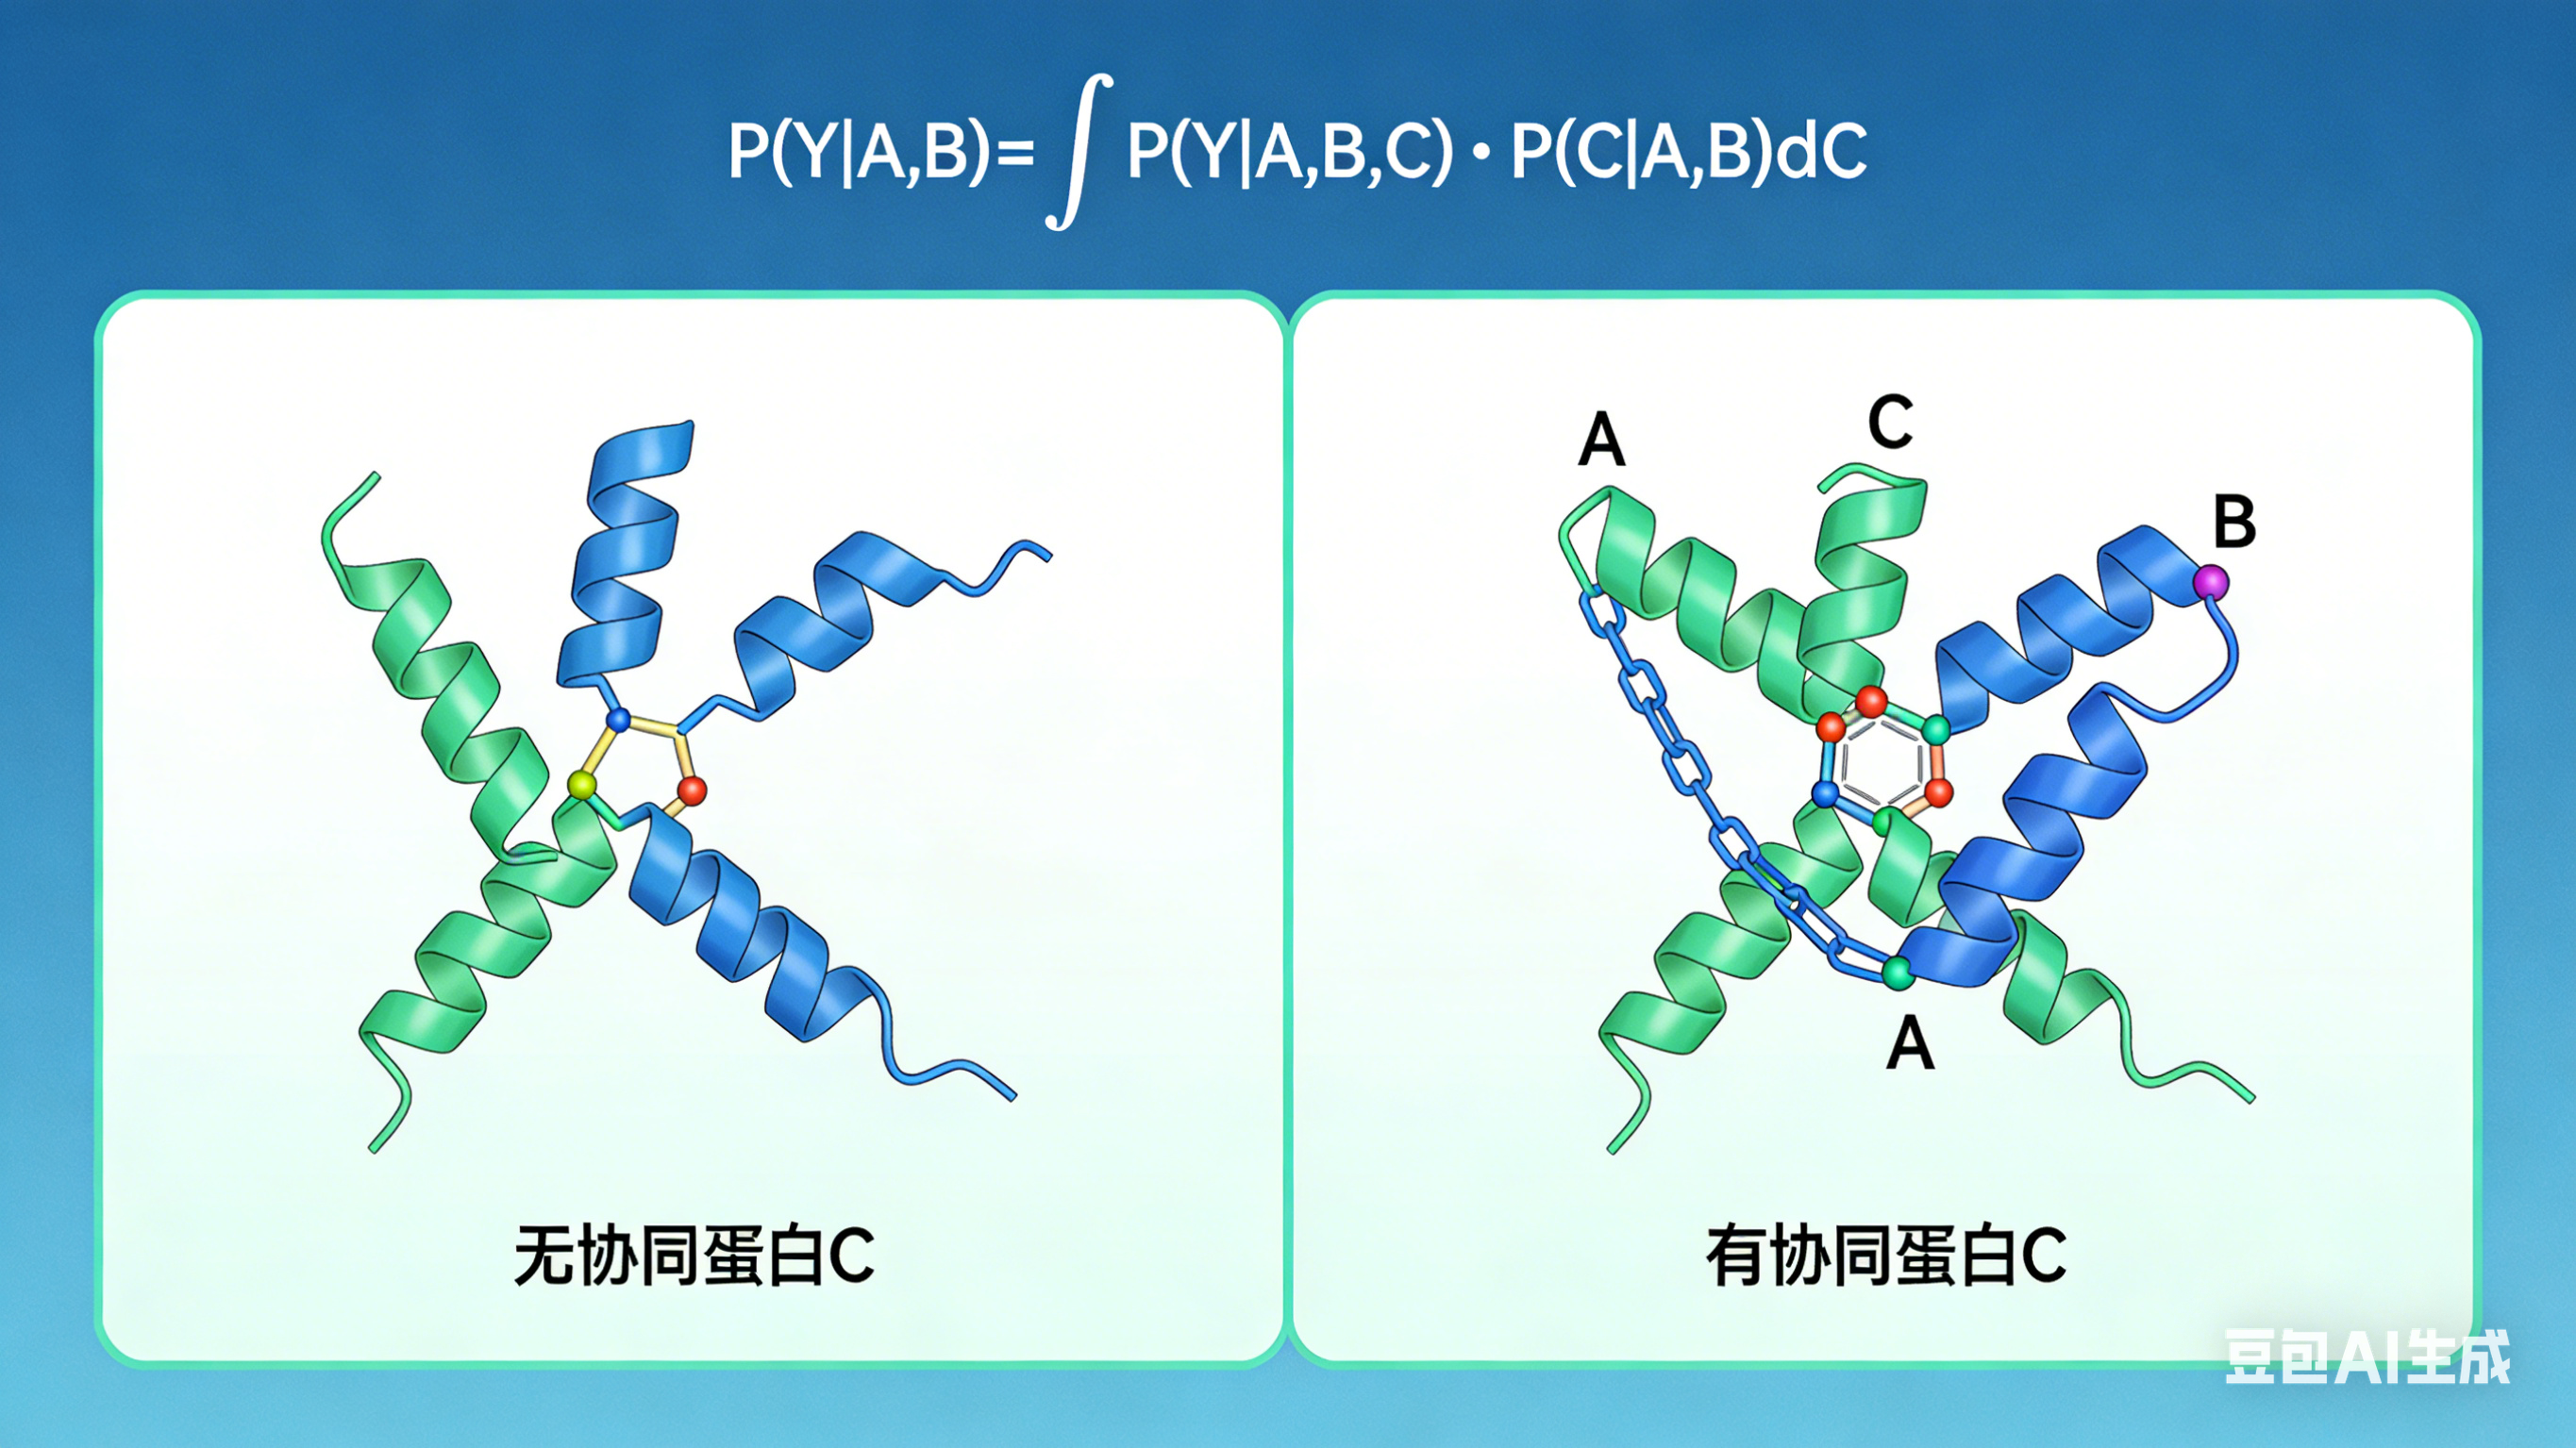
前面几个都是示意图,后来我干脆让豆包直接生成只含有数学积分公式的图了:
More
本工具列表、实际评测会一直更新