这是2023年12月写的,不知为何没有发出。这里做一个补发
以曲江新区为例
1.目前只有百度地图可以查看经济开发区(但开发文档未提供对应api),其他地图只能查看行政区。
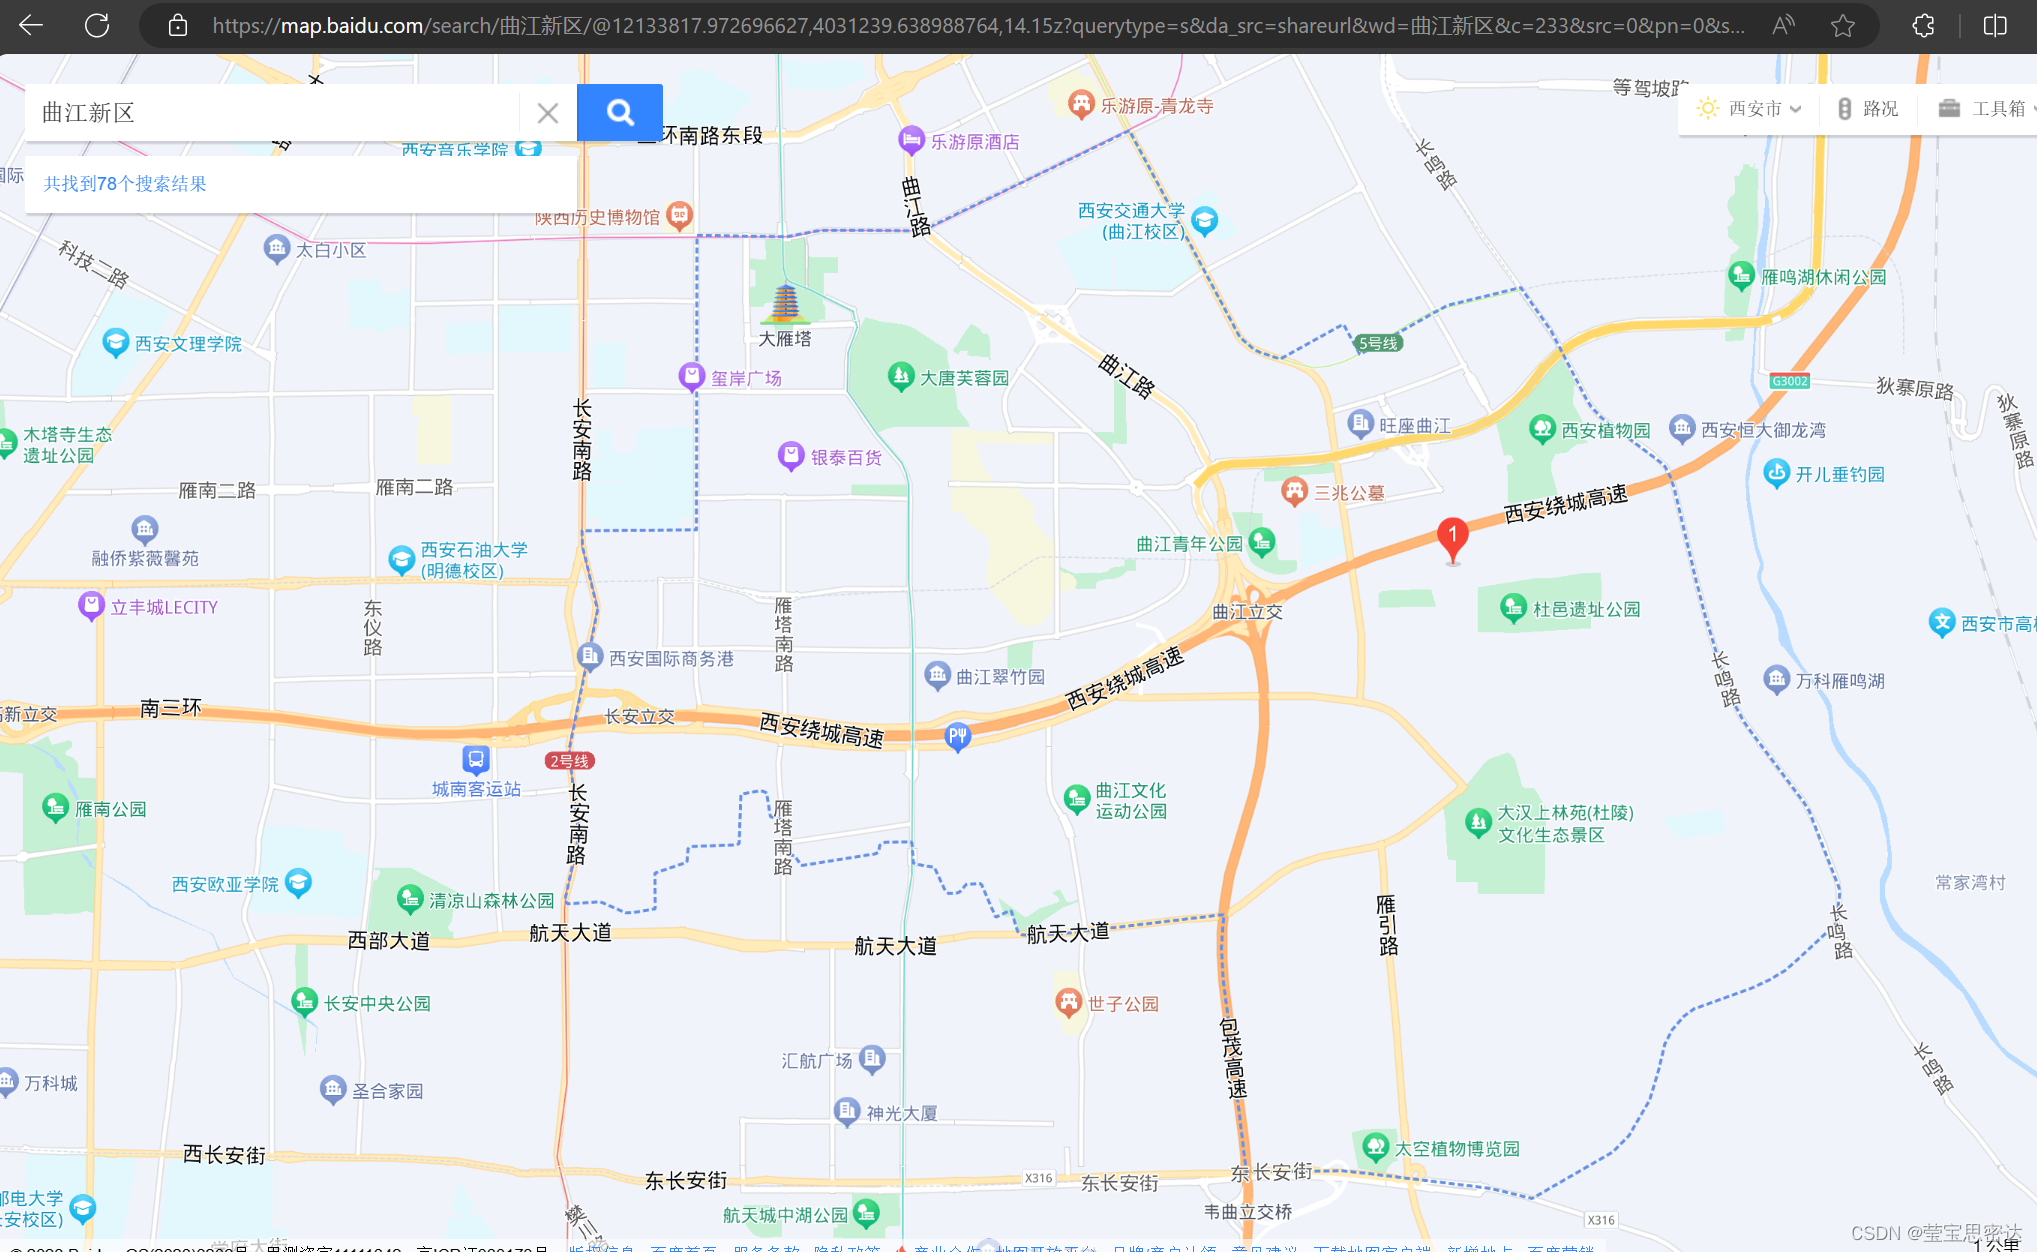
2.使用多边形编辑器吸附功能在地图上描绘出曲江边界线
多边形编辑器吸附功能-矢量覆盖物编辑-示例中心-JS API 2.0 示例 | 高德地图API (amap.com)
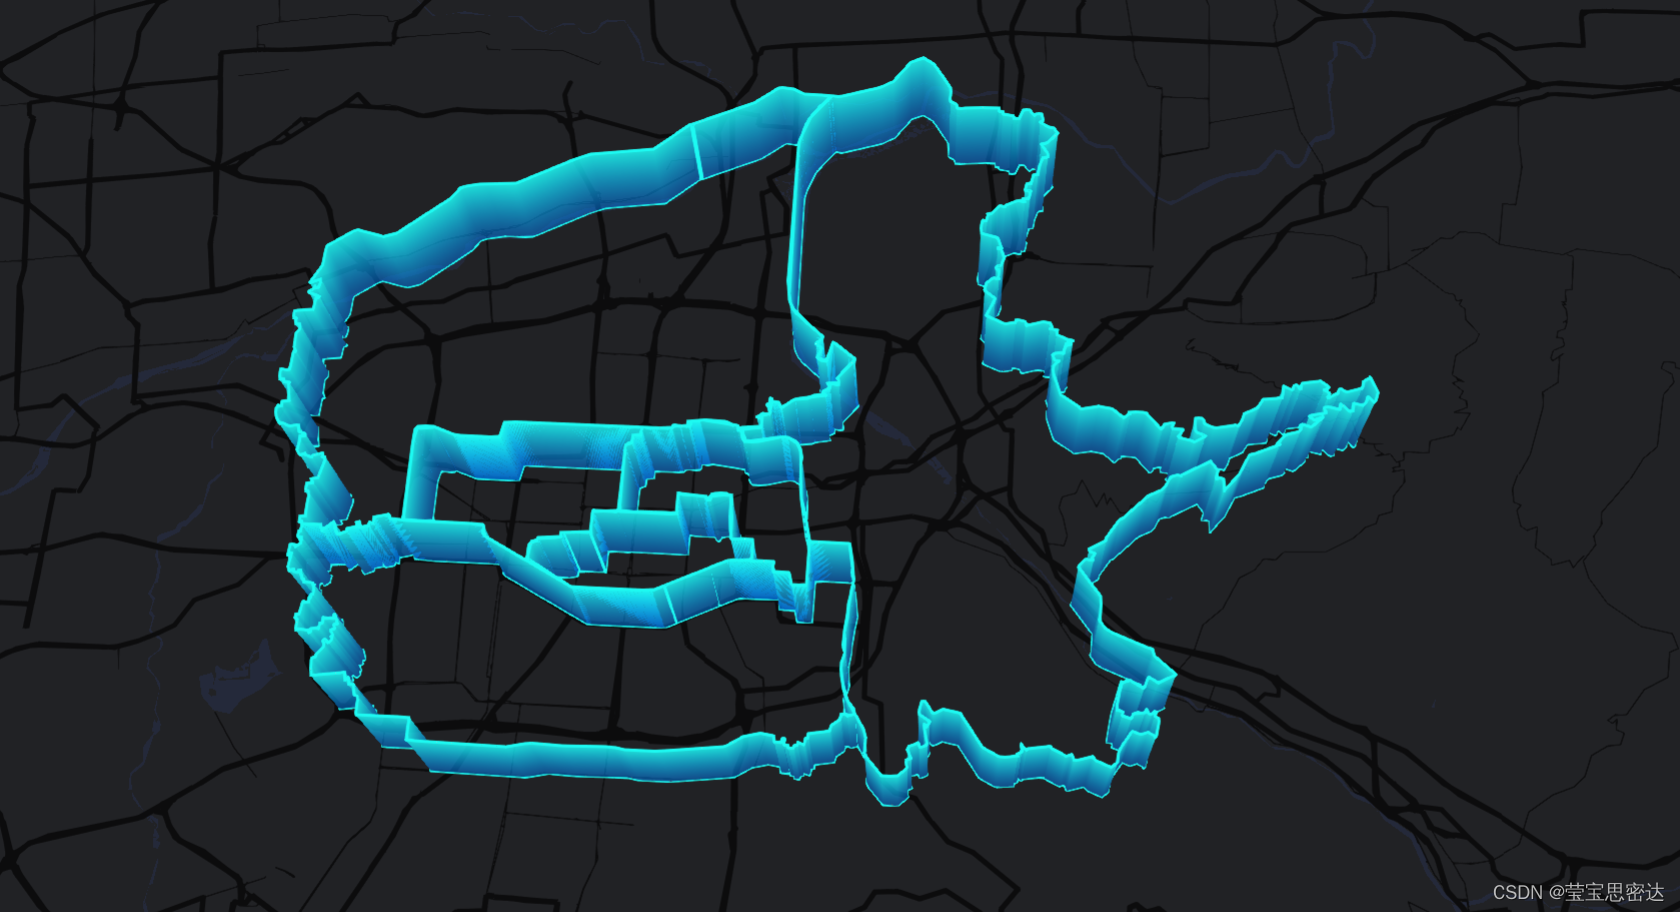
3.高德地图显示曲江经济开发区
4.高德地图围墙显示西安六大行政区demo
<!DOCTYPE html>
<html lang="en">

<head>
  <meta charset="UTF-8" />
  <meta name="viewport" content="width=device-width, initial-scale=1.0" />
  <meta http-equiv="X-UA-Compatible" content="ie=edge" />
  <title>动态围墙线</title>
</head>

  <script charset="utf-8"
  src="https://map.qq.com/api/gljs?v=1.exp&key=OB4BZ-D4W3U-B7VVO-4PJWW-6TKDJ-WPB77&libraries=visualization,service"></script>

  <!-- <script src="./qujaing.js" ></script> -->
  <script src="./myqujiang.js" ></script>

<style type="text/css">
  html,
  body {
    height: 100%;
    margin: 0px;
    padding: 0px;
  }

  #container {
    width: 100%;
    height: 100%;
  }
</style>

<body onload="initMap()">
  <div id="container"></div>
  <script>


 function initMap() {
  //初始化地图
  var map = new TMap.Map("container", {
    zoom: 11, //设置地图缩放级别
    center: new TMap.LatLng(34.214328, 108.944669), //设置地图中心点坐标   雁塔区
    // 以下展示为黑色
    pitch: 40, // 设置地图俯仰角
    mapStyleId: "style4", //个性化样式
    renderOptions: {
      enableBloom: true, // 泛光
    },
    baseMap: {
      type: "vector",
      features: ["base", "building3d"], // 隐藏矢量文字
    },
  });


  var district = new TMap.service.District({
    // 新建一个行政区划类
    polygon: 1, // 返回行政区划边界的类型
  });
  var Wall = new TMap.visualization.Wall({
    styles: {
      style1: {
        color: new TMap.GradientColor({
          stops: {
            0: "rgba(1,124,247,0.6)",
            1: "rgba(29,250,242,1)",
          },
          angle: 90, //渐变色中的断点集合
        }),
        strokeColor: 'rgba(29,250,242,1)', //边线颜色
        strokeWidth: 2, //边线宽度
      },
      style2: {
        color: new TMap.GradientColor({
          stops: {
            0: "rgba(255,165,0,0.5)",
            1: "rgba(255,165,0,1)",
          },
          angle: 90, //渐变色中的断点集合
        }),
        strokeColor: 'rgba(255,165,0,1)', //边线颜色
        strokeWidth: 2, //边线宽度
      },
      style3: {
        color: new TMap.GradientColor({
          stops: {
            0: "rgba(255,0,153,0.5)",
            1: "rgba(255,0,153,1)",
          },
          angle: 90, //渐变色中的断点集合
        }),
        strokeColor: 'rgba(255,0,153,1)', //边线颜色
        strokeWidth: 2, //边线宽度
      },
      style4: {
        color: new TMap.GradientColor({
          stops: {
            0: "rgba(0,231,255,0.5)",
            1: "rgba(0,231,255,1)",
          },
          angle: 90, //渐变色中的断点集合
        }),
        strokeColor: 'rgba(0,231,255,1)', //边线颜色
        strokeWidth: 2, //边线宽度
      },
      style5: {
        color: new TMap.GradientColor({
          stops: {
            0: "rgba(0,93,209,0.5)",
            1: "rgba(0,93,209,1)",
          },
          angle: 90, //渐变色中的断点集合
        }),
        strokeColor: 'rgba(0,93,209,1)', //边线颜色
        strokeWidth: 2, //边线宽度
      },
      style6: {
        color: new TMap.GradientColor({
          stops: {
            0: "rgba(3,89,41,0.5)",
            1: "rgba(3,89,41,1)",
          },
          angle: 90, //渐变色中的断点集合
        }),
        strokeColor: 'rgba(3,89,41,1)', //边线颜色
        strokeWidth: 2, //边线宽度
      },
      style7: {
        color: new TMap.GradientColor({
          stops: {
            0: "rgba(255,111,131,0.5)",
            1: "rgba(255,111,131,1)",
          },
          angle: 90, //渐变色中的断点集合
        }),
        strokeColor: 'rgba(255,111,131,1)', //边线颜色
        strokeWidth: 2, //边线宽度
      },


    },
    processAnimation: {
      animationType: "breath", //动画类型名称
      breathAmplitude: 0.5, //呼吸幅度
      yoyo: true, //是否回弹
      duration: 1000, //动画时长
    },

  })
    .addTo(map)

  function convertToPath(array) {
    return array.map((p) => {
      if (p.length == 2) return new TMap.LatLng(p[0], p[1]);
      if (p.length == 3) return new TMap.LatLng(p[0], p[1], p[2]);
    });
  }


// 曲江
  // var  qujiangwallLine = latlngarr
  // var path = convertToPath(qujiangwallLine);
  // var wallData2 = {
  //   path: path, //	经纬度数组
  //   height: 4500, //围墙面高度
  //   styleId: "style1", //围墙面样式配置id
  // };


var wallLineArr = []


function getWall(keyword,index){
  // let newIndex = index+3
  if(!keyword){
    console.log('==============');
    return
  }
  district
    .search({ keyword })
    .then((result) => {
      console.log('result',result);
      var polygon = result?.result?.[0]?.[0]?.polygon
      var latlngcur = polygon[polygon.length-1]
      var wallLine = latlngcur.map(item => {
        return [item.lat, item.lng]
      })
      var path = convertToPath(wallLine);
      var wallData = {
        path: path, //	经纬度数组
        height: 4500, //围墙面高度
        styleId: "style"+index, //围墙面样式配置id
        keyword: keyword,
      };
      wallLineArr.push(wallData)
  })

}


// // 西安 610100
var keywordArrArr = [['610102','610103','610104','610111','610112',],['610113']]

  // var keywordArrArr = [['610118','610122','610124'],['610102','610103','610104','610111','610112'],['610113','610114','610115','610116','610117'],]

  // 西安市行政区
  keywordArrArr.map((keywordArr,index)=>{

    setTimeout(()=>{
      keywordArr.map((item,index2)=>{
        // let newIndex = index*5+index2+2
        // console.log('newIndex',newIndex);
        // let newIndex = index2+3
        let newIndex = 1
        console.log('newIndex',newIndex);
        getWall(item,newIndex)
      })
      },(index+1)*1000)
  })

  setTimeout(()=>{
    console.log('wallLineArr',wallLineArr);
    Wall.setData(wallLineArr);

  },3500)


}
  </script>
</body>

</html>