OxyPlot 在 WPF 中的使用
一、OxyPlot 简介
OxyPlot 是一个跨平台的 .NET 开源绘图库,采用 MIT 许可证,支持在 WPF、WinForms、UWP、Xamarin 等多平台上高效绘制图表,以其灵活性和可扩展性而著称。在 WPF 应用中,OxyPlot.Wpf 通过封装专门针对 WPF 的控件,实现了轻量级、高性能的数据可视化。
二、OxyPlot 的核心概念
在使用 OxyPlot 之前,先了解以下几个核心概念,有助于理解后续的使用方法:
| 概念 | 说明 |
|---|---|
| PlotModel | 图表的数据模型,是所有图表元素(边框、数据线条、坐标轴、图例等)的容器,需绑定到界面控件上 |
| PlotView / Plot | WPF 中承载图表的两种控件:PlotView 搭配代码定义模型,简单灵活;Plot 适合在 XAML 中直接配置图表内容 |
| Axes | 坐标轴集合,可分别添加四个方向的坐标轴(底/顶/左/右),默认提供底部横坐标和左侧纵坐标 |
| Series | 图表数据系列,包括 LineSeries(折线图)、BarSeries(柱状图)、PieSeries(饼图)、ScatterSeries(散点图)等多种类型 |
| Tracker | 浮动的信息提示框,类似 ToolTip,鼠标移动到数据点上时显示详细信息 |
OxyPlot 支持折线图、柱状图、饼图、散点图、热力图等丰富的图表类型,可满足不同场景的可视化需求。
三、快速入门
步骤1:创建 WPF 项目
在 Visual Studio 中创建一个新的 WPF 应用程序项目,目标框架建议选择 .NET Framework 4.5 或更高版本,或 .NET 6/8 等长期支持版本。
步骤2:通过 NuGet 安装 OxyPlot.Wpf
方法一:使用包管理器控制台
powershell
PM> Install-Package OxyPlot.Wpf或安装特定版本:
powershell
PM> Install-Package OxyPlot.Wpf -Version 2.1.2方法二:通过 GUI 管理 NuGet 包
- 在解决方案资源管理器中右键点击"引用" → "管理 NuGet 包"
- 搜索"OxyPlot",选择"OxyPlot.Wpf"并安装
步骤3:添加命名空间引用
在 XAML 文件的 Window 或 UserControl 元素中添加 OxyPlot 的命名空间引用:
二选一
xml
xmlns:oxy="http://oxyplot.org/wpf"四、使用方式
使用 PlotView + Code-Behind(推荐)
这种方式在 ViewModel 或 Code-Behind 中创建 PlotModel 对象,通过数据绑定将其与 XAML 中的 PlotView 关联,结构清晰,适合 MVVM 模式。
步骤1:创建 ViewModel
在 ViewModel 中定义 PlotModel 属性:
csharp
using OxyPlot;
using OxyPlot.Series;
public class MainViewModel
{
public MainViewModel()
{
// 创建 PlotModel,设置标题
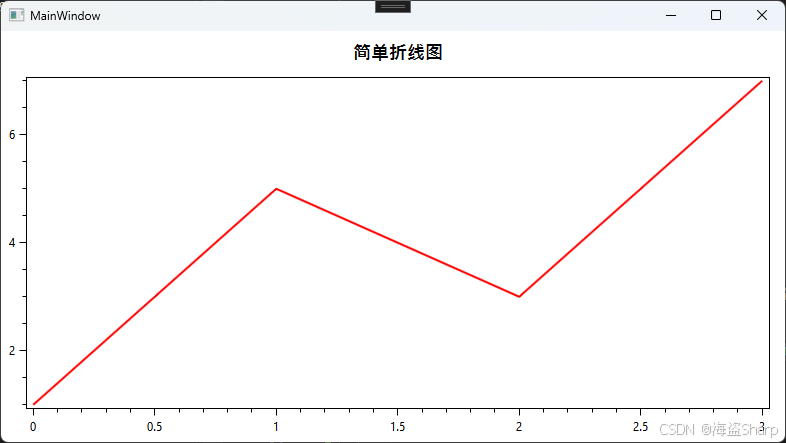
var plotModel = new PlotModel { Title = "简单折线图" };
// 创建折线数据系列并添加数据点
var series = new LineSeries
{
Color = OxyColors.Red,
Title = "数据曲线"
};
series.Points.Add(new DataPoint(0, 1));
series.Points.Add(new DataPoint(1, 5));
series.Points.Add(new DataPoint(2, 3));
series.Points.Add(new DataPoint(3, 7));
plotModel.Series.Add(series);
this.PlotModel = plotModel;
}
public PlotModel PlotModel { get; }
}步骤2:配置 XAML 界面
在 MainWindow.xaml 中设置 DataContext 并添加 PlotView 控件:
xml
<Window x:Class="WpfApp.MainWindow"
        xmlns="http://schemas.microsoft.com/winfx/2006/xaml/presentation"
        xmlns:x="http://schemas.microsoft.com/winfx/2006/xaml"
        xmlns:oxy="http://oxyplot.org/wpf"
        xmlns:local="clr-namespace:WpfApp"
        Title="OxyPlot 示例" Height="400" Width="600">

    <Window.DataContext>
        <local:MainViewModel/>
    </Window.DataContext>

    <Grid>
        <oxy:PlotView Model="{Binding PlotModel}" />
    </Grid>
</Window>
效果: