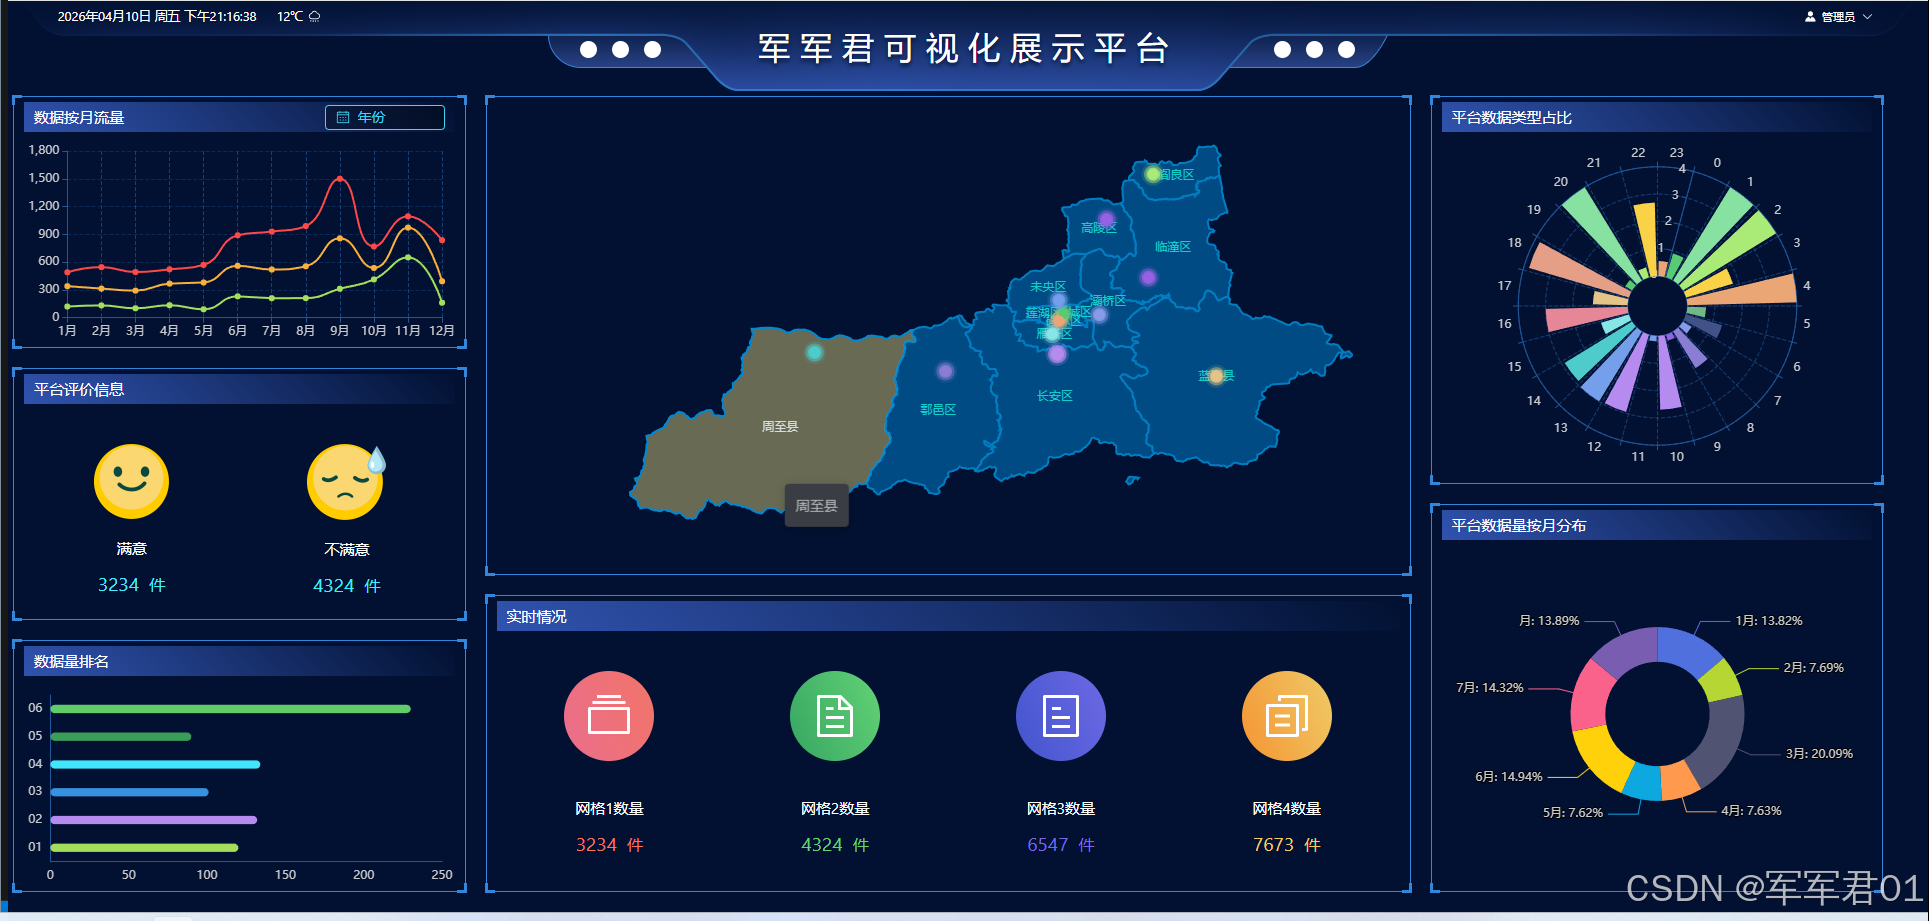
前端数字孪生大屏,使用vue3+Elementplus+Echarts+TS实现数据可视化大屏,数字孪生,监控大屏展示,可下载作为课堂作业、界面模板、扩展开发,个人作品等。
一.效果展示:

二.源码下载:
三.开发视频:
https://www.bilibili.com/video/BV1w6QcBiEaJ/
四.实现明细:
4.1 开发环境
使用vscode开发,nodejs版本为v24.11.0,其它项目依赖如下:
1. "dayjs": "^1.11.20"
2. "echarts": "^6.0.0"
3. "element-plus": "^2.13.6"
4. "less": "^4.6.4"
5. "pinia": "^3.0.4"
6. "vue": "^3.5.31"
7. "vue-router": "^5.0.4"
4.2 实现明细
- main.ts
javascript
import { createApp } from 'vue'
import { createPinia } from 'pinia'

import App from './App.vue'
import router from './router'
import ElementPlus from 'element-plus'
import 'element-plus/dist/index.css'
// 如果您正在使用CDN引入,请删除下面一行。
import * as ElementPlusIconsVue from '@element-plus/icons-vue'

const app = createApp(App)

app.use(createPinia())
app.use(router)

app.use(ElementPlus)
for (const [key, component] of Object.entries(ElementPlusIconsVue)) {
  app.component(key, component)
}

app.mount('#app')- App.vue
javascript
<script setup lang="ts"></script>

<template>
  <RouterView></RouterView>
</template>

<style >
@import url("@/assets/main.css");
</style>- HomeView.vue
javascript
<script setup lang="ts">
import ChartItem from '@/components/ChartItem.vue';
import Header from '@/components/Header.vue';
import { onMounted, reactive, ref } from 'vue';
import MonthChartItem from "@/components/MonthChartItem.vue"
import ScopeChartItem from "@/components/ScopeChartItem.vue"
import DataBarChartItem from "@/components/DataBarChartItem.vue"
import MonthDataChartItem from "@/components/MonthDataChartItem.vue"
import DataTypeChartItem from '@/components/DataTypeChartItem.vue';
import RealTimeChartItem from '@/components/RealTimeChartItem.vue';
import MapChartItem from '@/components/MapChartItem.vue';

//当前年份
const currentYear = ref(new Date());
</script>

<template>
  <div class="page">
    <Header />
    <el-row :gutter="10" class="content">
      <el-col :span="6">
        <ChartItem title="数据按月流量" class="chart-item">
          <template #title-btn>
            <el-date-picker
              v-model="currentYear"
              type="year"
              format="YYYY"
              value-format="YYYY"
              placeholder="年份"
              class="month-date-select"
            />
          </template>
          <template #default>
            <MonthChartItem></MonthChartItem>
          </template>
        </ChartItem>
        <ChartItem title="平台评价信息" class="chart-item">
          <template #default>
           <ScopeChartItem></ScopeChartItem>
          </template>
        </ChartItem>
        <ChartItem title="数据量排名" class="chart-item">
          <template #default>
           <DataBarChartItem></DataBarChartItem>
          </template>
        </ChartItem>
      </el-col>
      <el-col :span="12">
        <ChartItem title="" class="chart-item-3">
          <template #default>
            <MapChartItem></MapChartItem>
          </template>
        </ChartItem>
        <ChartItem title="实时情况" class="chart-item-4">
          <template #default>
            <RealTimeChartItem></RealTimeChartItem>
          </template>
        </ChartItem>
      </el-col>
      <el-col :span="6">
        <ChartItem title="平台数据类型占比" class="chart-item-2">
          <template #default>
            <DataTypeChartItem></DataTypeChartItem>
          </template>
        </ChartItem>
        <ChartItem title="平台数据量按月分布" class="chart-item-2">
          <template #default>
            <MonthDataChartItem></MonthDataChartItem>
          </template>
        </ChartItem>
      </el-col>
    </el-row>
  </div>
</template>
<style lang="less" scoped>
  .page{
    width:100vw;
    height: 100vh;
    background: url("@/assets/images/bg.png") 100% 100% no-repeat;

    .content{
      width:calc(100vw - 30px);

      .chart-item{
        height: calc((100vh - 100px - 55px) / 3);
        margin-bottom: 20px;
        :first-child{
          margin-bottom: 0;
        }
      }
      .chart-item-2{
        height: calc((100vh - 100px - 35px) / 2);
        margin-bottom: 20px;
        :first-child{
          margin-bottom: 0;
        }
      }
      .chart-item-3{
        height: calc(((100vh - 100px - 35px) / 2) + 10vh);
        margin-bottom: 20px;
        :first-child{
          margin-bottom: 0;
        }
      }
      .chart-item-4{
        height:  calc(((100vh - 100px - 35px) / 2) - 10vh);
        :first-child{
          margin-bottom: 0;
        }
      }
      :deep(.month-date-select){
        --el-date-editor-width:120px;
        --el-input-bg-color:#00000055;
        --el-input-icon-color:#40d4f5;
        --el-input-text-color:#40d4f5;
        --el-input-border-color:#40d4f5;
        --el-input-hover-border-color:#40d4f5;
        --el-input-focus-border-color:#40d4f5;
        --el-input-focus-border:#40d4f5;
        --el-input-hover-border:#40d4f5;
        --el-input-border:#40d4f5;
        --el-input-height:25px;
        --el-input-placeholder-color:#40d4f5;
        position: relative;
        top: -2px;
      }
    }

  }
</style>- router/index.ts
javascript
import { createRouter, createWebHistory } from 'vue-router'

import HomeView from '@/views/HomeView.vue'

const router = createRouter({
  history: createWebHistory(import.meta.env.BASE_URL),
  routes: [{
    name:'主页',
    path:'',
    component:HomeView
  }],
})

export default router- ChartItem.vue
javascript
<template>
    <div class="chart-item">
        <div class="left-top-1"></div>
        <div class="left-top-2"></div>

        <div class="left-bottom-1"></div>
        <div class="left-bottom-2"></div>

        <div class="right-top-1"></div>
        <div class="right-top-2"></div>

        <div class="right-bottom-1"></div>
        <div class="right-bottom-2"></div>

        <div class="title" v-if="title">
            <div class="text">{{ title }}</div>
            <div class="right-btns">
                <slot name="title-btn"></slot>
            </div>
        </div>
        <div class="chart-content">
            <slot ></slot>
        </div>
    </div>
</template>
<script setup lang="ts">
    const porps = defineProps({
        title:String
    });
</script>
<style lang="less" scoped>
.chart-item{
    min-height: 100px;
    border: 1px solid #3486da ;
    margin: 5px;
    position: relative;
    padding: 5px 10px;

    .left-top-1{
        position: absolute;
        left:-2px;
        top:-2px;
        width:10px;
        height: 3px;
        background:#3486da;
    }

    .left-top-2{
        position: absolute;
        left:-2px;
        top:-2px;
        width:3px;
        height: 10px;
        background:#3486da;
    }


    .left-bottom-1{
        position: absolute;
        left:-2px;
        bottom:-2px;
        width:10px;
        height: 3px;
        background:#3486da;
    }

    .left-bottom-2{
        position: absolute;
        left:-2px;
        bottom:-2px;
        width:3px;
        height: 10px;
        background:#3486da;
    }


    .right-top-1{
        position: absolute;
        right:-2px;
        top:-2px;
        width:10px;
        height: 3px;
        background:#3486da;
    }

    .right-top-2{
        position: absolute;
        right:-2px;
        top:-2px;
        width:3px;
        height: 10px;
        background:#3486da;
    }


    .right-bottom-1{
        position: absolute;
        right:-2px;
        bottom:-2px;
        width:10px;
        height: 3px;
        background:#3486da;
    }

    .right-bottom-2{
        position: absolute;
        right:-2px;
        bottom:-2px;
        width:3px;
        height: 10px;
        background:#3486da;
    }

    .title{
        line-height: 30px;
        color: #fff;
        background: linear-gradient(45deg,#3053af,#02113200);
        padding: 0 10px;
        display: flex;

        .text{
            flex:1
        }
    }

    .chart-content{
        height: calc(100% - 30px - 10px);
    }
}
</style>- DataBarChartItem.vue
javascript
<template>
    <div ref="dataBarChartRef" class="chart-item-panel"></div>
</template>
<script setup lang="ts">
import * as echarts from 'echarts';
import { ref, reactive, onMounted } from 'vue';

const dataBarChartRef = ref();
const dataBarChartOptions = reactive({
  backgroundColor:'transparent',
  tooltip: {
    trigger: 'axis'
  },
  grid: {
    left: '1%',
    right: '3%',
    bottom: '3%',
    top:'9%',
    containLabel: true
  },
  yAxis: {
    type: 'category',
    data: ['01', '02', '03', '04', '05', '06'],
    axisLine:{
      show:true,
      lineStyle:{
        color:'#205797'
      }
    },
    axisTick:{
      show:false
    },
    splitLine:{
      show:false
    }
  },
  xAxis: {
    type: 'value',
    boundaryGap: false,
    axisLine:{
        show:true,
      lineStyle:{
        color:'#205797'
      }
    },
    axisTick:{
      show:false
    },
    splitLine:{
      show:false
    }
  },
  series: [
    {
      name: '传感器数据',
      type: 'bar',
      data: [{
        value:120,
        itemStyle:{
            color:'#a4df5c',
        }
      }, {
        value:132,
        itemStyle:{
            color:'#b58bef',
        }
      }, {
        value:101,
        itemStyle:{
            color:'#3691de',
        }
      }, {
        value:134,
        itemStyle:{
            color:'#42e5fb',
        }
      }, {
        value:90,
        itemStyle:{
            color:'#3a9e58',
        }
      }, {
        value:230,
        itemStyle:{
            color:'#61cc6a',
        }
      }],
      barWidth:'30%',
      itemStyle:{

        borderRadius:10,
      }
    }
  ]
})
const dataBarChart = ref();

onMounted(()=>{
dataBarChart.value = echarts.init(dataBarChartRef.value, 'dark');
dataBarChart.value.setOption(dataBarChartOptions);

})
</script>
<style lang="less" scoped>
    .chart-item-panel{
        height: calc(((100vh - 100px - 55px) / 3) - 40px);
    }
</style>- DataTypeChartItem.vue
javascript
<template>
    <div ref="dataTypeChartRef" class="chart-item-panel"></div>
</template>
<script setup lang="ts">
import * as echarts from 'echarts';
import { ref, reactive, onMounted } from 'vue';

const dataTypeChartRef = ref();
const dataTypeChartOptions = reactive({
    backgroundColor: 'transparent',
    tooltip: {
        trigger: 'axis'
    },
    grid: {
        left: '0%',
        right: '0%',
        bottom: '0%',
        top: '0%',
        containLabel: true
    },
    polar: {
        radius: [30, '80%']
    },
    radiusAxis: {
        max: 4,
        axisLine: {
            lineStyle: {
                color: '#205797'
            }
        },
        axisTick: {
            show: true,
            lineStyle: {
                color: '#205797'
            }
        },
        splitLine: {
            show: true,
            lineStyle: {
                color: '#205797aa',
                type: 'dashed'
            }
        }
    },
    angleAxis: {
        type: 'category',
        data: new Array<String>(),
        startAngle: 75,
        axisLine: {
            lineStyle: {
                color: '#205797'
            }
        },
        axisTick: {
            show: true,
            lineStyle: {
                color: '#205797'
            }
        },
        splitLine: {
            show: true,
            lineStyle: {
                color: '#205797aa',
                type: 'dashed'
            }
        }
    },
    series: {
        type: 'bar',
        data: new Array<Object>(),
        coordinateSystem: 'polar',
        label: {
            show: false,
        }
    },
})
const dataTypeChart = ref();

const colors = ['#58ca73','#87e1a1','#aaeb77','#f9d247','#eaa675','#73b987','#425288','#879bea','#897dd4','#9761e5','#b48bef','#759feb','#b58bef','#759feb','#4ecccb','#87e5e5','#e58796','#e5c587','#e59f87'];

onMounted(() => {
    for (let i = 0; i < 24; i++) {
        dataTypeChartOptions.angleAxis.data.push(i + '');
        dataTypeChartOptions.series.data.push({
            name:i+'',
            value:Number.parseFloat((Math.random() * 5).toFixed(2)),
            itemStyle:{
                color:colors[i%colors.length]
            }
        });
    }
    dataTypeChart.value = echarts.init(dataTypeChartRef.value, 'dark');
    dataTypeChart.value.setOption(dataTypeChartOptions);
})
</script>
<style lang="less" scoped>
.chart-item-panel {
    height: calc(((100vh - 100px - 35px) / 2) - 40px);
}
</style>- Header.vue
javascript
<template>
    <div class="header">
        <div class="left">
            <div class="date-time">{{currentDate}} {{ week }} {{ currentTime }}</div>
            <div class="weather">{{ weather }}<el-icon><Pouring /></el-icon></div>
        </div>
        <div class="title">
            军军君可视化展示平台
        </div>
        <div class="right">
            <div class="empth"></div>
            <div class="user-info">
                <el-dropdown>
                    <span class="el-dropdown-link">
                        <el-icon><Avatar /></el-icon>
                        <el-text>{{userInfo.name}}</el-text>
                        <el-icon class="el-icon--right">
                            <arrow-down />
                        </el-icon>
                    </span>
                    <template #dropdown>
                    <el-dropdown-menu>
                        <el-dropdown-item>个人信息</el-dropdown-item>
                        <el-dropdown-item>修改密码</el-dropdown-item>
                        <el-dropdown-item divided>退出登录</el-dropdown-item>
                    </el-dropdown-menu>
                    </template>
                </el-dropdown>
            </div>
        </div>
    </div>
</template>
<script setup lang="ts">
import { onUnmounted, reactive, ref } from 'vue';
import dayjs from 'dayjs';

//当前日期
const currentDate = ref(dayjs(new Date()).format('YYYY年MM月DD日'));

//当前的星期
const weeks = reactive(['周一','周二','周三','周四','周五','周六','周天']);
const week = ref(weeks[new Date().getDay() - 1])
if(new Date().getDay() === 0){
    week.value = weeks[6];
}

//当前时间
const currentTime = ref(dayjs(new Date()).format('A')==='AM'?'早上':'下午'+dayjs(new Date()).format('HH:mm:ss'));

//定时器
const timer = setInterval(()=>{
    currentTime.value = dayjs(new Date()).format('A')==='AM'?'早上':'下午'+dayjs(new Date()).format('HH:mm:ss');
})

//天气
const weather =ref("12℃");

const userInfo = reactive({
    name:'管理员'
})

onUnmounted(()=>{
    clearInterval(timer)
})

</script>
<style lang="less" scoped>
    .header{
        height: 90px;
        display: flex;
        background: url("@/assets/images/icon-003.png") 100% 100% no-repeat;

        .left{
            flex: 1;
            display: flex;

            .date-time{
                margin-left: 7%;
                line-height: 30px;
                color: #fff;
                font-size: 0.8rem;
            }
            .weather{
                flex: 1;
                line-height: 30px;
                color: #fff;
                margin-left: 20px;
                font-size: 0.8rem;

                :deep(.el-icon){
                    position: relative;
                    top: 2px;
                    margin-left: 5px;
                }
            }
        }
        .title{
            width:500px;
            font-size: 2rem;
            color: #fff;
            letter-spacing: 10px;
            text-align: center;
            line-height: 90px;
            text-shadow: 0px 3px 4px #021132;
        }
        .right{
            flex:1;
            display: flex;

            .empth{
                flex: 1;
            }
            .user-info{
                margin-right: 7%;
                font-size: 0.8rem;

                :deep(.el-dropdown){
                    --el-text-color-regular:#fff;
                    line-height: 30px;
                    cursor: pointer;
                    font-size: 0.8rem;

                    .el-icon{
                        position: relative;
                        top: 2px;
                        margin:0 5px;
                    }
                    .el-text{
                        font-size: 0.7rem;
                    }
                    .el-dropdown-link:focus-visible{
                        outline: none !important;
                    }
                }
            }
        }
    }
</style>- MapChartItem.vue
javascript
<template>
    <div ref="mapChartRef" class="chart-item-panel"></div>
</template>
<script setup lang="ts">
import * as echarts from 'echarts';
import { ref, reactive, onMounted } from 'vue';

const mapChartRef = ref();
const mapChartOptions = reactive({
    backgroundColor: 'transparent',
    tooltip: {
        trigger: 'axis'
    },
    grid: {
        left: '0%',
        right: '0%',
        bottom: '0%',
        top: '0%',
        containLabel: true
    },
    geo:{
        map: 'xa',
        zoom:1,
        roam :true,
        aspectScale: Math.cos((20 * Math.PI) / 180),
        label: {
            show: true,
            color: '#11d0c9'
        },
        itemStyle:{
            areaColor:"#014b84",
            borderColor:'#007ec1',
            borderWidth:2
        }

    },
    series: {
        type: 'effectScatter',
        symbolSize: 10,
        coordinateSystem: 'geo',
        data: [
            {
                value:[108.959903,34.26927],
                itemStyle:{
                    color:'#58ca73'
                }
            },
            {
                value:[108.946994,
                    34.251061],
                itemStyle:{
                    color:'#eaa675'
                }
            },
            {
                value:[109.067261,
                    34.267453],
                itemStyle:{
                    color:'#879bea'
                }
            },
            {
                value:[108.946022,
                    34.30823],
                itemStyle:{
                    color:'#759feb'
                }
            },
            {
                value:[108.926593,
                    34.213389],
                itemStyle:{
                    color:'#87e5e5'
                }
            },
            {
                value:[109.22802,
                    34.662141],
                itemStyle:{
                    color:'#aaeb77'
                }
            },
            {
                value:[109.213986,
                    34.372065],
                itemStyle:{
                    color:'#9761e5'
                }
            },
            {
                value:[108.941579,
                    34.157097],
                itemStyle:{
                    color:'#b58bef'
                }
            },
            {
                value:[108.607385,
                    34.108668],
                itemStyle:{
                    color:'#897dd4'
                }
            },
            {
                value:[109.416922,
                    34.094783],
                itemStyle:{
                    color:'#e5c587'
                }
            },
            {
                value:[108.216465,
                    34.161532],
                itemStyle:{
                    color:'#4ecccb'
                }
            },
            {
                value:[108.941579,
                    34.157097],
                itemStyle:{
                    color:'#b58bef'
                }
            },
            {
                value:[109.088896,
                    34.535065],
                itemStyle:{
                    color:'#9761e5'
                }
            },
        ]
    }
})
const mapChart = ref();

onMounted(() => {
    fetch(new URL('@/assets/geojson/xa.json', import.meta.url).href).then((response)=>{
        if(response.status == 200){
            response.json().then((data)=>{
                echarts.registerMap('xa', {geoJSON: data});

                mapChart.value = echarts.init(mapChartRef.value, 'dark');
                mapChart.value.setOption(mapChartOptions);
            })
        }
    })
})
</script>
<style lang="less" scoped>
.chart-item-panel {
    height: calc(((100vh - 100px - 35px) / 2) + 10vh);
}
</style>- MonthChartItem.vue
javascript
<template>
    <div ref="monthChartRef" class="chart-item-panel"></div>
</template>
<script setup lang="ts">
import * as echarts from 'echarts';
import { ref, reactive, onMounted } from 'vue';

const monthChartRef = ref();
const monthChartOptions = reactive({
  backgroundColor:'transparent',
  tooltip: {
    trigger: 'axis'
  },
  grid: {
    left: '1%',
    right: '3%',
    bottom: '3%',
    top:'9%',
    containLabel: true
  },
  xAxis: {
    type: 'category',
    boundaryGap: false,
    data: ['1月', '2月', '3月', '4月', '5月', '6月', '7月', '8月', '9月', '10月', '11月', '12月'],
    axisLine:{
      lineStyle:{
        color:'#205797'
      }
    },
    axisTick:{
      show:true,
      lineStyle:{
        color:'#205797'
      }
    },
    splitLine:{
      show:true,
      lineStyle:{
        color:'#205797aa',
        type:'dashed'
      }
    }
  },
  yAxis: {
    type: 'value',
    axisLine:{
      show:true,
      lineStyle:{
        color:'#205797'
      }
    },
    axisTick:{
      show:true,
      lineStyle:{
        color:'#205797'
      }
    },
    splitLine:{
      show:true,
      lineStyle:{
        color:'#20579755',
        type:'dashed'
      }
    }
  },
  series: [
    {
      name: '传感器数据',
      type: 'line',
      stack: 'Total',
      smooth:true,
      data: [120, 132, 101, 134, 90, 230, 210,211,312,413,651,161],
      itemStyle:{
        color:'#a4df5c'
      }
    },
    {
      name: '订单数据',
      type: 'line',
      stack: 'Total',
      smooth:true,
      data: [220, 182, 191, 234, 290, 330, 310,344,545,124,322,232],
      itemStyle:{
        color:'#fbb03b'
      }
    },
    {
      name: '告警数据',
      type: 'line',
      stack: 'Total',
      smooth:true,
      data: [150, 232, 201, 154, 190, 330, 410,435,644,232,122,444],
      itemStyle:{
        color:'#ff4848'
      }
    }
  ]
})
const monthChart = ref();

onMounted(()=>{
monthChart.value = echarts.init(monthChartRef.value, 'dark');
monthChart.value.setOption(monthChartOptions);

})
</script>
<style lang="less" scoped>
    .chart-item-panel{
        height: calc(((100vh - 100px - 55px) / 3) - 40px);
    }
</style>- MonthDataChartItem.vue
javascript
<template>
    <div ref="monthDataChartRef" class="chart-item-panel"></div>
</template>
<script setup lang="ts">
import * as echarts from 'echarts';
import { ref, reactive, onMounted } from 'vue';

const monthDataChartRef = ref();
const monthDataChartOptions = reactive({
  backgroundColor:'transparent',
  tooltip: {
    trigger: 'axis'
  },
  grid: {
    left: '0%',
    right: '0%',
    bottom: '0%',
    top:'0%',
    containLabel: true
  },
  series: [
    {
      name: '数据按月分布',
      type: 'pie',
      center:['50%','50%'],
      radius:['30%','50%'],
      label:{
        formatter:'{b}: {d}%',
         width:80
      },
      data: [{
        name:'1月',
        value:223
      },{
        name:'2月',
        value:124
      },{
        name:'3月',
        value:324
      },{
        name:'4月',
        value:123
      },{
        name:'5月',
        value:123
      },{
        name:'6月',
        value:241
      },{
        name:'7月',
        value:231
      },{
        name:'月',
        value:224
      }],
    }
  ]
})
const monthDataChart = ref();

onMounted(()=>{
monthDataChart.value = echarts.init(monthDataChartRef.value, 'dark');
monthDataChart.value.setOption(monthDataChartOptions);

})
</script>
<style lang="less" scoped>
    .chart-item-panel{
        height: calc(((100vh - 100px - 35px) / 2) - 40px);
    }
</style>- RealTimeChartItem.vue
javascript
<template>
    <div class="chart-item-panel">
        <div class="left">
            <div class="icon">
                <div class="icon-content">
                    <el-icon><Files /></el-icon>
                </div>
            </div>
            <div class="text">网格1数量</div>
            <div class="value">{{ value1 }}<text class="unit">件</text></div>
        </div>
        <div class="right">
            <div class="icon">
                <div class="icon-content bg-color-2">
                    <el-icon><Document /></el-icon>
                </div>
            </div>
            <div class="text">网格2数量</div>
            <div class="value value2">{{ value2 }}<text class="unit">件</text></div>
        </div>
        <div class="right">
            <div class="icon">
                <div class="icon-content bg-color-3">
                    <el-icon><Tickets /></el-icon>
                </div>
            </div>
            <div class="text">网格3数量</div>
            <div class="value value3">{{ value3 }}<text class="unit">件</text></div>
        </div>
        <div class="right">
            <div class="icon">
                <div class="icon-content bg-color-4">
                    <el-icon><DocumentCopy /></el-icon>
                </div>
            </div>
            <div class="text">网格4数量</div>
            <div class="value value4">{{ value4 }}<text class="unit">件</text></div>
        </div>
    </div>
</template>
<script setup lang="ts">
    import { ref } from 'vue';
    const value1 = ref(3234);
    const value2 = ref(4324);
    const value3 = ref(6547);
    const value4 = ref(7673);
</script>
<style lang="less" scoped>
    .chart-item-panel{
        height: calc((((100vh - 100px - 35px) / 2) - 10vh) - 40px);
        display: flex;

        .left,.right{
            flex:1;
            text-align: center;
            color: #fff;
            line-height: 35px;

            .icon{
                margin-top: 40px;

                .icon-content{
                    height:90px;
                    width:90px;
                    margin: 0 auto;
                    background: linear-gradient(68deg,#ea6e8d,#f27468);
                    border-radius: 50%;
                    display: flex;
                    justify-items: center;
                    align-items: center;
                    text-align: center;
                    align-content: center;
                    justify-content: center;

                    .el-icon{
                        font-size: 3rem;
                    }
                }
                .bg-color-2{
                    background: linear-gradient(68deg,#36a662,#63d276);
                }
                .bg-color-3{
                    background: linear-gradient(68deg,#4155cd,#6e69e4);
                }
                .bg-color-4{
                    background: linear-gradient(68deg,#f59433,#efcb67);
                }
            }
            .text{
                margin-top:30px;
            }

            .value{
                font-size: 1.2rem;
                color:#f8745f;

                .unit{
                    font-size: 1rem;
                    margin-left: 10px;
                }
            }
            .value2{
                color: #68d574;
            }
            .value3{
                color: #786ae8;
            }
            .value4{
                color: #f1cd68;
            }
        }

    }
</style>- ScopeChartItem.vue
javascript
<template>
    <div class="chart-item-panel">
        <div class="left">
            <div class="icon">
                <img src="@/assets/images/icon-001.png">
            </div>
            <div class="text">满意</div>
            <div class="value">{{ value1 }}<text class="unit">件</text></div>
        </div>
        <div class="right">
            <div class="icon">
                <img src="@/assets/images/icon-002.png">
            </div>
            <div class="text">不满意</div>
            <div class="value">{{ value2 }}<text class="unit">件</text></div>
        </div>
    </div>
</template>
<script setup lang="ts">
import { ref } from 'vue';

    const value1 = ref(3234);
    const value2 = ref(4324);
</script>
<style lang="less" scoped>
    .chart-item-panel{
        height: calc(((100vh - 100px - 55px) / 3) - 40px);
        display: flex;

        .left,.right{
            flex:1;
            text-align: center;
            color: #fff;
            line-height: 35px;

            .icon{
                margin-top: 40px;
            }

            .value{
                font-size: 1.2rem;
                color:#44edfe;

                .unit{
                    font-size: 1rem;
                    margin-left: 10px;
                }
            }
            .value2{
                color: #3488db;
            }
        }

    }
</style>