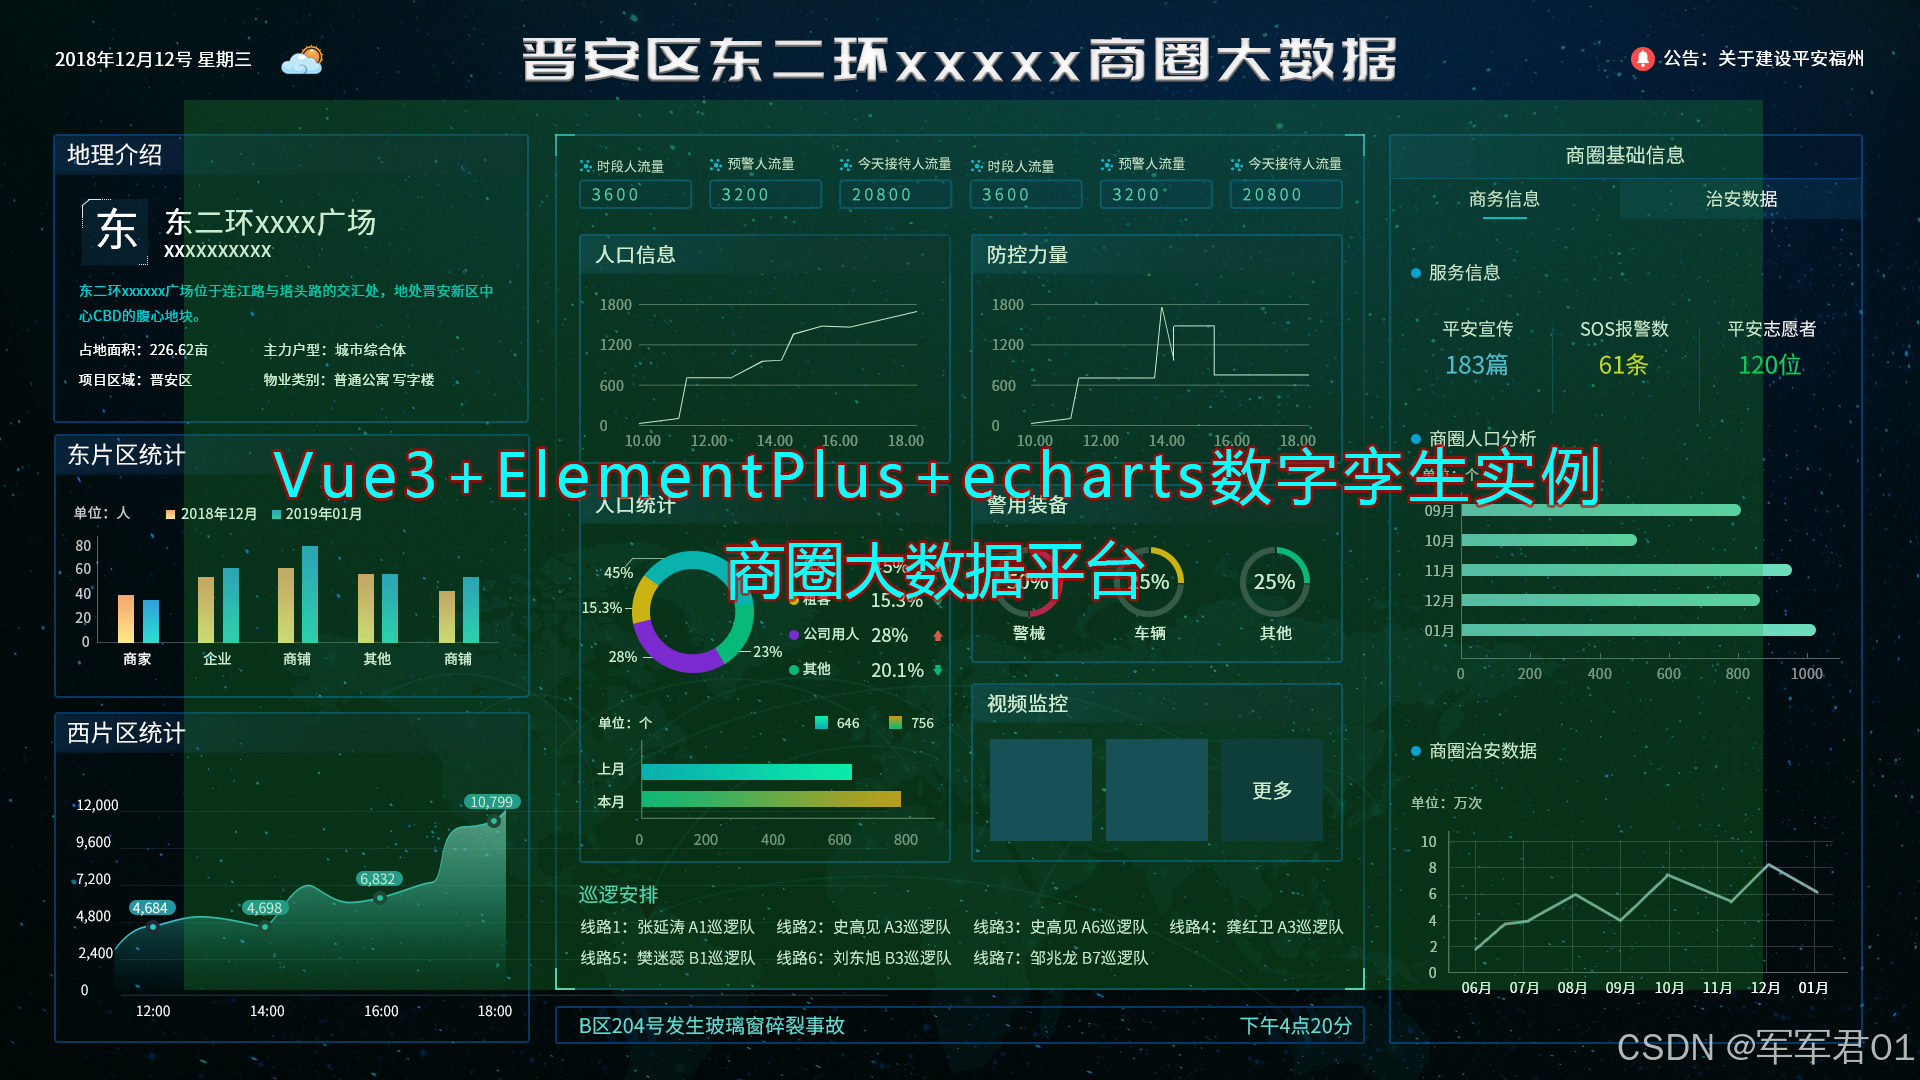
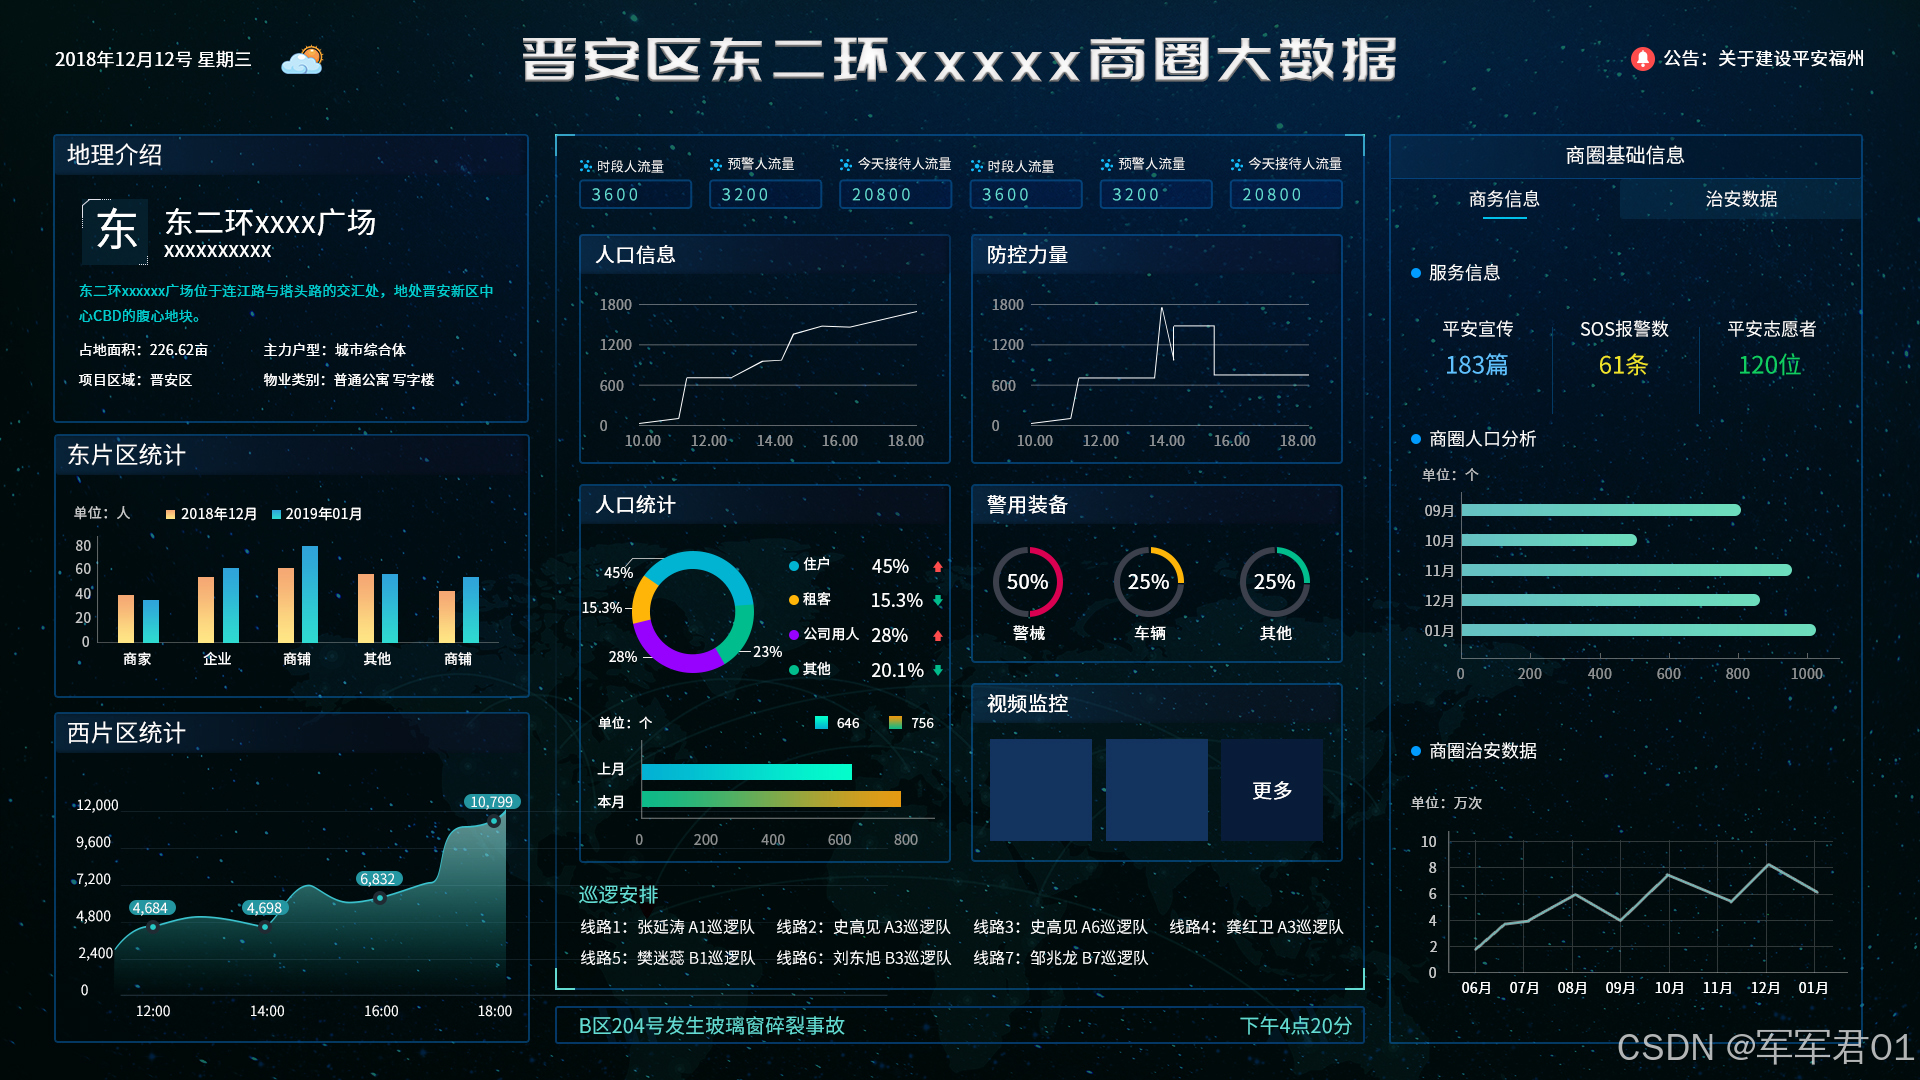
前端数字孪生大屏,使用VUE3+Elementplus+Echarts+TS实现商圈大数据监控大屏,数字孪生,监控大屏展示,可下载作为课堂作业、界面模板、扩展开发,个人作品等。
若想系统学习Echarts开发,我的课程提供了完整的Echarts基础知识讲解并附加大量实战案例,系列课程地址如下:
1. CSDN课程:https://edu.csdn.net/course/detail/40842
2. 51学堂课程:https://edu.51cto.com/course/40414.html
3. B站课程:https://www.bilibili.com/cheese/play/ss456500998
一.效果展示:
二.源码下载:
三.开发视频:
https://www.bilibili.com/video/BV1A7dBBDEa4/
四.实现明细:
4.1 开发环境
使用vscode开发,nodejs版本为v24.11.0,其它项目依赖如下:
1. "dayjs": "^1.11.20"
2. "echarts": "^6.0.0"
3. "element-plus": "^2.13.6"
4. "less": "^4.6.4"
5. "pinia": "^3.0.4"
6. "vue": "^3.5.31"
7. "vue-router": "^5.0.4"
4.2 实现明细
- main.ts
javascript
import { createApp } from 'vue'
import { createPinia } from 'pinia'

import App from './App.vue'
import router from './router'
import ElementPlus from 'element-plus'
import 'element-plus/dist/index.css'
import * as ElementPlusIconsVue from '@element-plus/icons-vue'


const app = createApp(App)

app.use(createPinia())
app.use(router)
app.use(ElementPlus)
for (const [key, component] of Object.entries(ElementPlusIconsVue)) {
  app.component(key, component)
}

app.mount('#app')- App.vue
javascript
<script setup lang="ts"></script>

<template>
  <RouterView></RouterView>
</template>

<style >
  @import url(@/assets/main.css);
</style>- HomeView.vue
javascript
<script setup lang="ts">
import ChartItem from "@/components/ChartItem.vue";
import Header from "@/components/Header.vue"
import { onMounted, reactive, ref } from "vue";
import * as echarts from "echarts"
import ServiceChartItem from "@/components/ServiceChartItem.vue";
import SafeChartItem from "@/components/SafeChartItem.vue";
import CenterChartItem from "@/components/CenterChartItem.vue";

const eChartRef = ref();
const eChart = ref();
const eChartOptions =reactive({
  grid:{
    left:'5%',
    right:'1%',
    top:'15%',
    bottom:'1%',
    containLabel:true
  },
  legend:{
    left:'center',
    top:'1%',
    textStyle:{
      color:'#fff'
    }
  },
  xAxis: {
    type: 'category',
    data: ['商家', '企业', '餐饮', '住户', '其他'],
    axisLabel:{
      color:'#fff'
    }
  },
  yAxis: {
    type: 'value',
    axisLabel:{
      color:'#fff'
    },
    splitLine:{
      show:false
    },
    axisLine :{
      show:true
    }
  },
  series: [
    {
      name:'2301年02月',
      data: [120, 200, 150, 80, 70],
      type: 'bar',
      itemStyle:{
        color:'#fdd881'
      },
      barWidth:20
    },
    {
      name:'2301年01月',
      data: [120, 200, 150, 80, 70],
      type: 'bar',
      itemStyle:{
        color:'#2fd6d1'
      },
      barWidth:20
    }
  ]
})
const wChartRef = ref();
const wChart = ref();
const wChartOptions =reactive({
  grid:{
    left:'5%',
    right:'5%',
    top:'10%',
    bottom:'1%',
    containLabel:true
  },
  xAxis: {
    type: 'category',
    data: ['12:00', '13:00', '14:00', '15:00', '16:00'],
    axisLabel:{
      color:'#fff'
    },
    boundaryGap:false,
  },
  yAxis: {
    type: 'value',
    axisLabel:{
      color:'#fff'
    },
    splitLine:{
      show:false
    },
    axisLine :{
      show:true
    }
  },
  series: [
    {
      data: [120, 200, 150, 80, 70],
      type: 'line',
      itemStyle:{
        color:'#2c959e'
      },
      areaStyle:{
        color:{
          type: 'linear',
          x: 0,
          y: 0,
          x2: 0,
          y2: 1,
          colorStops: [{
              offset: 0, color: '#2c959e' // 0% 处的颜色
          }, {
              offset: 1, color: '#2c959e00' // 100% 处的颜色
          }],
          global: false // 缺省为 false
        }
      },
      label:{
        show:true,
        position:'top',
        textStyle:{
          color:'#fff'
        }
      }
    }
  ]
})

const activeName = ref('1');

onMounted(()=>{
  eChart.value = echarts.init(eChartRef.value);
  eChart.value.setOption(eChartOptions);

  wChart.value = echarts.init(wChartRef.value);
  wChart.value.setOption(wChartOptions);
})

</script>

<template>
  <div class="page">
    <Header></Header>
    <el-row >
      <el-col :span="6">
        <ChartItem title="地理介绍">
          <div class="chart-panel baseinfo">
            <div class="title">
              <div class="icon">
                东
              </div>
              <div class="content">
                <div class="name">东二环军军君广场</div>
                <div class="sub-title">城市CBD,商业中心</div>
              </div>
            </div>
            <div class="address">东二环军军君广场位于雁塔区科技二路和丈八北路交汇处,地处高新区中心CBD的重要地段</div>
            <div class="infos">
              <div class="info-item">占地面积:32.3亩</div>
              <div class="info-item">主力户型:城市综合体</div>
              <div class="info-item">项目区域:高新区</div>
              <div class="info-item">物业类型:普通公寓、写字楼</div>
            </div>
          </div>
        </ChartItem>
        <ChartItem title="东片区统计">
          <div class="chart-panel" ref="eChartRef"></div>
        </ChartItem>
        <ChartItem title="西片区统计">
          <div class="chart-panel" ref="wChartRef"></div>
        </ChartItem>
      </el-col>
      <el-col :span="12">
        <CenterChartItem></CenterChartItem>
      </el-col>
      <el-col :span="6">
        <ChartItem title="商圈基础信息">
          <div class="chart-panel-1">
            <el-tabs v-model="activeName" class="demo-tabs" >
              <el-tab-pane label="商务信息" name="1">
                <ServiceChartItem v-if="activeName === '1'"></ServiceChartItem>
              </el-tab-pane>
              <el-tab-pane label="治安数据" name="2">
                <SafeChartItem v-if="activeName === '2'"></SafeChartItem>
              </el-tab-pane>
            </el-tabs>
          </div>
        </ChartItem>
      </el-col>
    </el-row>
  </div>
</template>
<style lang="less" scoped>
  .page{
    height: 100vh;
    width: 100vw;
    background: url(@/assets/images/bj.jpg);

    .chart-panel{
      height: calc((100vh - 202px) / 3);
    }
    .chart-panel-1{
      height: calc(100vh - 120px);

      :deep(.el-tabs){
        ::after{
          display: none;
        }
        .el-tabs__nav{
          width:100%;
        }
        .el-tabs__item{
          width: 50%;
          color: #fff;
          background: #0a476a55;
        }
        .is-active{
          background: none;
        }
      }
    }
    .baseinfo{
      padding: 10px;
      color: #fff;

      .title{
        display: flex;
        margin-top: 5%;

        .icon{
          background: url(@/assets/images/icon-003.png);
          background-size: 100% 100%;
          text-align: center;
          font-size: 2rem;
          line-height: 60px;
          width:60px;
          height: 60px;
        }
        .content{
          padding-left: 10px;

          .name{
            font-size: 1.2rem;
            font-weight: bold;
            letter-spacing: 5px;
          }
          .sub-title{
            font-size: 0.8rem;
          }
        }
      }
      .address{
        line-height: 20px;
        font-size: 0.8rem;
        color: #02ccce;
        margin: 10px 0px;
      }
      .infos{
        display: flex;
        flex-wrap: wrap;

        .info-item{
          width:50%;
          line-height: 30px;
        font-size: 0.8rem;
        }
      }
    }
  }
</style>- router/index.ts
javascript
import { createRouter, createWebHistory } from 'vue-router'
import HomeView from "@/views/HomeView.vue"
const router = createRouter({
  history: createWebHistory(import.meta.env.BASE_URL),
  routes: [{
    path:'',
    component:HomeView
  }],
})

export default router- ServiceChartItem.vue
javascript
<template>
    <div class="chart-item">
        <div class="title">
            <div class="icon"></div>
            <div class="text">服务信息</div>
        </div>
        <div class="items">
            <div class="item">
                <div class="text">平安宣传</div>
                <div class="value value1">{{ value1 }}篇</div>
            </div>
            <div class="item">
                <div class="text">SOS报警数</div>
                <div class="value value2">{{ value2 }}条</div>
            </div>
            <div class="item">
                <div class="text">平安志愿者</div>
                <div class="value value3">{{ value3 }}位</div>
            </div>
        </div>
    </div>
    <div class="chart-item">
        <div class="title">
            <div class="icon"></div>
            <div class="text">商圈人口分析</div>
        </div>
        <div class="char-panel" ref="persionChartRef"></div>
    </div>
    <div class="chart-item">
        <div class="title">
            <div class="icon"></div>
            <div class="text">商圈治安数据</div>
        </div>
        <div class="char-panel" ref="safeChartRef"></div>
    </div>
</template>
<script setup lang="ts">
import { nextTick, onMounted, reactive, ref } from 'vue';
import * as echarts from "echarts"


const value1 = ref(32321);
const value2 = ref(54354);
const value3 = ref(76576);

const persionChartRef = ref();
const persionChart =ref();
const persionChartOptions = reactive({
    grid:{
    left:'1%',
    right:'1%',
    top:'5%',
    bottom:'1%',
    containLabel:true
  },
  yAxis: {
    type: 'category',
    data: ['01月', '02月', '03月', '04月', '05月'],
    axisLabel:{
      color:'#fff'
    }
  },
  xAxis: {
    type: 'value',
    axisLabel:{
      color:'#fff'
    },
    splitLine:{
      show:false
    },
    axisLine :{
      show:true
    }
  },
  series: [
    {
      name:'人口分析',
      data: [120, 200, 150, 80, 70],
      type: 'bar',
      itemStyle:{
        borderRadius:10,
        color:{
            type: 'linear',
            x: 0,
            y: 0,
            x2: 0,
            y2: 1,
            colorStops: [{
                offset: 0, color: '#05a5a7' // 0% 处的颜色
            }, {
                offset: 1, color: '#12d39f' // 100% 处的颜色
            }],
            global: false // 缺省为 false
        }
      },
      barWidth:15
    }
  ]
})
const safeChartRef = ref();
const safeChart =ref();
const safeChartOptions = reactive({
    grid:{
    left:'5%',
    right:'5%',
    top:'10%',
    bottom:'1%',
    containLabel:true
  },
  xAxis: {
    type: 'category',
    data: ['01月', '02月', '03月', '04月', '05月', '06月', '07月', '08月'],
    axisLabel:{
      color:'#fff'
    },
    boundaryGap:false,
  },
  yAxis: {
    type: 'value',
    axisLabel:{
      color:'#fff'
    },
    splitLine:{
      show:false
    },
    axisLine :{
      show:true
    }
  },
  series: [
    {
      data: [120, 200, 150, 80, 70,54,65,324,543,343],
      type: 'line',
      itemStyle:{
        color:'#fff'
      },
      label:{
        show:true,
        position:'top',
        textStyle:{
          color:'#fff'
        }
      }
    }
  ]
})

onMounted(()=>{
    if(persionChart.value){
        persionChart.value.dispose();
    }
    persionChart.value = echarts.init(persionChartRef.value);
    persionChart.value.setOption(persionChartOptions);

    if(safeChart.value){
        safeChart.value.dispose();
    }
    safeChart.value = echarts.init(safeChartRef.value);
    safeChart.value.setOption(safeChartOptions);
    setTimeout(()=>{
        nextTick(()=>{
            safeChart.value.resize();
            persionChart.value.resize();
        })
    },300)
})

</script>
<style lang="less" scoped>
    .chart-item{
        padding: 10px;

        .title{
            line-height: 30px;
            display: flex;
            color: #fff;

            .icon{
                width:10px;
                height: 10px;
                background: #019cff;
                border-radius: 50%;
                position: relative;
                top: 10px;
            }
            .text{
                padding-left: 10px;
            }
        }
        .items{
            display: flex;

            .item{
                margin-top: 5%;
                flex: 1;
                text-align: center;
                color: #fff;

                .value{
                    font-size: 1.2rem;
                    line-height: 35px;
                    font-weight: bold;
                }
                .value1{
                    color: #60c1ff;
                }
                .value2{
                    color: #f1e52a;
                }
                .value3{
                    color: #f1e52a;
                }
            }
        }
        .char-panel{
            width:calc((100vw * 0.25) - 45px);
            height: calc((100vh - 400px) / 2);
        }
    }
</style>- SafeChartItem.vue
javascript
<template>
    <div class="chart-item">
        <div class="title">
            <div class="icon"></div>
            <div class="text">治安信息</div>
        </div>
        <div class="items">
            <div class="item">
                <div class="text">平安宣传</div>
                <div class="value value1">{{ value1 }}篇</div>
            </div>
            <div class="item">
                <div class="text">SOS报警数</div>
                <div class="value value2">{{ value2 }}条</div>
            </div>
            <div class="item">
                <div class="text">治安设备</div>
                <div class="value value3">{{ value3 }}个</div>
            </div>
        </div>
    </div>
    <div class="chart-item">
        <div class="title">
            <div class="icon"></div>
            <div class="text">商圈人口分析</div>
        </div>
        <div class="char-panel" ref="persionChartRef"></div>
    </div>
    <div class="chart-item">
        <div class="title">
            <div class="icon"></div>
            <div class="text">商圈治安数据</div>
        </div>
        <div class="char-panel" ref="safeChartRef"></div>
    </div>
</template>
<script setup lang="ts">
import { nextTick, onActivated, onMounted, reactive, ref } from 'vue';
import * as echarts from "echarts"


const value1 = ref(3221);
const value2 = ref(5434);
const value3 = ref(7656);

const persionChartRef = ref();
const persionChart =ref();
const persionChartOptions = reactive({
    grid:{
    left:'1%',
    right:'1%',
    top:'5%',
    bottom:'1%',
    containLabel:true
  },
  yAxis: {
    type: 'category',
    data: ['01月', '02月', '03月', '04月', '05月'],
    axisLabel:{
      color:'#fff'
    }
  },
  xAxis: {
    type: 'value',
    axisLabel:{
      color:'#fff'
    },
    splitLine:{
      show:false
    },
    axisLine :{
      show:true
    }
  },
  series: [
    {
      name:'人口分析',
      data: [120, 200, 150, 80, 70],
      type: 'bar',
      itemStyle:{
        borderRadius:10,
        color:{
            type: 'linear',
            x: 0,
            y: 0,
            x2: 0,
            y2: 1,
            colorStops: [{
                offset: 0, color: '#bf640c' // 0% 处的颜色
            }, {
                offset: 1, color: '#da7a1b' // 100% 处的颜色
            }],
            global: false // 缺省为 false
        }
      },
      barWidth:15
    }
  ]
})
const safeChartRef = ref();
const safeChart =ref();
const safeChartOptions = reactive({
    grid:{
    left:'5%',
    right:'5%',
    top:'10%',
    bottom:'1%',
    containLabel:true
  },
  xAxis: {
    type: 'category',
    data: ['01月', '02月', '03月', '04月', '05月', '06月', '07月', '08月'],
    axisLabel:{
      color:'#fff'
    },
    boundaryGap:false,
  },
  yAxis: {
    type: 'value',
    axisLabel:{
      color:'#fff'
    },
    splitLine:{
      show:false
    },
    axisLine :{
      show:true
    }
  },
  series: [
    {
      data: [120, 200, 150, 80, 70,54,65,324,543,343],
      type: 'line',
      itemStyle:{
        color:'#f95050'
      },
      label:{
        show:true,
        position:'top',
        textStyle:{
          color:'#fff'
        }
      }
    }
  ]
})

onMounted(()=>{
    if(persionChart.value){
        persionChart.value.dispose();
    }
    persionChart.value = echarts.init(persionChartRef.value);
    persionChart.value.setOption(persionChartOptions);
    if(safeChart.value){
        safeChart.value.dispose();
    }
    safeChart.value = echarts.init(safeChartRef.value);
    safeChart.value.setOption(safeChartOptions);

    setTimeout(()=>{
        nextTick(()=>{
            safeChart.value.resize();
            persionChart.value.resize();
        })
    },300)
})

</script>
<style lang="less" scoped>
    .chart-item{
        padding: 10px;

        .title{
            line-height: 30px;
            display: flex;
            color: #fff;

            .icon{
                width:10px;
                height: 10px;
                background: #019cff;
                border-radius: 50%;
                position: relative;
                top: 10px;
            }
            .text{
                padding-left: 10px;
            }
        }
        .items{
            display: flex;

            .item{
                margin-top: 5%;
                flex: 1;
                text-align: center;
                color: #fff;

                .value{
                    font-size: 1.2rem;
                    line-height: 35px;
                    font-weight: bold;
                }
                .value1{
                    color: #60c1ff;
                }
                .value2{
                    color: #f1e52a;
                }
                .value3{
                    color: #f1e52a;
                }
            }
        }
        .char-panel{
            width:calc((100vw * 0.25) - 45px);
            height: calc((100vh - 400px) / 2);
        }
    }
</style>- Header.vue
javascript
<template>
    <div class="header">
        <div class="left">
            <div class="time">{{ time }}</div>
            <div class="weather">
                <img src="@/assets/images/icon-001.png">
            </div>
        </div>
        <div class="title">
            军军君商圈大数据
        </div>
        <div class="right">
            <div class="msg">
                <div class="icon"><el-icon><ChatDotRound /></el-icon></div>
                <div class="text">{{ message }}</div>
            </div>
        </div>
    </div>
</template>
<script setup lang="ts">
import dayjs from 'dayjs';
import { onUnmounted, ref } from 'vue';


const time = ref(dayjs().format('YYYY-MM-DD HH:mm:ss'));
const message = ref("公告:系统将于明天升级!!");

const timer = setInterval(()=>{
    time.value = dayjs().format('YYYY-MM-DD HH:mm:ss')
},1000);

onUnmounted(()=>{
    clearInterval(timer)
})

</script>
<style lang="less" scoped>
    .header{
        display: flex;
        color: #fff;
        line-height: 60px;

        .left{
            display: flex;

            .time{
                padding: 0 10px;
            }
            img{
                height: 20px;
            }
        }
        .title{
            flex:1;
            font-size: 2rem;
            text-align: center;
            letter-spacing: 5px;
            line-height: 65px;
        }
        .right{
            display: flex;
            .msg{
                display: flex;

                .icon{
                    padding-top: 2px;
                    background: #ff4c4c;
                    border-radius: 50%;
                    width:25px;
                    height:25px;
                    line-height: 25px;
                    text-align: center;
                    position: relative;
                    top: 20px;
                }
                .text{
                    margin-left: 10px;
                }
            }
        }
    }
</style>- ChartItem.vue
javascript
<template>
    <div class="chart-item">
        <div class="title">{{ title }}</div>
        <slot></slot>
    </div>
</template>
<script lang="ts" setup>

const props = defineProps({
    title:String
})

</script>
<style lang="less" scoped>
    .chart-item{
        border: 1px solid #121331;
        border-radius: 5px;
        margin: 10px;
        .title{
            line-height: 30px;
            color: #fff;
            background: linear-gradient(45deg,#121331,#12133100);
            padding-left: 10px;
        }
    }
</style>- CenterChartItem.vue
javascript
<template>
<div class="content">
<div class="left-top-1"></div>
<div class="left-top-2"></div>
<div class="left-bottom-1"></div>
<div class="left-bottom-2"></div>
<div class="right-top-1"></div>
<div class="right-top-2"></div>
<div class="right-bottom-1"></div>
<div class="right-bottom-2"></div>
<div class="baseinfo">
<div class="item">
<div class="title">
<div class="icon">
<img src="@/assets/images/icon-004.png">
</div>
<div class="text">时段人流量</div>
</div>
<div class="item-content">
{{ value1 }}
</div>
</div>
<div class="item">
<div class="title">
<div class="icon">
<img src="@/assets/images/icon-004.png">
</div>
<div class="text">预警人流量</div>
</div>
<div class="item-content">
{{ value2 }}
</div>
</div>
<div class="item">
<div class="title">
<div class="icon">
<img src="@/assets/images/icon-004.png">
</div>
<div class="text">今天接待人流量</div>
</div>
<div class="item-content">
{{ value3 }}
</div>
</div>
<div class="item">
<div class="title">
<div class="icon">
<img src="@/assets/images/icon-004.png">
</div>
<div class="text">实时人流量</div>
</div>
<div class="item-content">
{{ value4 }}
</div>
</div>
<div class="item">
<div class="title">
<div class="icon">
<img src="@/assets/images/icon-004.png">
</div>
<div class="text">高峰期人流量</div>
</div>
<div class="item-content">
{{ value5 }}
</div>
</div>
<div class="item">
<div class="title">
<div class="icon">
<img src="@/assets/images/icon-004.png">
</div>
<div class="text">平均人流量</div>
</div>
<div class="item-content">
{{ value6 }}
</div>
</div>
</div>
<el-row>
<el-col :span="12">
<ChartItem title="人口信息">
<div class="chart-panel" ref="persionChartRef"></div>
</ChartItem>
</el-col>
<el-col :span="12">
<ChartItem title="防控力量">
<div class="chart-panel" ref="safeChartRef"></div>
</ChartItem>
</el-col>
</el-row>
<el-row>
<el-col :span="12">
<ChartItem title="人口统计">
<div class="chart-panel-3" ref="persionCountChartRef"></div>
</ChartItem>
</el-col>
<el-col :span="12">
<ChartItem title="警用设备">
<div class="chart-panel-1" ref="alertDeviceChartRef"></div>
</ChartItem>
<ChartItem title="视频监控">
<div class="chart-panel-2">
<div class="video-item"></div>
<div class="video-item"></div>
<div class="video-item-btn">更多</div>
</div>
</ChartItem>
</el-col>
</el-row>
<div class="patrol-panel">
<div class="title">巡逻安排</div>
<div class="patrol-items">
<div class="patrol-item">线路1:张萌萌 A1巡逻队</div>
<div class="patrol-item">线路1:张萌萌 A1巡逻队</div>
<div class="patrol-item">线路1:张萌萌 A1巡逻队</div>
<div class="patrol-item">线路1:张萌萌 A1巡逻队</div>
<div class="patrol-item">线路1:张萌萌 A1巡逻队</div>
<div class="patrol-item">线路1:张萌萌 A1巡逻队</div>
<div class="patrol-item">线路1:张萌萌 A1巡逻队</div>
<div class="patrol-item">线路1:张萌萌 A1巡逻队</div>
<div class="patrol-item">线路1:张萌萌 A1巡逻队</div>
<div class="patrol-item">线路1:张萌萌 A1巡逻队</div>
<div class="patrol-item">线路1:张萌萌 A1巡逻队</div>
</div>
</div>
</div>
</template>
<script setup lang="ts">
import { onMounted, reactive, ref } from "vue";
import ChartItem from "./ChartItem.vue"
import * as echarts from "echarts"
const value1 =ref(4343);
const value2 =ref(3243);
const value3 =ref(4563);
const value4 =ref(2343);
const value5 =ref(6563);
const value6 =ref(4352);
const persionChartRef = ref();
const persionChart = ref();
const persionChartOptions = reactive({
grid:{
left:'5%',
right:'5%',
top:'10%',
bottom:'1%',
containLabel:true
},
xAxis: {
type: 'category',
data: ['01月', '02月', '03月', '04月', '05月', '06月', '07月', '08月'],
axisLabel:{
color:'#fff'
},
boundaryGap:false,
},
yAxis: {
type: 'value',
axisLabel:{
color:'#fff'
},
splitLine:{
show:false
},
axisLine :{
show:true
}
},
series: [
{
data: [120, 200, 150, 80, 70,54,65,324,543,343],
type: 'line',
itemStyle:{
color:'#9702fe'
},
label:{
show:true,
position:'top',
textStyle:{
color:'#fff'
}
}
}
]
});
const safeChartRef = ref();
const safeChart = ref();
const safeChartOptions = reactive({
grid:{
left:'5%',
right:'5%',
top:'10%',
bottom:'1%',
containLabel:true
},
xAxis: {
type: 'category',
data: ['01月', '02月', '03月', '04月', '05月', '06月', '07月', '08月'],
axisLabel:{
color:'#fff'
},
boundaryGap:false,
},
yAxis: {
type: 'value',
axisLabel:{
color:'#fff'
},
splitLine:{
show:false
},
axisLine :{
show:true
}
},
series: [
{
data: [120, 200, 150, 80, 70,54,65,324,543,343],
type: 'line',
itemStyle:{
color:'#01b4d2'
},
label:{
show:true,
position:'top',
textStyle:{
color:'#fff'
}
}
}
]
});
const persionCountChartRef = ref();
const persionCountChart = ref();
const persionCountChartOptions = reactive({
grid:{
left:'5%',
right:'5%',
top:'50%',
bottom:'1%',
containLabel:true
},
yAxis: {
type: 'category',
data: ['01月', '02月', '03月', '04月', '05月'],
axisLabel:{
color:'#fff'
},
},
xAxis: {
type: 'value',
axisLabel:{
color:'#fff'
},
splitLine:{
show:false
},
axisLine :{
show:true
}
},
legend: {
top: '3%',
right: '10%',
orient:'vertical',
textStyle:{
color:'#fff'
}
},
series: [
{
name: '人口类型统计',
type: 'pie',
radius: ['20%', '30%'],
center: ['30%', '20%'],
label: {
show: true,
formatter:'{d}%',
textStyle:{
color:'#fff'
}
},
labelLine: {
show: true
},
data: [
{ value: 1048, name: '住户' },
{ value: 735, name: '租客' },
{ value: 580, name: '员工' },
{ value: 484, name: '安保' },
{ value: 300, name: '其它' }
]
},
{
name:'人口分析',
data: [120, 200, 150, 80, 70],
type: 'bar',
itemStyle:{
borderRadius:10,
color:{
type: 'linear',
x: 0,
y: 0,
x2: 1,
y2: 1,
colorStops: [{
offset: 0, color: '#0fba87' // 0% 处的颜色
}, {
offset: 1, color: '#e39a13' // 100% 处的颜色
}],
global: false // 缺省为 false
}
},
barWidth:15
}
]
});
const alertDeviceChartRef = ref();
const alertDeviceChart = ref();
const alertDeviceChartOptions = reactive({
title:[{
text:'警械',
left:'16%',
bottom:'0%',
textStyle:{
color:'#fff',
fontSize:14
}
},{
text:'车辆',
left:'46%',
bottom:'0%',
textStyle:{
color:'#fff',
fontSize:14
}
},{
text:'其他',
left:'76%',
bottom:'0%',
textStyle:{
color:'#fff',
fontSize:14
}
}],
series: [
{
name: '警械',
type: 'pie',
radius: ['50%', '75%'],
center: ['20%', '43%'],
label: {
show: true,
formatter:'{d}%',
position: 'center',
textStyle:{
color:'#fff',
fontSize:16
}
},
labelLine: {
show: false
},
data: [
{ value: 1048, name: '',itemStyle:{
color:'#3c404c'
} },
{ value: 735, name: '租客',itemStyle:{
color:'#da0051'
} }
]
},{
name: '车辆',
type: 'pie',
radius: ['50%', '75%'],
center: ['50%', '43%'],
label: {
show: true,
formatter:'{d}%',
position: 'center',
textStyle:{
color:'#fff',
fontSize:16
}
},
labelLine: {
show: false
},
data: [
{ value: 1048, name: '',itemStyle:{
color:'#3c404c'
} },
{ value: 4355, name: '车辆',itemStyle:{
color:'#ffb508'
} }
]
},{
name: '其他',
type: 'pie',
radius: ['50%', '75%'],
center: ['80%', '43%'],
label: {
show: true,
formatter:'{d}%',
position: 'center',
textStyle:{
color:'#fff',
fontSize:16
}
},
labelLine: {
show: false
},
data: [
{ value: 1048, name: '',itemStyle:{
color:'#3c404c'
} },
{ value: 5466, name: '其他',itemStyle:{
color:'#01bd8d'
} }
]
}
]
});
onMounted(()=>{
persionChart.value = echarts.init(persionChartRef.value);
persionChart.value.setOption(persionChartOptions);
safeChart.value = echarts.init(safeChartRef.value);
safeChart.value.setOption(safeChartOptions);
persionCountChart.value = echarts.init(persionCountChartRef.value);
persionCountChart.value.setOption(persionCountChartOptions);
alertDeviceChart.value = echarts.init(alertDeviceChartRef.value);
alertDeviceChart.value.setOption(alertDeviceChartOptions);
})
</script>
<style lang="less" scoped>
.content{
border:1px solid #121331;
position: relative;
.left-top-1{
position: absolute;
left:0px;
top:-1px;
height: 3px;
width:15px;
background: #64dcd2;
}
.left-top-2{
position: absolute;
left:-1px;
top:0px;
height: 15px;
width:3px;
background: #64dcd2;
}
.left-bottom-1{
position: absolute;
left:0px;
bottom:-1px;
height: 3px;
width:15px;
background: #64dcd2;
}
.left-bottom-2{
position: absolute;
left:-1px;
bottom:0px;
height: 15px;
width:3px;
background: #64dcd2;
}
.right-top-1{
position: absolute;
right:0px;
top:-1px;
height: 3px;
width:15px;
background: #64dcd2;
}
.right-top-2{
position: absolute;
right:-1px;
top:0px;
height: 15px;
width:3px;
background: #64dcd2;
}
.right-bottom-1{
position: absolute;
right:0px;
bottom:-1px;
height: 3px;
width:15px;
background: #64dcd2;
}
.right-bottom-2{
position: absolute;
right:-1px;
bottom:0px;
height: 15px;
width:3px;
background: #64dcd2;
}
.baseinfo{
display: flex;
margin: 10px;
.item{
flex: 1;
color: #fff;
margin: 5px;
.title{
display: flex;
line-height: 30px;
.icon{
img{
width:14px;
position: relative;
top:2px;
}
}
.text{
margin-left: 5px;
}
}
.item-content{
line-height: 30px;
color: #64dcd2;
border:1px solid #26297e;
border-radius: 3px;
padding: 0 10px;
}
}
}
.patrol-panel{
margin: 10px;
.title{
line-height: 35px;
font-size: 1.2rem;
color:#64dcd2
}
.patrol-items{
display: flex;
flex-wrap: wrap;
.patrol-item{
width:180px;
color:#fff;
margin: 3px;
font-size: 0.8rem;
}
}
}
.chart-panel{
height: calc((100vh - 600px) / 2);
}
.chart-panel-3{
height: calc((100vh - 600px) / 2 + 179px);
}
.chart-panel-1,.chart-panel-2{
height: calc(((100vh - 600px) / 2 + 137px) / 2);
}
.chart-panel-2{
display: flex;
.video-item{
margin: 10px;
background: #13335f;
width:30%;
cursor: pointer;
}
.video-item-btn{
margin: 10px;
background: #13335f;
width:30%;
text-align: center;
font-size: 1.6rem;
color: #fff;
line-height: 125px;
cursor: pointer;
}
}
}
</style>- main.css
javascript
@import './base.css';

#app {

}

a,
.green {
  text-decoration: none;
  color: hsla(160, 100%, 37%, 1);
  transition: 0.4s;
}

@media (hover: hover) {
  a:hover {
    background-color: hsla(160, 100%, 37%, 0.2);
  }
}

@media (min-width: 1024px) {
  body {
  }

  #app {
  }
}- base.css
javascript
/* color palette from <https://github.com/vuejs/theme> */
:root {
  --vt-c-white: #ffffff;
  --vt-c-white-soft: #f8f8f8;
  --vt-c-white-mute: #f2f2f2;

  --vt-c-black: #181818;
  --vt-c-black-soft: #222222;
  --vt-c-black-mute: #282828;

  --vt-c-indigo: #2c3e50;

  --vt-c-divider-light-1: rgba(60, 60, 60, 0.29);
  --vt-c-divider-light-2: rgba(60, 60, 60, 0.12);
  --vt-c-divider-dark-1: rgba(84, 84, 84, 0.65);
  --vt-c-divider-dark-2: rgba(84, 84, 84, 0.48);

  --vt-c-text-light-1: var(--vt-c-indigo);
  --vt-c-text-light-2: rgba(60, 60, 60, 0.66);
  --vt-c-text-dark-1: var(--vt-c-white);
  --vt-c-text-dark-2: rgba(235, 235, 235, 0.64);
}

/* semantic color variables for this project */
:root {
  --color-background: var(--vt-c-white);
  --color-background-soft: var(--vt-c-white-soft);
  --color-background-mute: var(--vt-c-white-mute);

  --color-border: var(--vt-c-divider-light-2);
  --color-border-hover: var(--vt-c-divider-light-1);

  --color-heading: var(--vt-c-text-light-1);
  --color-text: var(--vt-c-text-light-1);

  --section-gap: 160px;
}

@media (prefers-color-scheme: dark) {
  :root {
    --color-background: var(--vt-c-black);
    --color-background-soft: var(--vt-c-black-soft);
    --color-background-mute: var(--vt-c-black-mute);

    --color-border: var(--vt-c-divider-dark-2);
    --color-border-hover: var(--vt-c-divider-dark-1);

    --color-heading: var(--vt-c-text-dark-1);
    --color-text: var(--vt-c-text-dark-2);
  }
}

*,
*::before,
*::after {
  box-sizing: border-box;
  margin: 0;
  font-weight: normal;
}

body {
  min-height: 100vh;
  color: var(--color-text);
  background: var(--color-background);
  transition:
    color 0.5s,
    background-color 0.5s;
  line-height: 1.6;
  font-family:
    Inter,
    -apple-system,
    BlinkMacSystemFont,
    'Segoe UI',
    Roboto,
    Oxygen,
    Ubuntu,
    Cantarell,
    'Fira Sans',
    'Droid Sans',
    'Helvetica Neue',
    sans-serif;
  font-size: 15px;
  text-rendering: optimizeLegibility;
  -webkit-font-smoothing: antialiased;
  -moz-osx-font-smoothing: grayscale;
  margin: 0;
  padding: 0;
}