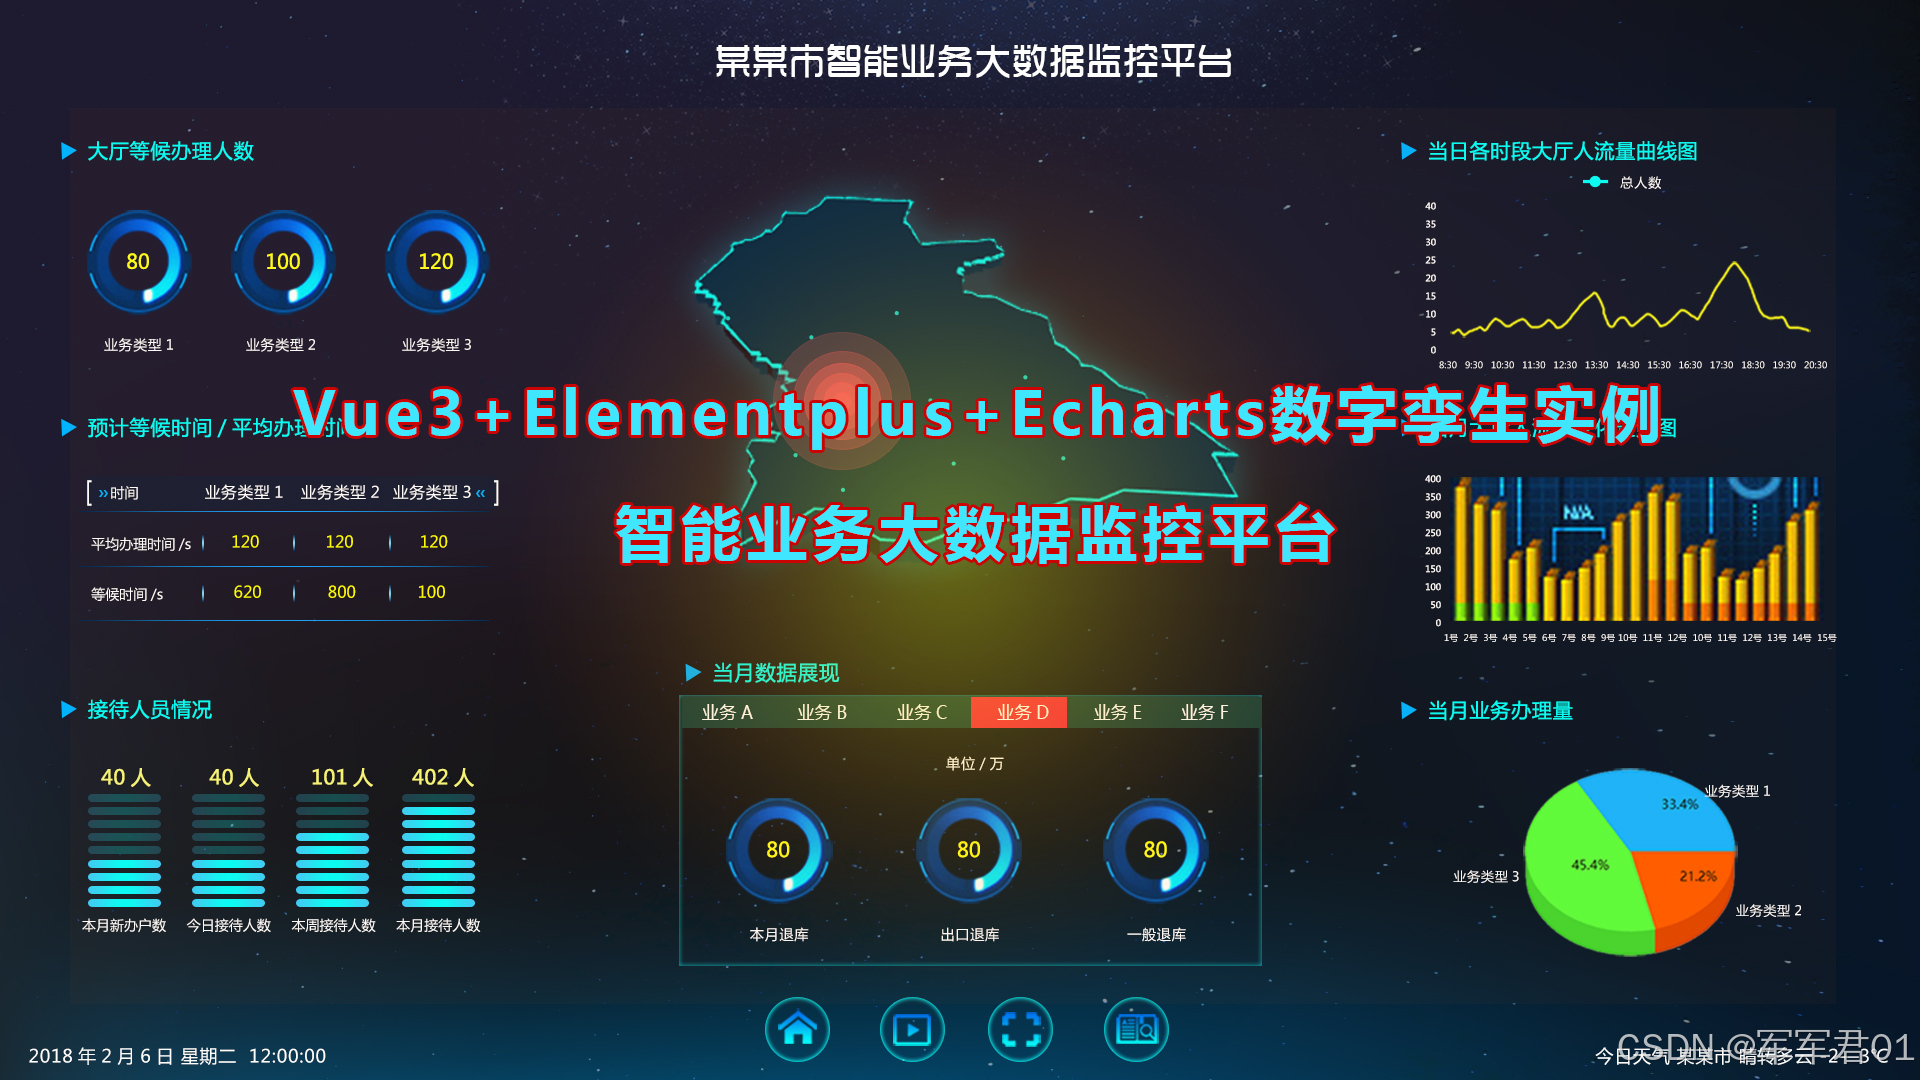
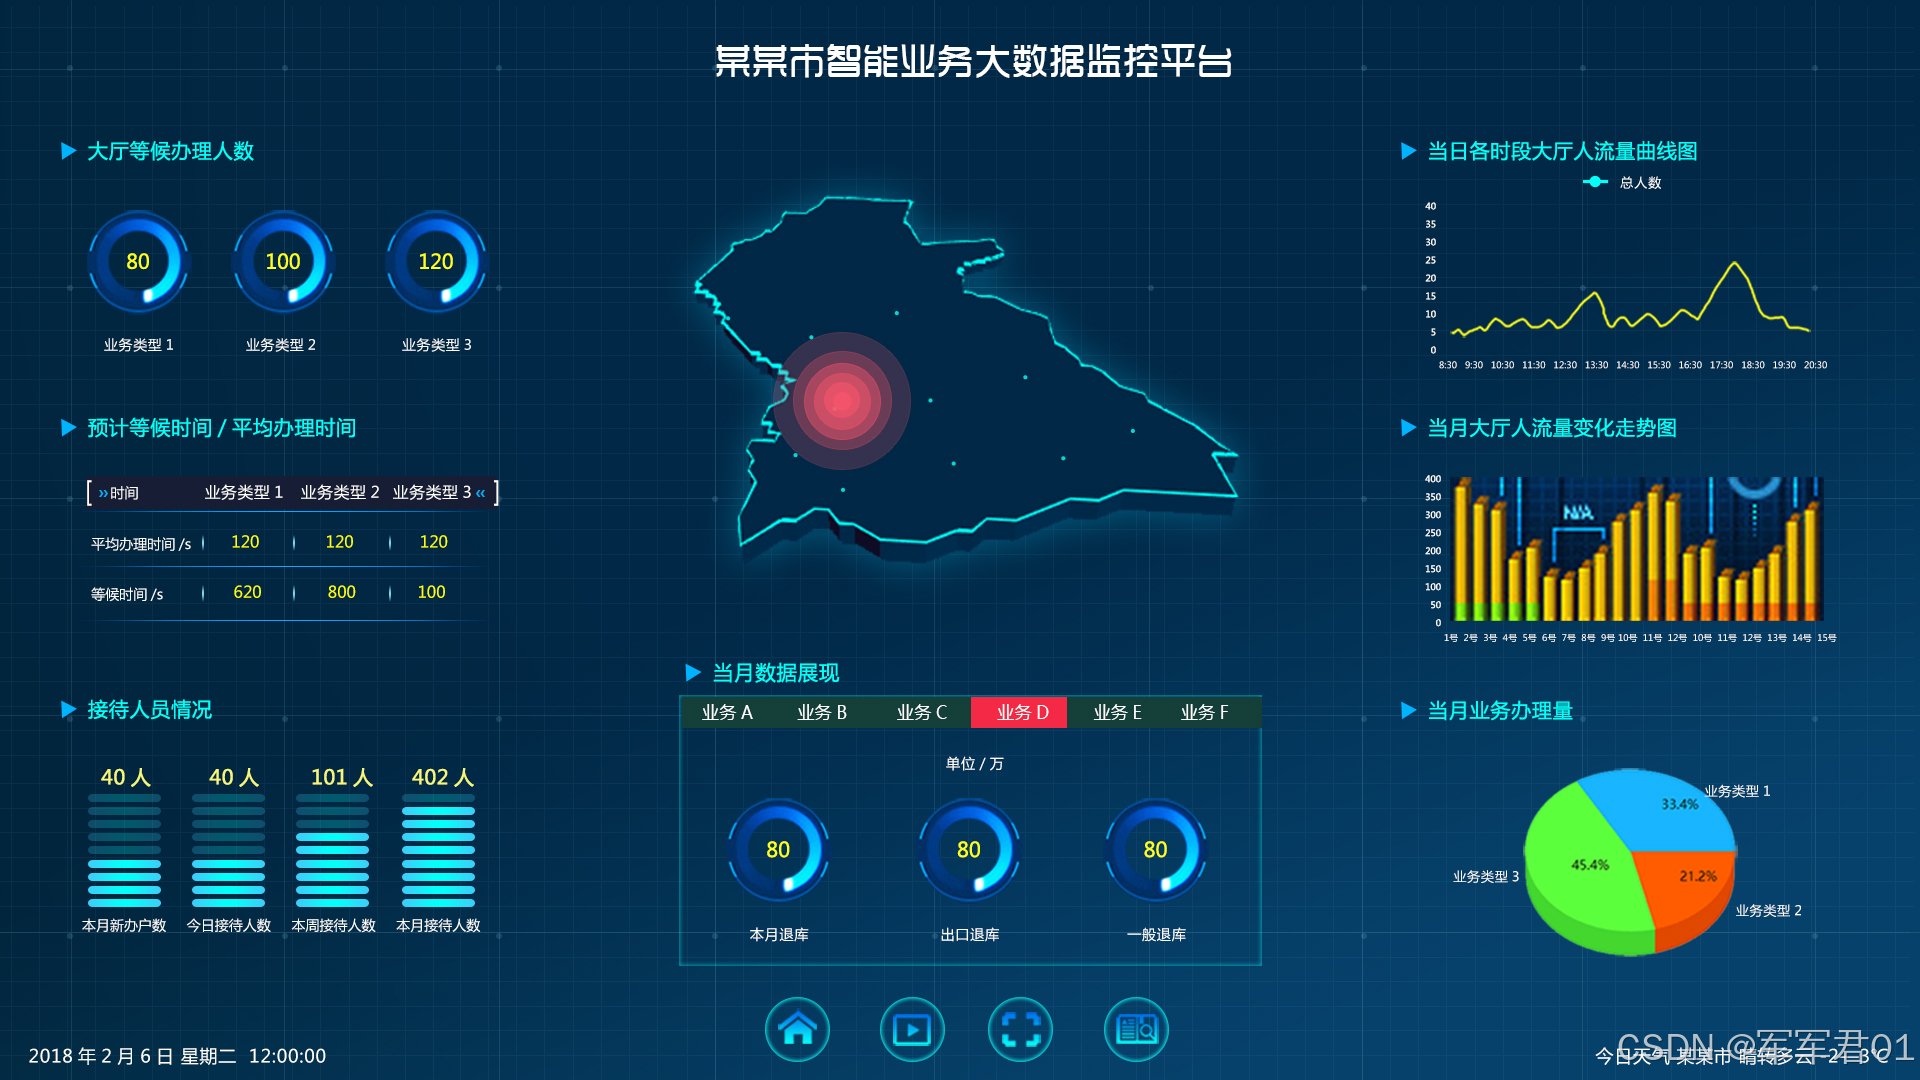
前端数字孪生大屏,使用VUE3+Elementplus+Echarts+TS实现智能业务大数据监管平台,数字孪生,监控大屏展示,可下载作为课堂作业、界面模板、扩展开发,个人作品等。
若想系统学习Echarts开发,我的课程提供了完整的Echarts基础知识讲解并附加大量实战案例,系列课程地址如下:
1. CSDN课程:https://edu.csdn.net/course/detail/40842
2. 51学堂课程:https://edu.51cto.com/course/40414.html
3. B站课程:https://www.bilibili.com/cheese/play/ss456500998
一.效果展示:
二.源码下载:
三.开发视频:
https://www.bilibili.com/video/BV1TLoUBdEbb/
四.实现明细:
4.1 开发环境
使用vscode开发,nodejs版本为v24.11.0,其它项目依赖如下:
1. "dayjs": "^1.11.20"
2. "echarts": "^5.1.2"
3. "element-plus": "^2.13.6"
4. "less": "^4.6.4"
5. "pinia": "^3.0.4"
6. "vue": "^3.5.31"
7. "vue-router": "^5.0.4"
8. "vue-router": "^2.0.9"
4.2 实现明细
- main.ts
javascript
import { createApp } from 'vue'
import { createPinia } from 'pinia'

import "@/assets/main.css"
import ElementPlus from 'element-plus'
import 'element-plus/dist/index.css'

import App from './App.vue'
import router from './router'

const app = createApp(App)

app.use(createPinia())
app.use(router)
app.use(ElementPlus)

app.mount('#app')- App.vue
javascript
<script setup lang="ts"></script>

<template>
  <RouterView></RouterView>
</template>

<style scoped></style>- HomeView.vue
javascript
<script setup lang="ts">
import ChartItem from '@/components/ChartItem.vue';
import Footer from '@/components/Footer.vue';
import { onMounted, reactive,ref } from 'vue';
import * as echarts from "echarts"
import MapChartItem from '@/components/MapChartItem.vue';
const todoChartRef = ref();
const todoChart = ref();
const todoChartOption = reactive({
title: [
{
text: '业务类型1',
left: '16.67%',
top: '75%',
textAlign: 'center',
textStyle:{
color:'#fff',
fontSize:14
}
},
{
text: '业务类型2',
left: '50%',
top: '75%',
textAlign: 'center',
textStyle:{
color:'#fff',
fontSize:14
}
},
{
text: '业务类型3',
left: '83.33%',
top: '75%',
textAlign: 'center',
textStyle:{
color:'#fff',
fontSize:14
}
}
],
series: [
{
type: 'pie',
radius: ['40%','65%'],
center: ['50%', '40%'],
data: [{
name: '',
value: 70,
itemStyle:{
color:'#00000022'
}
},
{
name: '业务类型1',
itemStyle: {
borderRadius: 30,
color:new echarts.graphic.LinearGradient(0, 1, 0, 0, [
{
offset: 0,
color: '#03f3f7',
},
{
offset: 0.5,
color: 'rgba(0, 182, 253, .2)',
},
{
offset: 1,
color: '#03f3f700',
},
]),
},
value: 68
}],
label: {
show:true,
position:'center',
textStyle:{
color:'#ffff1b',
fontSize:16
},
formatter:'{c}'
},
left: 0,
right: '66.6667%',
top: 0,
bottom: 0
},
{
type: 'pie',
radius: ['40%','65%'],
center: ['50%', '40%'],
data: [{
name: '',
value: 20,
itemStyle:{
color:'#00000022'
}
},
{
name: '业务类型2',
itemStyle: {
borderRadius: 30,
color:new echarts.graphic.LinearGradient(0, 1, 0, 0, [
{
offset: 0,
color: '#03f3f7',
},
{
offset: 0.5,
color: 'rgba(0, 182, 253, .2)',
},
{
offset: 1,
color: '#03f3f700',
},
]),
},
value:428
}],
label: {
show:true,
position:'center',
textStyle:{
color:'#ffff1b',
fontSize:16
},
formatter:'{c}'
},
left: '33.3333%',
right: '33.3333%',
top: 0,
bottom: 0
},
{
type: 'pie',
radius: ['40%','65%'],
center: ['50%', '40%'],
data: [{
name: '',
value: 43,
itemStyle:{
color:'#00000022'
}
},
{
name: '业务类型3',
itemStyle: {
borderRadius: 30,
color:new echarts.graphic.LinearGradient(0, 1, 0, 0, [
{
offset: 0,
color: '#03f3f7',
},
{
offset: 0.5,
color: 'rgba(0, 182, 253, .2)',
},
{
offset: 1,
color: '#03f3f700',
},
]),
},
value: 228
}],
label: {
show:true,
position:'center',
textStyle:{
color:'#ffff1b',
fontSize:16
},
formatter:'{c}'
},
left: '66.6667%',
right: 0,
top: 0,
bottom: 0
}
]
});
const userChartRef = ref();
const userChart = ref();
const userChartOption = reactive({
grid: {
top: '15%',
left:'10%',
bottom: '1%',
right:'10%',
containLabel:false
},
xAxis: {
data: ['本月新办户数' , '今日接待人数' , '本周接待人数' , '本月接待人数'],
axisLine: {
show: false, //隐藏X轴刻度
},
axisTick: {
show: false, //隐藏X轴刻度
},
boundaryGap:false,
axisLabel: {
show: true,
fontSize: 14,
textStyle: {
color: '#fff', //X轴文字颜色
},
},
},
yAxis: [
{
show:false
},
],
series: [
// {
// // 值
// name: '采集覆盖率情况',
// type: 'bar',
// barWidth: 80,
// itemStyle: {
// normal: {
// color: new echarts.graphic.LinearGradient(0, 0, 0, 1, [
// {
// offset: 0,
// color: '#05fef9',
// },
// {
// offset: 1,
// color: '#05fef9bb',
// },
// ]),
// },
// },
// data: [88.6, 28.9, 89, 88.8],
// z: 10,
// zlevel: 2,
// label: {
// show: true,
// position: 'top',
// distance: 30,
// fontSize: 16,
// fontFamily:'DIN',
// color: '#ecff00',
// zlevel: 4,
// z: 10,
// formatter:'{c}人'
// },
// },
{
// 值分隔
type: 'pictorialBar',
itemStyle: {
normal: {
color: '#04fff9',
},
},
symbolRepeat: 'fixed',
symbolMargin: 8,
symbol: 'circle',
symbolClip: true,
symbolSize: [80, 10],
symbolPosition: 'start',
// symbolOffset: [0, -1],
// symbolBoundingData: this.total,
data: [88.6, 18.9, 59, 28.8],
width: 25,
z: 0,
zlevel: 3,
label: {
show: true,
position: 'top',
distance: 10,
fontSize: 16,
fontFamily:'DIN',
color: '#ecff00',
zlevel: 4,
z: 10,
formatter:'{c}人'
},
},
// {
// //辅助背景图形
// name: '背景条',
// type: 'bar', //pictorialBar
// barWidth: 80,
// barGap: '-100%',
// itemStyle: {
// normal: {
// borderWidth: 0,
// color: '#045669',
// },
// barBorderRadius: 10,
// },
// data: [100, 100, 100, 100],
// z: 0,
// zlevel: 0,
// },
{
// 背景分隔
type: 'pictorialBar',
itemStyle: {
normal: {
color: '#025769',
},
},
symbolRepeat: 'fixed',
symbolMargin: 8,
symbol: 'circle',
symbolClip: true,
symbolSize: [80, 10],
symbolPosition: 'start',
// symbolOffset: [0, -1],
// symbolBoundingData: this.total,
data: [100, 100, 100, 100],
width: 35,
z: 0,
zlevel: 1,
},
],
});
const monthChartRef = ref();
const monthChart = ref();
const monthChartOption = reactive({
title: [
{
text: '本月退库',
left: '16.67%',
top: '75%',
textAlign: 'center',
textStyle:{
color:'#fff',
fontSize:14
}
},
{
text: '出库退库',
left: '50%',
top: '75%',
textAlign: 'center',
textStyle:{
color:'#fff',
fontSize:14
}
},
{
text: '一般退库',
left: '83.33%',
top: '75%',
textAlign: 'center',
textStyle:{
color:'#fff',
fontSize:14
}
}
],
series: [
{
type: 'pie',
radius: ['40%','65%'],
center: ['50%', '40%'],
data: [{
name: '',
value: 70,
itemStyle:{
color:'#00000022'
}
},
{
name: '本月退库',
itemStyle: {
borderRadius: 30,
color:new echarts.graphic.LinearGradient(0, 1, 0, 0, [
{
offset: 0,
color: '#015bd4',
},
{
offset: 0.5,
color: 'rgba(0, 182, 253, .2)',
},
{
offset: 1,
color: '#015bd400',
},
]),
},
value: 68
}],
label: {
show:true,
position:'center',
textStyle:{
color:'#ffff1b',
fontSize:16
},
formatter:'{c}'
},
left: 0,
right: '66.6667%',
top: 0,
bottom: 0
},
{
type: 'pie',
radius: ['40%','65%'],
center: ['50%', '40%'],
data: [{
name: '',
value: 20,
itemStyle:{
color:'#00000022'
}
},
{
name: '出库退库',
itemStyle: {
borderRadius: 30,
color:new echarts.graphic.LinearGradient(0, 1, 0, 0, [
{
offset: 0,
color: '#015bd4',
},
{
offset: 0.5,
color: 'rgba(0, 182, 253, .2)',
},
{
offset: 1,
color: '#015bd400',
},
]),
},
value:428
}],
label: {
show:true,
position:'center',
textStyle:{
color:'#ffff1b',
fontSize:16
},
formatter:'{c}'
},
left: '33.3333%',
right: '33.3333%',
top: 0,
bottom: 0
},
{
type: 'pie',
radius: ['40%','65%'],
center: ['50%', '40%'],
data: [{
name: '',
value: 43,
itemStyle:{
color:'#00000022'
}
},
{
name: '一般退库',
itemStyle: {
borderRadius: 30,
color:new echarts.graphic.LinearGradient(0, 1, 0, 0, [
{
offset: 0,
color: '#015bd4',
},
{
offset: 0.5,
color: 'rgba(0, 182, 253, .2)',
},
{
offset: 1,
color: '#015bd400',
},
]),
},
value: 228
}],
label: {
show:true,
position:'center',
textStyle:{
color:'#ffff1b',
fontSize:16
},
formatter:'{c}'
},
left: '66.6667%',
right: 0,
top: 0,
bottom: 0
}
]
});
const timeChartRef = ref();
const timeChart = ref();
const timeChartOption = reactive({
grid: {
top: '15%',
left:'10%',
bottom: '20%',
right:'3%',
containLabel:false
},
xAxis: {
type: 'category',
data: ['08:00', '08:05', '08:10', '08:15', '08:20', '08:25', '08:30'],
axisLabel:{
textStyle:{
color:'#fff'
}
},
axisLine:{
lineStyle:{
color:'#02336f55'
}
},
boundaryGap:false,
},
yAxis: {
type: 'value',
axisLabel:{
textStyle:{
color:'#fff'
}
},
splitLine:{
lineStyle:{
color:'#02336f55'
}
},
axisLine:{
lineStyle:{
color:'#02336f55'
}
}
},
series: [
{
data: [150, 230, 224, 218, 135, 147, 260],
type: 'line',
itemStyle:{
color:'#b2be29'
}
}
]
});
const trafficChartRef = ref();
const trafficChart = ref();
const barWidth = 30;
const yAxisData = [31212, 25634, 22156, 18647, 15608, 43535, 65476, 21343, 31221, 21223]
const trafficChartOption = reactive({
// 区域位置
grid: {
top: '15%',
left:'10%',
bottom: '20%',
right:'3%',
containLabel:false
},
// X轴
xAxis: [
{
data: ['1日', '2日', '3日', '4日', '5日', '6日', '7日', '8日', '9日', '10日'],
type: 'category',
show: true,
axisLabel:{
margin:15,
textStyle:{
color:'#fff'
}
},
splitLine:{
lineStyle:{
color:'#02336f55'
}
},
axisLine:{
lineStyle:{
color:'#02336f55'
}
}
}
],
yAxis: {
show: true,
axisLabel:{
textStyle:{
color:'#fff'
}
},
splitLine:{
lineStyle:{
color:'#02336f55'
}
},
axisLine:{
lineStyle:{
color:'#02336f55'
}
}
},
series: [
{
// 底
z: 2,
type: 'pictorialBar',
data: yAxisData,
symbol: 'diamond',
symbolOffset: [0, '50%'],
symbolSize: [barWidth, barWidth * 0.5],
itemStyle: {
normal: {
color: '#ffeb82'
}
}
},
{
type: 'bar',
barWidth: barWidth / 2, //柱子宽度
barGap: 0, //设置左右柱状图间距为0
itemStyle: {
//柱子样式
color: {
//渐变颜色
type: 'linear',
x: 0,
y: 0,
x2: 0,
y2: 1, //垂直方向渐变
colorStops: [
{ offset: 0, color: 'rgba(208, 163, 71, 1)' },
{ offset: 1, color: 'rgba(208, 163, 71, 0.5)' }
]
}
},
name: '收入',
data: yAxisData
},
//右边柱状图
{
type: 'bar',
barWidth: barWidth / 2, //柱子宽度
itemStyle: {
//柱子样式
color: {
type: 'linear',
x: 0,
y: 0,
x2: 0,
y2: 1,
colorStops: [
{ offset: 0, color: 'rgba(255, 215, 11, 1)' },
{ offset: 1, color: 'rgba(255, 215, 11, 0.5)' }
]
}
},
name: '收入',
data: yAxisData
},
{
// 顶
z: 3,
type: 'pictorialBar',
symbolPosition: 'end',
data: yAxisData,
symbol: 'diamond',
symbolOffset: [0, '-50%'],
symbolSize: [barWidth, barWidth * 0.5],
itemStyle: {
normal: {
borderWidth: 0,
color: 'rgba(208, 163, 71, 1)'
}
}
}
]
});
const serviceChartRef = ref();
const serviceChart = ref();
const serviceChartOptions = reactive({
legend: {
top: 'center',
right: '15%',
padding:20,
textStyle:{
color:'#fff'
},
orient:'vertical'
},
series: [
{
name: '业务办理量',
type: 'pie',
radius: ['0%', '90%'],
center:['30%','50%'],
avoidLabelOverlap: false,
itemStyle: {
borderRadius: 0,
},
label: {
show: true,
textStyle:{
color:'#fff'
},
position:'inner',
formatter:'{c}',
},
labelLine:{
show:false
},
data: [
{ value: 1048, name: '业务类型一',itemStyle:{
color:'#5cff3c'
} },
{ value: 735, name: '业务类型二',itemStyle:{
color:'#ff5c00'
} },
{ value: 580, name: '业务类型三',itemStyle:{
color:'#18b5ff'
} },
{ value: 484, name: '业务类型四',itemStyle:{
color:'#0af9f9'
} },
{ value: 300, name: '业务类型五',itemStyle:{
color:'#eab909'
} }
]
}
]
});
onMounted(()=>{
todoChart.value = echarts.init(todoChartRef.value);
todoChart.value.setOption(todoChartOption);
userChart.value = echarts.init(userChartRef.value);
userChart.value.setOption(userChartOption);
monthChart.value = echarts.init(monthChartRef.value);
monthChart.value.setOption(monthChartOption);
timeChart.value = echarts.init(timeChartRef.value);
timeChart.value.setOption(timeChartOption);
trafficChart.value = echarts.init(trafficChartRef.value);
trafficChart.value.setOption(trafficChartOption);
serviceChart.value = echarts.init(serviceChartRef.value);
serviceChart.value.setOption(serviceChartOptions);
})
</script>
<template>
<div class="page">
<div class="header">
某某市智能业务大数据监控平台
</div>
<div class="content">
<el-row>
<el-col :span="8">
<ChartItem title="大厅等候办理人数">
<div class="chart-item" ref="todoChartRef"></div>
</ChartItem>
<ChartItem title="预计等候时间/平均办理时间">
<div class="chart-item time-items">
<div class="tr header-tr">
<div class="th">时间</div>
<div class="th center">业务类型1</div>
<div class="th center">业务类型2</div>
<div class="th center">业务类型3</div>
</div>
<div class="tr-line"></div>
<div class="tr">
<div class="td">平均办理时间(S)</div>
<div class="td-line"></div>
<div class="td value">4234</div>
<div class="td-line"></div>
<div class="td value">432</div>
<div class="td-line"></div>
<div class="td value">432</div>
</div>
<div class="tr-line"></div>
<div class="tr">
<div class="td ">等候时间(S)</div>
<div class="td-line"></div>
<div class="td value">4234</div>
<div class="td-line"></div>
<div class="td value">432</div>
<div class="td-line"></div>
<div class="td value">4323</div>
</div>
<div class="tr-line"></div>
</div>
</ChartItem>
<ChartItem title="接待人员情况">
<div class="chart-item" ref="userChartRef"></div>
</ChartItem>
</el-col>
<el-col :span="8">
<div class="map-chart">
<MapChartItem></MapChartItem>
</div>
<ChartItem title="当月数据展现">
<div class="chart-item month-chart" ref="monthChartRef"></div>
</ChartItem>
</el-col>
<el-col :span="8">
<ChartItem title="当日各时段大厅人流量曲线图">
<div class="chart-item" ref="timeChartRef"></div>
</ChartItem>
<ChartItem title="当月大厅人流量变化走势图">
<div class="chart-item" ref="trafficChartRef"></div>
</ChartItem>
<ChartItem title="当月业务办理量">
<div class="chart-item" ref="serviceChartRef"></div>
</ChartItem>
</el-col>
</el-row>
</div>
<div class="footer">
<Footer></Footer>
</div>
</div>
</template>
<style lang="less" scoped>
.page{
background: url(@/assets/images/bg.jpg) 100% 100%;
height: 100vh;
.header{
height: 60px;
line-height: 60px;
text-align: center;
font-size: 2rem;
letter-spacing: 5px;
color:#fff
}
.content{
height: calc(100vh - 60px - 60px);
.chart-item{
height: calc((100vh - 120px - 110px) / 3);
}
.time-items{
.tr{
display: flex;
color:#fff;
margin: 10px;
line-height: 40px;
padding: 0 10px;
.th,.td{
flex:1
}
.name{
width:100px;
}
.value{
color:#ffff01;
text-align: center;
}
.center{
text-align: center;
}
}
.header-tr{
background: #171d3488;
}
}
.tr-line{
height: 2px;
width:100%;
background: linear-gradient(45deg,#17a4ff00,#17a4ff,#17a4ff00);
}
.td-line{
height: 40px;
width:2px;
background: linear-gradient(45deg,#17a4ff00,#17a4ff,#17a4ff00);
}
.month-chart{
border:1px solid #036b7f;
box-shadow: inset 0 0 3px 2px #009688;
}
}
}
</style>- router/index.ts
javascript
import HomeView from '@/views/HomeView.vue'
import { createRouter, createWebHistory } from 'vue-router'

const router = createRouter({
  history: createWebHistory(import.meta.env.BASE_URL),
  routes: [{
    path:"",
    component:HomeView
  }],
})

export default router- MapChartItem.vue
javascript
<template>
    <div class="map-chart-item" ref="mapChartRef"></div>
</template>
<script setup lang="ts">
import { onMounted, reactive,ref } from 'vue';
import * as echarts from "echarts";
import 'echarts-gl';

const mapChartRef = ref();
const mapChart = ref();
const mapChartOption = reactive({
    geo3D:{
        map:'xa',
        label:{
            show:true,
            color:'#fff'
        },
        itemStyle:{
            color:'#002846',
            borderWidth:1,
            borderColor:'#00fbfa'
        },
        regionHeight:5,
        viewControl:{
            beta:50,
            alpha:50
        },
        light:{
            color:'#fff'
        }
    },
    series:{
        type:'scatter3D',
        coordinateSystem:'geo3D',
        symbolSize: 30,
        itemStyle:{
            color:"#f2546b"
        },
        data: [{
            name:'新城区',
            value:[108.959903, 34.26927, 5]
        },{
            name:'长安区',
            value:[108.941579,34.157097, 5]
        }]
    }
});
onMounted(()=>{
    fetch(new URL('@/assets/geo/xa.json', import.meta.url).href).then(response=>{
        response.json().then(data=>{
            echarts.registerMap('xa', data);
            mapChart.value = echarts.init(mapChartRef.value);
            mapChart.value.setOption(mapChartOption);
        })
    })
})
</script>
<style lang="less" scoped>
.map-chart-item{
    height: 55vh;
}
</style>- Footer.vue
javascript
<template>
    <div class="footer">
        <div class="time">{{ time }}</div>
        <div class="menus">
            <div class="menu-item ">
                <div class="inner selected">
                    <img src="@/assets/images/icon-002.png">
                </div>
            </div>
            <div class="menu-item">
                <div class="inner">
                    <img src="@/assets/images/icon-003.png">
                </div>
            </div>
            <div class="menu-item">
                <div class="inner">
                    <img src="@/assets/images/icon-004.png">
                </div>
            </div>
            <div class="menu-item">
                <div class="inner">
                    <img src="@/assets/images/icon-005.png">
                </div>
            </div>
        </div>
        <div class="weather">今日天气 某某市 晴转多云 -2------3℃</div>
    </div>
</template>
<script setup lang="ts">
import dayjs  from "dayjs";
import { onUnmounted, ref } from 'vue';

const time = ref(dayjs(new Date()).format('YYYY年MM月DD日 hh:mm:ss'));

const timer = setInterval(()=>{
    time.value = dayjs(new Date()).format('YYYY年MM月DD日 hh:mm:ss');
},1000);

onUnmounted(()=>{
    timer && clearInterval(timer)
})
</script>
<style lang="less" scoped>
    .footer{
        height: 60px;
        display: flex;
        color:#fff;
        padding: 0 10px;
        line-height: 60px;

        .time{
            flex:1;
            letter-spacing: 3px;
        }
        .weather{
            flex:1;
            text-align: right;
            letter-spacing: 3px;
        }

        .menus{
            width:300px;
            display: flex;

            .menu-item{
                flex:1;
                .inner{
                    width:50px;
                    height: 50px;
                    border-radius: 50%;
                    border:1px solid #04fff9;
                    text-align: center;
                    display: flex;
                    justify-content: center;
                    justify-items: center;
                    align-items: center;
                    align-content: center;
                    box-shadow: inset 0 0 6px 2px #04fff9;
                    cursor: pointer;

                    img{
                        width: 60%;
                    }
                }
                .selected{
                    border:1px solid #04ff43;
                    box-shadow: inset 0 0 6px 2px #04ff43;
                }
                .inner:hover{
                    border:1px solid #04ff43;
                    box-shadow: inset 0 0 6px 2px #04ff43;
                }
            }
        }
    }
</style>- ChartItem.vue
javascript
<template>
    <div class="chart-item">
        <div class="title">
            <img src="@/assets/images/icon-001.png">
            <text>{{ title }}</text>
        </div>
        <slot></slot>
    </div>
</template>
<script setup lang="ts">
const props = defineProps({
    title:String
})
</script>
<style lang="less" scoped>
    .chart-item{
        margin: 10px 40px;
        .title{
            color: #04fff9;
            line-height: 30px;
            font-size: 1.2rem;

            img{
                position: relative;
                top: 3px;
                margin-right: 10px;
            }
        }
    }
</style>- main.css
css
@import './base.css';

#app {
  margin: 0 auto;
  font-weight: normal;
}

a,
.green {
  text-decoration: none;
  color: hsla(160, 100%, 37%, 1);
  transition: 0.4s;
  padding: 3px;
}

@media (hover: hover) {
  a:hover {
    background-color: hsla(160, 100%, 37%, 0.2);
  }
}

@media (min-width: 1024px) {
  body {
  }

  #app {
  }
}- base.css
css
/* color palette from <https://github.com/vuejs/theme> */
:root {
  --vt-c-white: #ffffff;
  --vt-c-white-soft: #f8f8f8;
  --vt-c-white-mute: #f2f2f2;

  --vt-c-black: #181818;
  --vt-c-black-soft: #222222;
  --vt-c-black-mute: #282828;

  --vt-c-indigo: #2c3e50;

  --vt-c-divider-light-1: rgba(60, 60, 60, 0.29);
  --vt-c-divider-light-2: rgba(60, 60, 60, 0.12);
  --vt-c-divider-dark-1: rgba(84, 84, 84, 0.65);
  --vt-c-divider-dark-2: rgba(84, 84, 84, 0.48);

  --vt-c-text-light-1: var(--vt-c-indigo);
  --vt-c-text-light-2: rgba(60, 60, 60, 0.66);
  --vt-c-text-dark-1: var(--vt-c-white);
  --vt-c-text-dark-2: rgba(235, 235, 235, 0.64);
}

/* semantic color variables for this project */
:root {
  --color-background: var(--vt-c-white);
  --color-background-soft: var(--vt-c-white-soft);
  --color-background-mute: var(--vt-c-white-mute);

  --color-border: var(--vt-c-divider-light-2);
  --color-border-hover: var(--vt-c-divider-light-1);

  --color-heading: var(--vt-c-text-light-1);
  --color-text: var(--vt-c-text-light-1);

  --section-gap: 160px;
}

@media (prefers-color-scheme: dark) {
  :root {
    --color-background: var(--vt-c-black);
    --color-background-soft: var(--vt-c-black-soft);
    --color-background-mute: var(--vt-c-black-mute);

    --color-border: var(--vt-c-divider-dark-2);
    --color-border-hover: var(--vt-c-divider-dark-1);

    --color-heading: var(--vt-c-text-dark-1);
    --color-text: var(--vt-c-text-dark-2);
  }
}

*,
*::before,
*::after {
  box-sizing: border-box;
  margin: 0;
  font-weight: normal;
}

body {
  min-height: 100vh;
  color: var(--color-text);
  background: var(--color-background);
  transition:
    color 0.5s,
    background-color 0.5s;
  line-height: 1.6;
  font-family:
    Inter,
    -apple-system,
    BlinkMacSystemFont,
    'Segoe UI',
    Roboto,
    Oxygen,
    Ubuntu,
    Cantarell,
    'Fira Sans',
    'Droid Sans',
    'Helvetica Neue',
    sans-serif;
  font-size: 15px;
  text-rendering: optimizeLegibility;
  -webkit-font-smoothing: antialiased;
  -moz-osx-font-smoothing: grayscale;
}