1.5 Openlayers调用ArcGis地图服务之要素识别(/identify)
下面使用ArcGis官方服务作为示例直接调用(如果使用自己的私有服务,可能先要获取token)
各个库版本如下:
javascript
    "ol": "^10.8.0",
    "proj4": "^2.20.8",
    "vue3-openlayers": "^12.2.2"
目录
- [1.5 要素识别【地图服务的查询接口(/identify)】](#1.5 要素识别【地图服务的查询接口(/identify)】 "#15-%E8%A6%81%E7%B4%A0%E8%AF%86%E5%88%AB%E5%9C%B0%E5%9B%BE%E6%9C%8D%E5%8A%A1%E7%9A%84%E6%9F%A5%E8%AF%A2%E6%8E%A5%E5%8F%A3identify")
- [1.5.1 介绍](#1.5.1 介绍 "#151-%E4%BB%8B%E7%BB%8D")
- [1.5.2 判断](#1.5.2 判断 "#152-%E5%88%A4%E6%96%AD")
- [1.5.3 调用](#1.5.3 调用 "#153-%E8%B0%83%E7%94%A8")
- [1.5.3.1 在线调用](#1.5.3.1 在线调用 "#1531-%E5%9C%A8%E7%BA%BF%E8%B0%83%E7%94%A8")
- [1.5.3.2 Openlayers调用](#1.5.3.2 Openlayers调用 "#1532-openlayers%E8%B0%83%E7%94%A8")
- [1.5.3.3 Vue3-Openlayers调用](#1.5.3.3 Vue3-Openlayers调用 "#1533-vue3-openlayers%E8%B0%83%E7%94%A8")
- [1.6 简单对比(/find vs /identify vs /query)](#1.6 简单对比(/find vs /identify vs /query) "#16-%E7%AE%80%E5%8D%95%E5%AF%B9%E6%AF%94find-vs-identify-vs-query")
1.5 要素识别【地图服务的查询接口(/identify)】
1.5.1 介绍
要素识别主要用给定一个点(或几何),查找该位置上的要素,是"点击查询"功能的标准实现,可跨图层
1.5.1.1 核心用法
点选识别,查询地图上某一点或某一小区域内的要素,
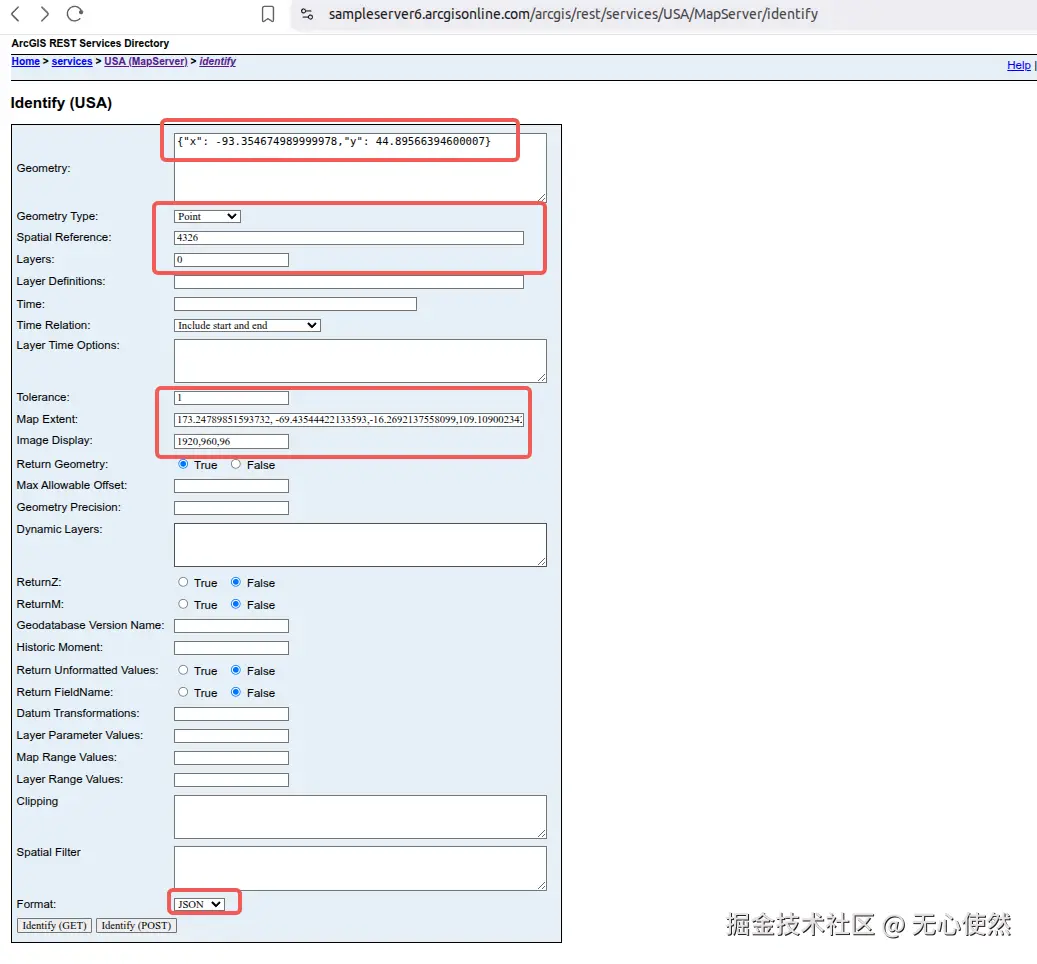
1.5.1.2 关键参数
-
geometry:要查询的点的坐标(JSON格式)。
-
geometryType:几何类型,通常为 esriGeometryPoint。
-
layers:要查询的图层,可以是 all 或特定ID。
-
tolerance:容差(像素),即点击位置周围多大范围内的要素被视为命中。
-
mapExtent:当前地图范围,用于提高查询效率。
-
ImageDisplay:描述当前地图显示窗口的屏幕参数
1.5.2 判断
在服务信息页面ArcGis官方服务3转存失败,建议直接上传图片文件
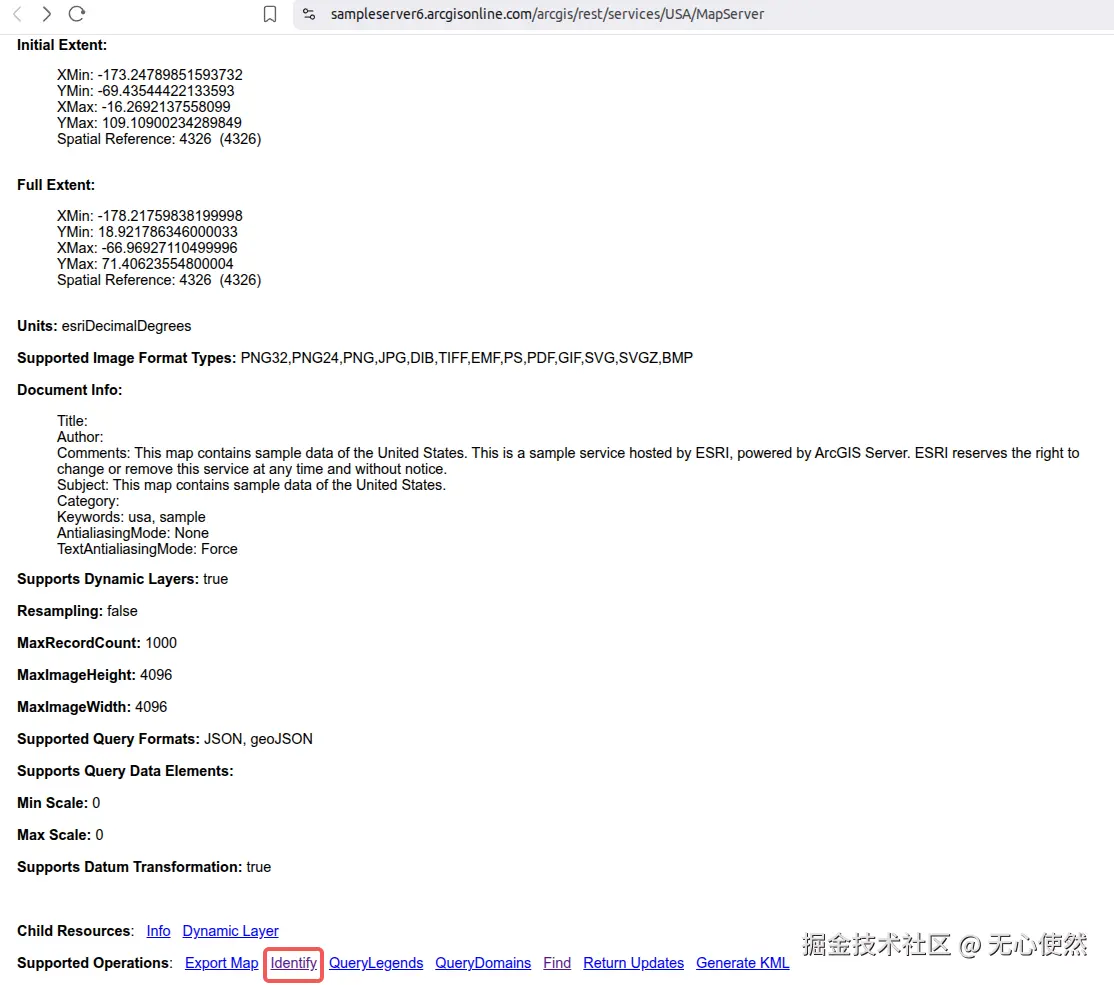
可以看到Supported Operations中有Identify可以判断支持使用identify查询要素
1.5.3 调用
1.5.3.1 在线调用
点击Identify,进入在线调用页面
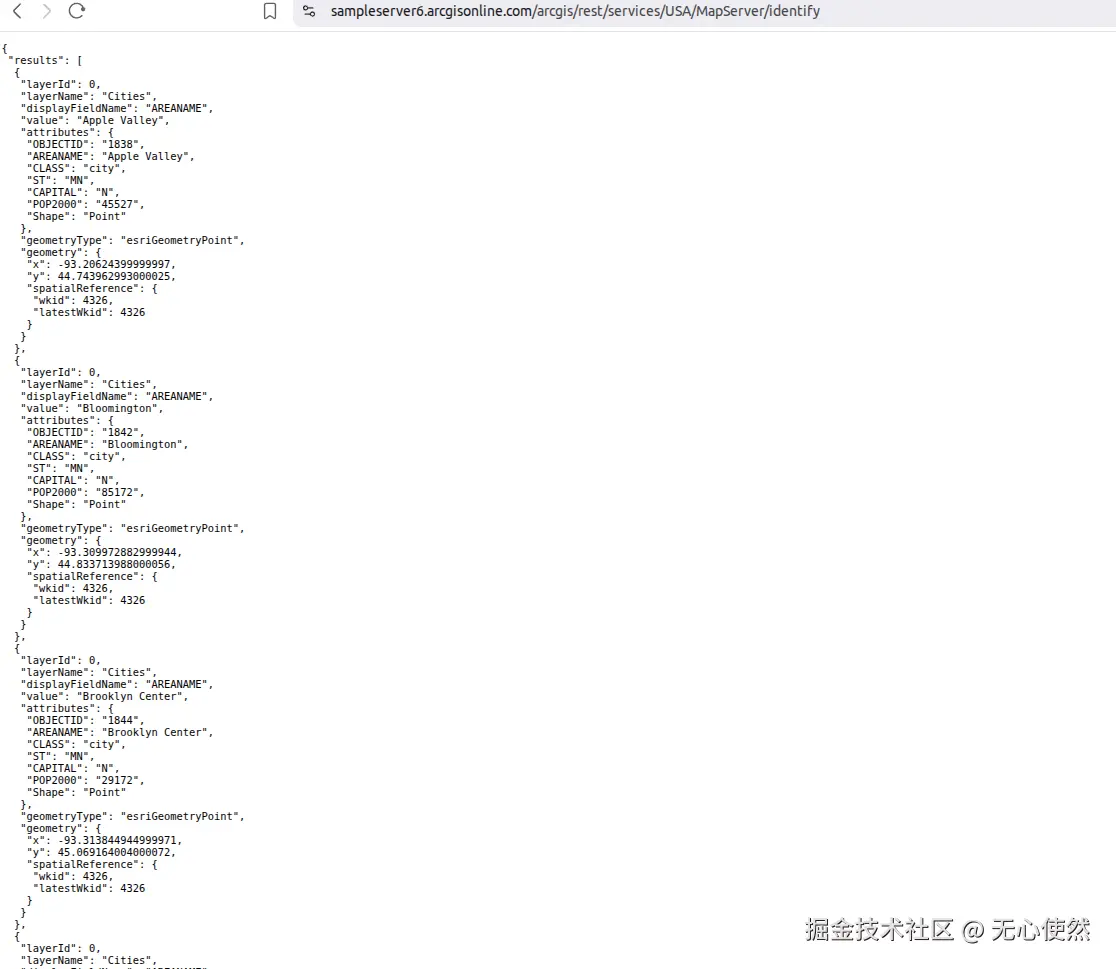
可以看到根据参数返回的要素信息
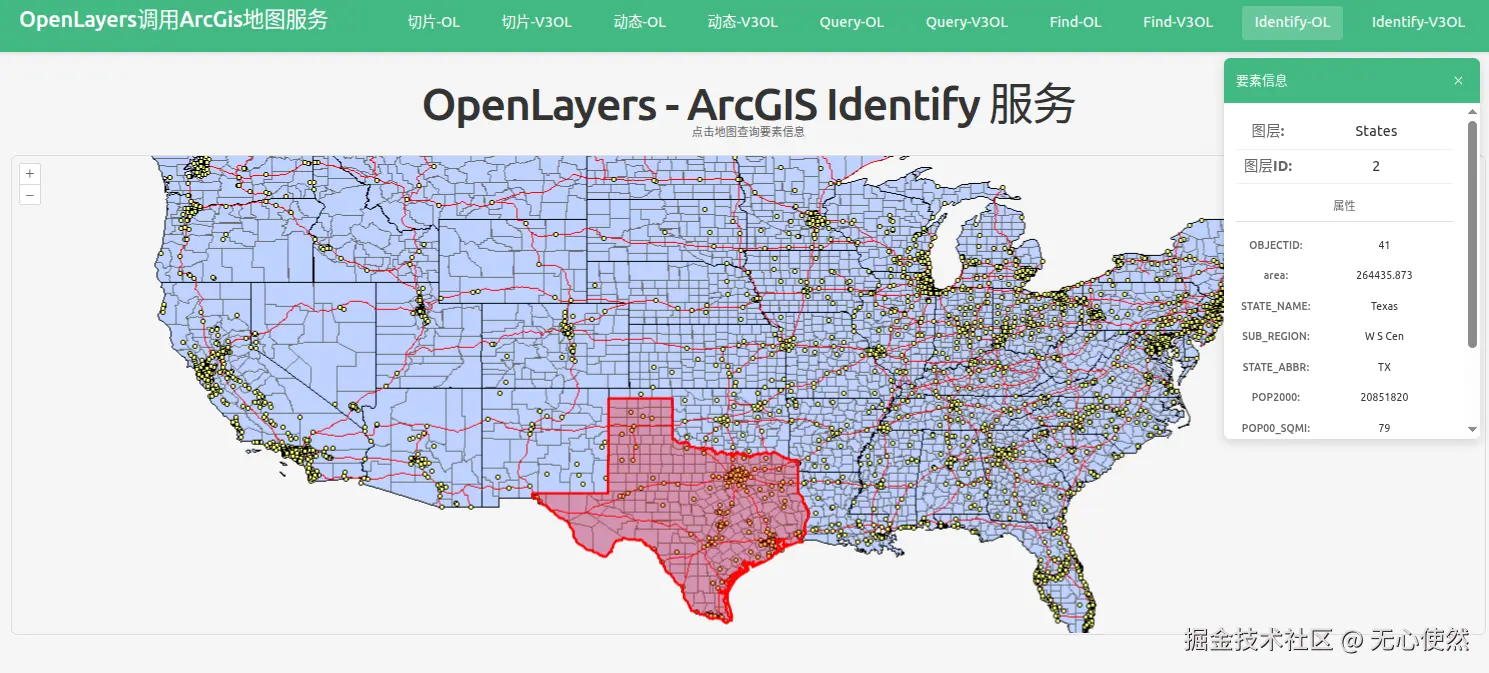
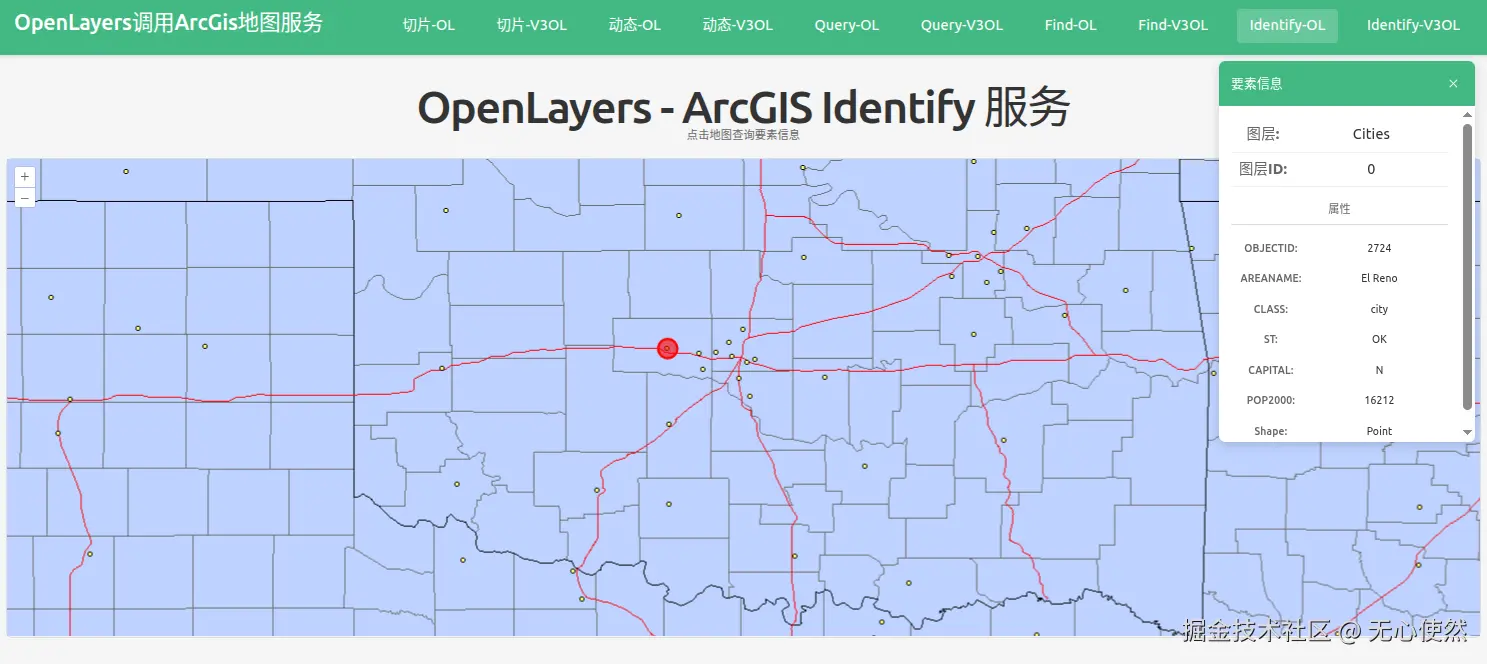
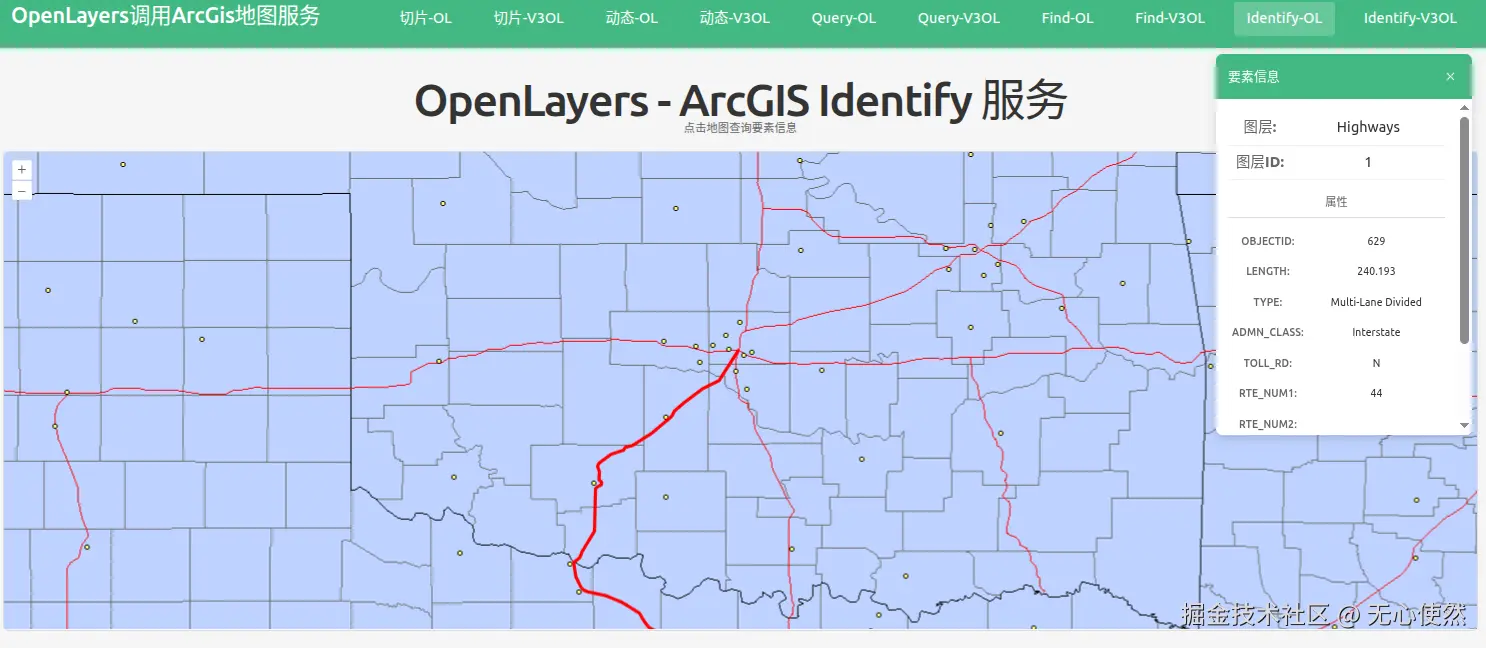
1.5.3.2 Openlayers调用
地图上点击到不同的要素,会红色高亮
javascript
<template>
<div class="map-page">
<h1>OpenLayers - ArcGIS Identify 服务</h1>
<p class="hint">点击地图查询要素信息</p>
<!-- 要素信息面板 -->
<div v-if="selectedFeature" class="info-panel">
<div class="info-header">
<h3>要素信息</h3>
<button @click="closeInfo" class="close-btn">×</button>
</div>
<div class="info-content">
<div class="info-item">
<span class="info-label">图层:</span>
<span class="info-value">{{ selectedFeature.layerName }}</span>
</div>
<div class="info-item">
<span class="info-label">图层ID:</span>
<span class="info-value">{{ selectedFeature.layerId }}</span>
</div>
<div v-if="selectedFeature.attributes" class="attributes">
<h4>属性</h4>
<div
v-for="(value, key) in selectedFeature.attributes"
:key="key"
class="attr-item"
>
<span class="attr-key">{{ key }}:</span>
<span class="attr-value">{{ value }}</span>
</div>
</div>
</div>
</div>
<div id="ol-identify-map" ref="mapContainer" class="map-container"></div>
</div>
</template>
<script setup lang="ts">
import { onMounted, onUnmounted, ref } from "vue";
import axios from "axios";
import Map from "ol/Map";
import View from "ol/View";
import VectorLayer from "ol/layer/Vector";
import VectorSource from "ol/source/Vector";
import ImageLayer from "ol/layer/Image";
import ImageArcGISRest from "ol/source/ImageArcGISRest";
import { Style, Circle, Fill, Stroke } from "ol/style";
import type { Geometry } from "ol/geom";
import Polygon from "ol/geom/Polygon";
import Feature from "ol/Feature";
import Point from "ol/geom/Point";
import LineString from "ol/geom/LineString";
const mapContainer = ref<HTMLDivElement>();
const selectedFeature = ref<any>(null);
let map: Map | null = null;
// ArcGIS MapServer 动态地图底图图层
const baseLayer = new ImageLayer({
source: new ImageArcGISRest({
ratio: 1,
params: {},
url: "https://sampleserver6.arcgisonline.com/arcgis/rest/services/USA/MapServer/export",
}),
});
const resultLayer = new VectorLayer({
source: new VectorSource(),
style: (feature) => {
const geometry = feature.getGeometry();
if (!geometry) return undefined;
const type = geometry.getType();
// 点样式
if (type === "Point") {
return new Style({
image: new Circle({
radius: 12,
fill: new Fill({ color: "rgba(255, 0, 0, 0.6)" }),
stroke: new Stroke({ color: "#FF0000", width: 3 }),
}),
});
}
// 多点样式
if (type === "MultiPoint") {
return new Style({
image: new Circle({
radius: 12,
fill: new Fill({ color: "rgba(255, 0, 0, 0.6)" }),
stroke: new Stroke({ color: "#FF0000", width: 3 }),
}),
});
}
// 线样式
if (type === "LineString") {
return new Style({
stroke: new Stroke({
color: "#FF0000",
width: 4,
}),
});
}
// 多线样式
if (type === "MultiLineString") {
return new Style({
stroke: new Stroke({
color: "#FF0000",
width: 4,
}),
});
}
// 多边形样式
if (type === "Polygon") {
return new Style({
stroke: new Stroke({
color: "#FF0000",
width: 3,
}),
fill: new Fill({
color: "rgba(255, 0, 0, 0.3)",
}),
});
}
// 多多边形样式
if (type === "MultiPolygon") {
return new Style({
stroke: new Stroke({
color: "#FF0000",
width: 3,
}),
fill: new Fill({
color: "rgba(255, 0, 0, 0.3)",
}),
});
}
return new Style({
stroke: new Stroke({ color: "#FF0000", width: 3 }),
fill: new Fill({ color: "rgba(255, 0, 0, 0.3)" }),
image: new Circle({
radius: 10,
fill: new Fill({ color: "rgba(255, 0, 0, 0.5)" }),
stroke: new Stroke({ color: "#FF0000", width: 3 }),
}),
});
},
zIndex: 1000,
});
// Identify 功能
const identify = async (coordinate: number[]) => {
try {
const formData = new FormData();
formData.append(
"geometry",
JSON.stringify({ x: coordinate[0], y: coordinate[1] }),
);
formData.append("geometryType", "esriGeometryPoint");
formData.append("sr", "4326");
formData.append("layers", "0,1,2,3");
formData.append("layerDefs", "");
formData.append("time", "");
formData.append("timeRelation", "esriTimeRelationOverlaps");
formData.append("layerTimeOptions", "");
formData.append("tolerance", "1");
formData.append(
"mapExtent",
"173.24789851593732,-69.43544422133593,-16.2692137558099,109.10900234289849",
);
formData.append("imageDisplay", "1920,960,96");
formData.append("returnGeometry", "true");
formData.append("maxAllowableOffset", "");
formData.append("geometryPrecision", "");
formData.append("dynamicLayers", "");
formData.append("returnZ", "false");
formData.append("returnM", "false");
formData.append("gdbVersion", "");
formData.append("historicMoment", "");
formData.append("returnUnformattedValues", "false");
formData.append("returnFieldName", "false");
formData.append("datumTransformations", "");
formData.append("layerParameterValues", "");
formData.append("mapRangeValues", "");
formData.append("layerRangeValues", "");
formData.append("clipping", "");
formData.append("spatialFilter", "");
formData.append("f", "pjson");
const response = await axios.post(
"https://sampleserver6.arcgisonline.com/arcgis/rest/services/USA/MapServer/identify",
formData,
);
const results = response.data.results || [];
// 清除之前的高亮
const source = resultLayer.getSource();
source?.clear();
if (results.length > 0) {
// 显示第一个结果
const result = results[0];
selectedFeature.value = {
layerName: result.layerName,
layerId: result.layerId,
attributes: result.attributes,
};
console.log("Identify result:", result);
console.log("Geometry type:", result.geometryType);
console.log("Geometry:", result.geometry);
// 高亮显示要素
if (result.geometry) {
const geometry = result.geometry;
const geometryType = result.geometryType;
if (
geometryType === "esriGeometryPoint" &&
geometry.x != null &&
geometry.y != null
) {
const feature = new Feature({
geometry: new Point([Number(geometry.x), Number(geometry.y)]),
});
source?.addFeature(feature);
console.log("Added point feature at:", [geometry.x, geometry.y]);
} else if (geometryType === "esriGeometryPolygon" && geometry.rings) {
geometry.rings.forEach((ring: number[][]) => {
const coords = ring.map((coord) => [
Number(coord[0]),
Number(coord[1]),
]);
const polygonFeature = new Feature({
geometry: new Polygon([coords]),
});
source?.addFeature(polygonFeature);
});
console.log("Added polygon features");
} else if (geometryType === "esriGeometryPolyline" && geometry.paths) {
geometry.paths.forEach((path: number[][]) => {
const coords = path.map((coord) => [
Number(coord[0]),
Number(coord[1]),
]);
const lineFeature = new Feature({
geometry: new LineString(coords),
});
source?.addFeature(lineFeature);
});
console.log("Added line features");
} else if (
geometryType === "esriGeometryMultipoint" &&
geometry.points
) {
// 处理多点几何
geometry.points.forEach((point: number[]) => {
const pointFeature = new Feature({
geometry: new Point([Number(point[0]), Number(point[1])]),
});
source?.addFeature(pointFeature);
});
console.log("Added multipoint features");
}
}
// 输出添加后的要素数量
console.log("Total features in source:", source?.getFeatures().length);
} else {
selectedFeature.value = null;
console.log("No results found");
}
} catch (err: any) {
console.error("Identify error:", err);
}
};
// 关闭信息面板
const closeInfo = () => {
selectedFeature.value = null;
const source = resultLayer.getSource();
source?.clear();
};
onMounted(() => {
// Create map
map = new Map({
target: mapContainer.value!,
layers: [baseLayer, resultLayer],
view: new View({
projection: "EPSG:4326",
center: [-98.5795, 39.8283], // USA center (lon, lat)
zoom: 4,
}),
});
// 点击事件
map.on("singleclick", (evt) => {
const coordinate = evt.coordinate;
identify(coordinate);
});
});
onUnmounted(() => {
if (map) {
map.setTarget(undefined);
map = null;
}
});
</script>
<style scoped>
.map-page {
padding: 20px;
}
h1 {
margin-bottom: 10px;
color: #333;
}
.hint {
margin-bottom: 15px;
color: #666;
font-size: 14px;
}
.info-panel {
position: absolute;
top: 80px;
right: 30px;
width: 320px;
max-height: 500px;
background: white;
border-radius: 8px;
box-shadow: 0 4px 12px rgba(0, 0, 0, 0.15);
overflow: hidden;
z-index: 1000;
}
.info-header {
display: flex;
justify-content: space-between;
align-items: center;
padding: 15px;
background-color: #42b983;
color: white;
}
.info-header h3 {
margin: 0;
font-size: 16px;
}
.close-btn {
background: none;
border: none;
color: white;
font-size: 24px;
cursor: pointer;
padding: 0;
width: 24px;
height: 24px;
line-height: 1;
}
.close-btn:hover {
opacity: 0.8;
}
.info-content {
padding: 15px;
max-height: 420px;
overflow-y: auto;
}
.info-item {
display: flex;
padding: 8px 0;
border-bottom: 1px solid #eee;
}
.info-label {
font-weight: 600;
color: #666;
min-width: 80px;
}
.info-value {
color: #333;
flex: 1;
}
.attributes h4 {
margin: 15px 0 10px 0;
font-size: 14px;
color: #666;
border-bottom: 1px solid #ddd;
padding-bottom: 5px;
}
.attr-item {
display: flex;
padding: 6px 0;
font-size: 13px;
}
.attr-key {
font-weight: 500;
color: #666;
min-width: 100px;
word-break: break-word;
}
.attr-value {
color: #333;
flex: 1;
word-break: break-word;
}
.map-container {
width: 100%;
height: 600px;
border: 2px solid #ddd;
border-radius: 8px;
background-color: #f5f5f5;
}
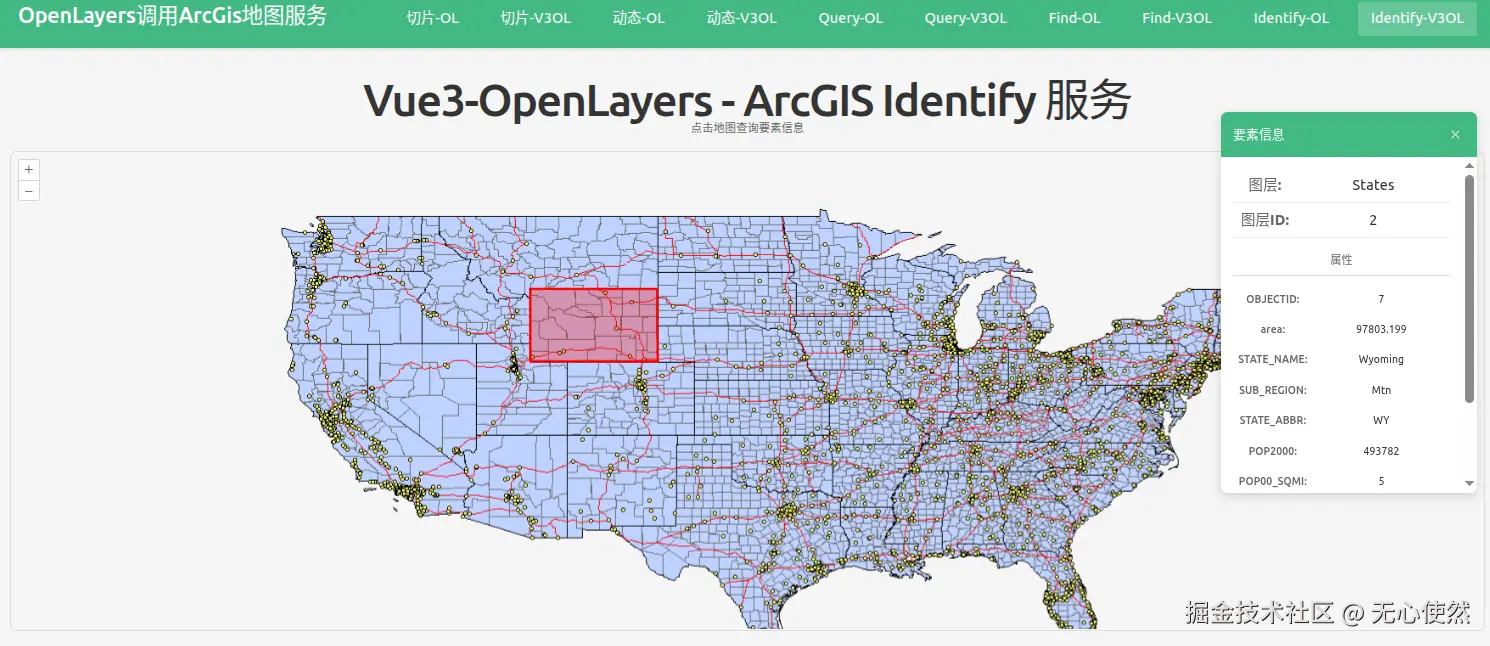
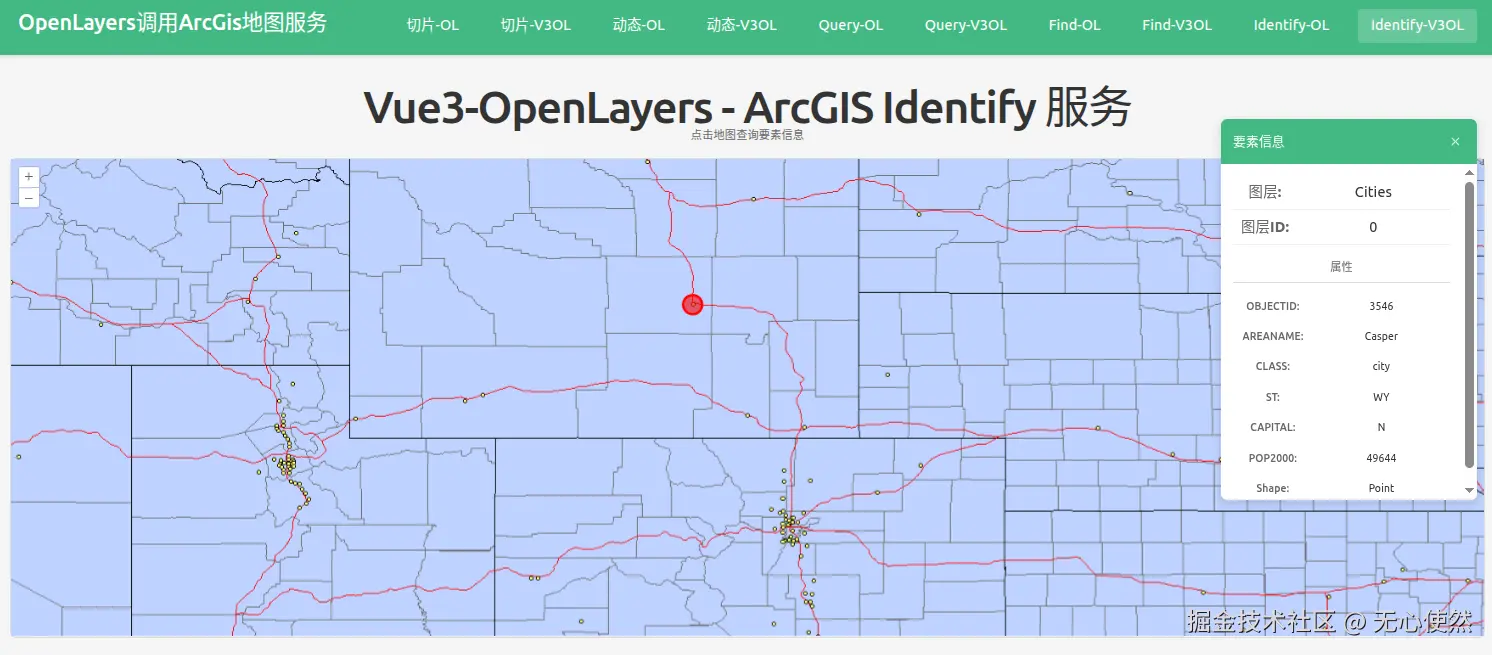
</style>1.5.3.3 Vue3-Openlayers调用
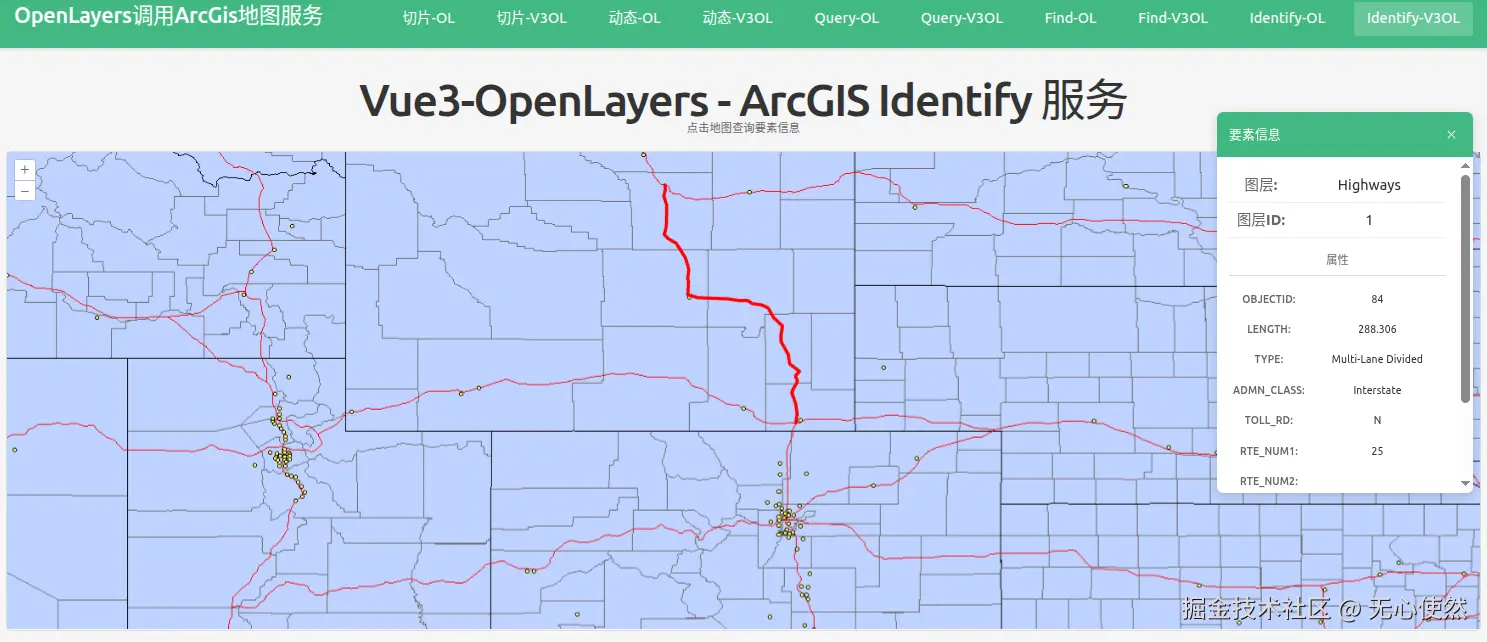
地图上点击到不同的要素,会红色高亮
javascript
<template>
  <div class="map-page">
    <h1>Vue3-OpenLayers - ArcGIS Identify 服务</h1>
    <p class="hint">点击地图查询要素信息</p>

    <!-- 要素信息面板 -->
    <div v-if="selectedFeature" class="info-panel">
      <div class="info-header">
        <h3>要素信息</h3>
        <button @click="closeInfo" class="close-btn">×</button>
      </div>
      <div class="info-content">
        <div class="info-item">
          <span class="info-label">图层:</span>
          <span class="info-value">{{ selectedFeature.layerName }}</span>
        </div>
        <div class="info-item">
          <span class="info-label">图层ID:</span>
          <span class="info-value">{{ selectedFeature.layerId }}</span>
        </div>
        <div v-if="selectedFeature.attributes" class="attributes">
          <h4>属性</h4>
          <div
            v-for="(value, key) in selectedFeature.attributes"
            :key="key"
            class="attr-item"
          >
            <span class="attr-key">{{ key }}:</span>
            <span class="attr-value">{{ value }}</span>
          </div>
        </div>
      </div>
    </div>

    <ol-map
      ref="mapRef"
      :loadTilesWhileAnimating="true"
      :loadTilesWhileInteracting="true"
      style="
        height: 600px;
        width: 100%;
        border: 2px solid #ddd;
        border-radius: 8px;
      "
      @singleclick="handleMapClick"
    >
      <ol-view
        ref="viewRef"
        :center="center"
        :zoom="4"
        :projection="projection"
      />

      <!-- ArcGIS MapServer 动态地图底图图层 -->
      <ol-tile-layer>
        <OlSourceTileArcGISRest
          url="https://sampleserver6.arcgisonline.com/arcgis/rest/services/USA/MapServer/export"
        />
      </ol-tile-layer>

      <ol-vector-layer :z-index="1000">
        <ol-source-vector ref="vectorSourceRef" />
      </ol-vector-layer>
    </ol-map>
  </div>
</template>

<script setup lang="ts">
import { ref } from "vue";
import axios from "axios";
import Point from "ol/geom/Point";
import Polygon from "ol/geom/Polygon";
import LineString from "ol/geom/LineString";
import Feature from "ol/Feature";
import type { MapBrowserEvent } from "ol";
import { Style, Circle, Fill, Stroke } from "ol/style";

const projection = "EPSG:4326";
const center = ref([-98.5795, 39.8283]); // USA center (lon, lat)
const selectedFeature = ref<any>(null);
const vectorSourceRef = ref();
const viewRef = ref();

// Identify 功能
const identify = async (coordinate: number[]) => {
  try {
    const formData = new FormData();
    formData.append(
      "geometry",
      JSON.stringify({ x: coordinate[0], y: coordinate[1] }),
    );
    formData.append("geometryType", "esriGeometryPoint");
    formData.append("sr", "4326");
    formData.append("layers", "0,1,2,3");
    formData.append("layerDefs", "");
    formData.append("time", "");
    formData.append("timeRelation", "esriTimeRelationOverlaps");
    formData.append("layerTimeOptions", "");
    formData.append("tolerance", "1");
    formData.append(
      "mapExtent",
      "173.24789851593732,-69.43544422133593,-16.2692137558099,109.10900234289849",
    );
    formData.append("imageDisplay", "1920,960,96");
    formData.append("returnGeometry", "true");
    formData.append("maxAllowableOffset", "");
    formData.append("geometryPrecision", "");
    formData.append("dynamicLayers", "");
    formData.append("returnZ", "false");
    formData.append("returnM", "false");
    formData.append("gdbVersion", "");
    formData.append("historicMoment", "");
    formData.append("returnUnformattedValues", "false");
    formData.append("returnFieldName", "false");
    formData.append("datumTransformations", "");
    formData.append("layerParameterValues", "");
    formData.append("mapRangeValues", "");
    formData.append("layerRangeValues", "");
    formData.append("clipping", "");
    formData.append("spatialFilter", "");
    formData.append("f", "pjson");

    const response = await axios.post(
      "https://sampleserver6.arcgisonline.com/arcgis/rest/services/USA/MapServer/identify",
      formData,
    );

    const results = response.data.results || [];

    // 清除之前的高亮
    const source = vectorSourceRef.value?.source;
    if (source) {
      source.clear();
    }

    if (results.length > 0) {
      // 显示第一个结果
      const result = results[0];
      selectedFeature.value = {
        layerName: result.layerName,
        layerId: result.layerId,
        attributes: result.attributes,
      };

      console.log("Identify result:", result);
      console.log("Geometry type:", result.geometryType);
      console.log("Geometry:", result.geometry);

      // 高亮显示要素
      if (result.geometry) {
        const geometry = result.geometry;
        const geometryType = result.geometryType;

        const features: Feature[] = [];

        if (
          geometryType === "esriGeometryPoint" &&
          geometry.x != null &&
          geometry.y != null
        ) {
          const pointFeature = new Feature({
            geometry: new Point([Number(geometry.x), Number(geometry.y)]),
          });
          features.push(pointFeature);
          console.log("Added point feature at:", [geometry.x, geometry.y]);
        } else if (geometryType === "esriGeometryPolygon" && geometry.rings) {
          geometry.rings.forEach((ring: number[][]) => {
            const coords = ring.map((coord) => [
              Number(coord[0]),
              Number(coord[1]),
            ]);
            const polygonFeature = new Feature({
              geometry: new Polygon([coords]),
            });
            features.push(polygonFeature);
          });
          console.log("Added polygon features");
        } else if (geometryType === "esriGeometryPolyline" && geometry.paths) {
          geometry.paths.forEach((path: number[][]) => {
            const coords = path.map((coord) => [
              Number(coord[0]),
              Number(coord[1]),
            ]);
            const lineFeature = new Feature({
              geometry: new LineString(coords),
            });
            features.push(lineFeature);
          });
          console.log("Added line features");
        } else if (
          geometryType === "esriGeometryMultipoint" &&
          geometry.points
        ) {
          // 处理多点几何
          geometry.points.forEach((point: number[]) => {
            const pointFeature = new Feature({
              geometry: new Point([Number(point[0]), Number(point[1])]),
            });
            features.push(pointFeature);
          });
          console.log("Added multipoint features");
        }

        // 为每个要素设置样式
        features.forEach(setFeatureStyle);

        if (source) {
          source.addFeatures(features);
        }

        console.log("Total features in source:", source.getFeatures().length);
      }
    } else {
      selectedFeature.value = null;
      console.log("No results found");
    }
  } catch (err: any) {
    console.error("Identify error:", err);
  }
};

// 处理地图点击
const handleMapClick = (event: MapBrowserEvent<any>) => {
  const coordinate = event.coordinate;
  identify(coordinate);
};

// 关闭信息面板
const closeInfo = () => {
  selectedFeature.value = null;
  const source = vectorSourceRef.value?.source;
  if (source) {
    source.clear();
  }
};

// 为要素设置样式的函数
const setFeatureStyle = (feature: Feature) => {
  const geometry = feature.getGeometry();
  if (!geometry) return;

  const type = geometry.getType();

  // 点样式
  if (type === "Point") {
    feature.setStyle(
      new Style({
        image: new Circle({
          radius: 12,
          fill: new Fill({ color: "rgba(255, 0, 0, 0.6)" }),
          stroke: new Stroke({ color: "#FF0000", width: 3 }),
        }),
      }),
    );
  }
  // 多点样式
  else if (type === "MultiPoint") {
    feature.setStyle(
      new Style({
        image: new Circle({
          radius: 12,
          fill: new Fill({ color: "rgba(255, 0, 0, 0.6)" }),
          stroke: new Stroke({ color: "#FF0000", width: 3 }),
        }),
      }),
    );
  }
  // 线样式
  else if (type === "LineString" || type === "MultiLineString") {
    feature.setStyle(
      new Style({
        stroke: new Stroke({
          color: "#FF0000",
          width: 4,
        }),
      }),
    );
  }
  // 多边形样式
  else if (type === "Polygon" || type === "MultiPolygon") {
    feature.setStyle(
      new Style({
        stroke: new Stroke({
          color: "#FF0000",
          width: 3,
        }),
        fill: new Fill({
          color: "rgba(255, 0, 0, 0.3)",
        }),
      }),
    );
  }
};
</script>

<style scoped>
.map-page {
  padding: 20px;
  position: relative;
}

h1 {
  margin-bottom: 10px;
  color: #333;
}

.hint {
  margin-bottom: 15px;
  color: #666;
  font-size: 14px;
}

.info-panel {
  position: absolute;
  top: 80px;
  right: 30px;
  width: 320px;
  max-height: 500px;
  background: white;
  border-radius: 8px;
  box-shadow: 0 4px 12px rgba(0, 0, 0, 0.15);
  overflow: hidden;
  z-index: 1000;
}

.info-header {
  display: flex;
  justify-content: space-between;
  align-items: center;
  padding: 15px;
  background-color: #42b983;
  color: white;
}

.info-header h3 {
  margin: 0;
  font-size: 16px;
}

.close-btn {
  background: none;
  border: none;
  color: white;
  font-size: 24px;
  cursor: pointer;
  padding: 0;
  width: 24px;
  height: 24px;
  line-height: 1;
}

.close-btn:hover {
  opacity: 0.8;
}

.info-content {
  padding: 15px;
  max-height: 420px;
  overflow-y: auto;
}

.info-item {
  display: flex;
  padding: 8px 0;
  border-bottom: 1px solid #eee;
}

.info-label {
  font-weight: 600;
  color: #666;
  min-width: 80px;
}

.info-value {
  color: #333;
  flex: 1;
}

.attributes h4 {
  margin: 15px 0 10px 0;
  font-size: 14px;
  color: #666;
  border-bottom: 1px solid #ddd;
  padding-bottom: 5px;
}

.attr-item {
  display: flex;
  padding: 6px 0;
  font-size: 13px;
}

.attr-key {
  font-weight: 500;
  color: #666;
  min-width: 100px;
  word-break: break-word;
}

.attr-value {
  color: #333;
  flex: 1;
  word-break: break-word;
}
</style>
1.6 简单对比(/find vs /identify vs /query)
| 特性 | /find (查找) | /identify (识别) | /query (查询) |
|---|---|---|---|
| 核心功能 | 文本匹配,在多个图层的多个字段中查找关键词 | 点选识别,查询地图上某一点或某一小区域内的要素 结构化查询,支持复杂的属性、空间及统计分析 | |
| 主要场景 | 实现"搜索框"功能,例如按名称、代码模糊搜索地物 | 实现"点击查询"功能,例如点击地图查看该位置的POI信息 | 实现"条件筛选"、"分类统计"、"空间分析"等功能 |
| 空间过滤 | 不支持 | 支持,以点或小范围几何作为过滤条件 | 支持,功能强大且灵活 |
| 跨图层 | 支持,一次可搜索多个图层 | 支持,可指定一个或多个图层 | 不支持,一次只能查询单个图层 |
简单来说:
-
想要一个类似百度地图的搜索框?用 /find。
-
想要实现点击地图查看信息?用 /identify。
-
想要做复杂的条件筛选、统计或空间分析?用 /query