线形竞赛图(Line Chart)是一种常用的图表类型,用于显示数据随时间或其他连续变量的变化趋势。它通过将数据点连接成一条线,直观地展示数据的走势和模式。
特点:
- 时间序列分析:线形竞赛图非常适合展示时间序列数据,例如股票价格、气温变化等。
- 趋势识别:通过观察线条的上升或下降,可以快速识别数据的趋势。
- 多系列比较:可以在同一图表中绘制多条线,以便比较不同数据集之间的关系。
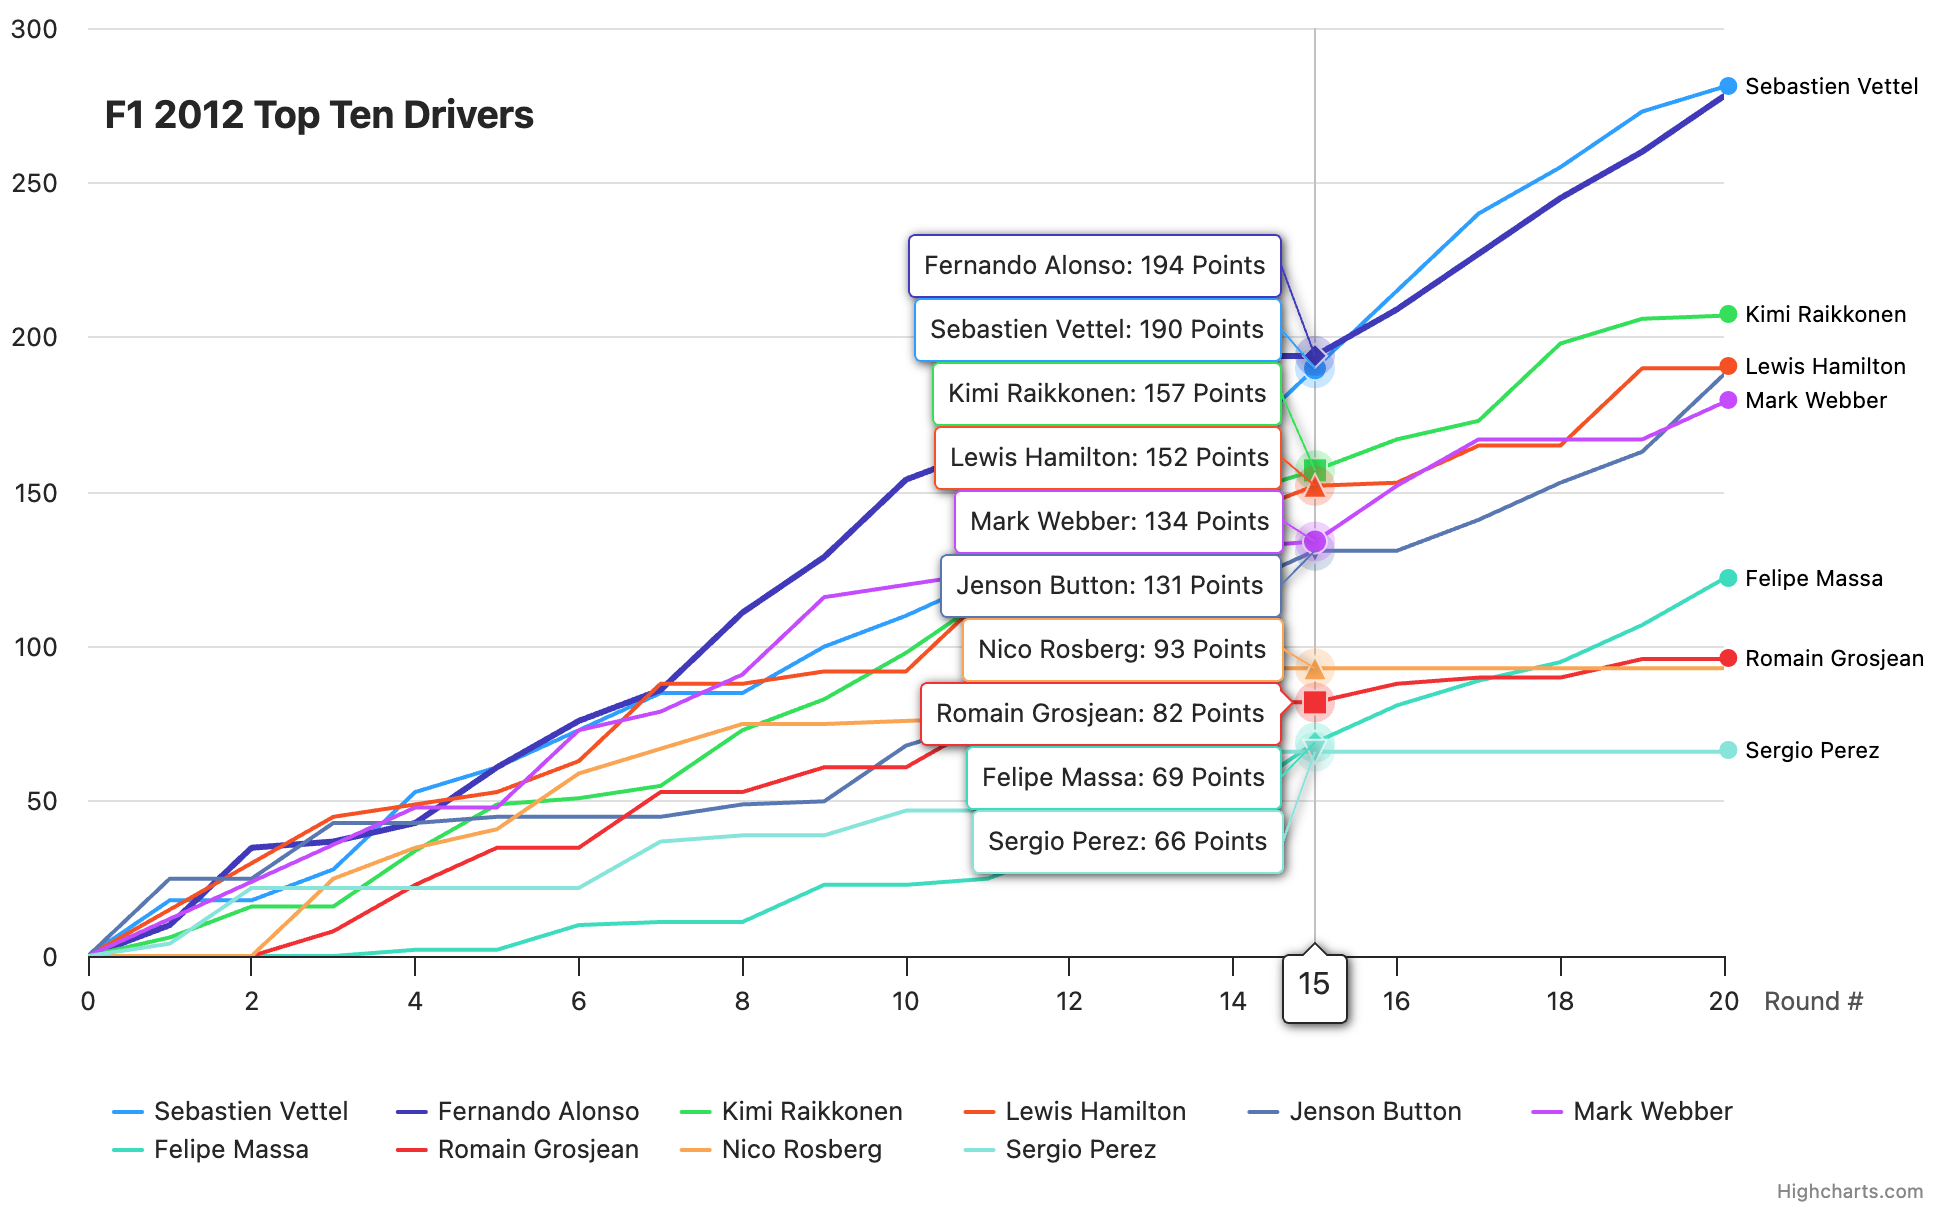
竞赛图表
示例代码:
javascript
const btn = document.getElementById('play-pause-button'),
    input = document.getElementById('play-range'),
    startRound = 0,
    endRound = 20,
    animationDuration = 1000;

// General helper functions
const arrToAssociative = arr => {
    const tmp = {};
    arr.forEach(item => {
        tmp[item[0]] = item[1];
    });

    return tmp;
};

const formatPoints = [];

const chart = Highcharts.chart('container', {
    chart: {
        type: 'line',
        marginRight: 110,
        animation: {
            duration: animationDuration,
            easing: t => t
        }
    },
    title: {
        text: 'F1 2012 Top Ten Drivers',
        floating: true,
        align: 'left',
        x: 70,
        y: 50
    },
    data: {
        csv: document.getElementById('csv').innerText,
        itemDelimiter: '\t',
        complete: function (options) {
            // Store the data for later use, and remove it from the series
            for (let i = 0; i < options.series.length; i++) {
                formatPoints[i] = arrToAssociative(options.series[i].data);
                options.series[i].data = null;
            }
        }
    },
    xAxis: {
        allowDecimals: false,
        min: startRound,
        max: endRound,
        title: {
            text: 'Round #',
            align: 'high',
            textAlign: 'left',
            x: 20,
            y: -20
        }
    },
    yAxis: {
        reversedStacks: false,
        max: 300,
        title: {
            text: 'Points'
        }
    },
    tooltip: {
        split: true,
        headerFormat: '<span style="font-size: 1.2em">{point.x}</span>',
        pointFormat: '{series.name}: {point.y} Points',
        crosshairs: true
    },
    plotOptions: {
        line: {
            animation: false,
            pointStart: startRound,
            marker: {
                enabled: false
            }
        }
    },
    annotations: [
        {
            crop: false,
            labelOptions: {
                borderWidth: 0,
                backgroundColor: undefined,
                align: 'left',
                verticalAlign: 'middle',
                overflow: 'allow',
                style: {
                    pointerEvents: 'none',
                    transition: 'opacity 0.5s'
                },
                x: -8,
                y: -1
            },
            labels: new Array(10).fill({
                text: 0,
                point: {
                    x: 0,
                    xAxis: 0,
                    y: 0,
                    yAxis: 0
                }
            })
        }
    ],

    responsive: {
        rules: [
            {
                condition: {
                    maxWidth: 500
                },
                chartOptions: {
                    chart: {
                        marginTop: 80
                    },
                    title: {
                        floating: false,
                        x: 0,
                        y: 20
                    },
                    yAxis: {
                        labels: {
                            align: 'left',
                            x: 0,
                            y: -3
                        },
                        tickLength: 0,
                        title: {
                            align: 'high',
                            reserveSpace: false,
                            rotation: 0,
                            textAlign: 'left',
                            y: -20
                        }
                    }
                }
            }
        ]
    }
});

function pause(button) {
    button.title = 'play';
    button.className = 'fa fa-play';
    clearTimeout(chart.sequenceTimer);
    chart.sequenceTimer = undefined;
}

function update(sliderClicked) {

    const series = chart.series,
        labels = chart.annotations[0].labels,
        yearIndex = input.value - startRound,
        dataLength = series[0].options.data.length;

    // If slider moved back in time
    if (yearIndex < dataLength - 1) {
        for (let i = 0; i < series.length; i++) {
            const seriesData = series[i].options.data.slice(0, yearIndex);
            series[i].setData(seriesData, false);
        }
    }

    // If slider moved forward in time
    if (yearIndex > dataLength - 1) {
        const remainingYears = yearIndex - dataLength;
        for (let i = 0; i < series.length; i++) {
            for (let j = input.value - remainingYears; j < input.value; j++) {
                series[i].addPoint([formatPoints[i][j]], false);
            }
        }
    }

    const nextnums = [];
    // Add current year if applicable, and update labels
    for (let i = 0; i < series.length; i++) {
        const newY = formatPoints[i][input.value];
        labels[i].options.point.x = yearIndex;
        labels[i].options.point.y = newY;

        if (yearIndex === 0) {
            labels[i].options.text =
                `<span style="color:${series[i].color}">●</span>
                ${series[i].name}</span>`;
        }
        nextnums.push(newY);
        if (series[i].options.data.length <= yearIndex) {
            series[i].addPoint(newY, false);
        }
    }

    if (sliderClicked) {
        chart.redraw(false);
    } else {
        chart.redraw();
    }

    input.value = parseInt(input.value, 10) + 1;

    if (input.value > endRound) {
        // Auto-pause
        pause(btn);
    }
}

function play(button) {
    // Reset slider at the end
    if (input.value > endRound) {
        input.value = startRound;
    }
    button.title = 'pause';
    button.className = 'fa fa-pause';
    chart.sequenceTimer = setInterval(function () {
        update(false);
    }, animationDuration);
}

btn.addEventListener('click', function () {
    if (chart.sequenceTimer) {
        pause(this);
    } else {
        play(this);
    }
});

update(true); // Move to initial position
update(false); // Animate to the first point immediately
play(btn); // Start the animation

// Trigger the update on the range bar click.
input.addEventListener('click', function () {
    update(true);
});
// Stop animation when clicking and dragging range bar
input.addEventListener('input', function () {
    pause(btn);
    update(true);
});