
文章目录
- [基础示例: s u r f surf surf + 三向等高线投影](#基础示例: s u r f surf surf + 三向等高线投影)
- [进阶示例:剖面切割 + 自定义配色](#进阶示例:剖面切割 + 自定义配色)
- [高级示例:2×2 多子图组合](#高级示例:2×2 多子图组合)
- 常见问题与技巧
基础示例: s u r f surf surf + 三向等高线投影
matlab
%% 示例1:三维曲面 + XY/XZ/YZ 三方向投影
clc; clear; close all;
rng(0);

%% 生成数据
[X, Y] = meshgrid(linspace(-3, 3, 80));
Z = peaks(X, Y);           % MATLAB内置peaks函数,经典测试曲面

%% 基本范围
xMin = min(X(:));
xMax = max(X(:));
yMin = min(Y(:));
yMax = max(Y(:));
zMin = min(Z(:));
zMax = max(Z(:));

% 三个投影平面的位置
zPlane = zMin - 1.5;       % XY底面投影位置
yPlane = yMax + 0.8;       % XZ侧面投影位置
xPlane = xMin - 0.8;       % YZ侧面投影位置

%% 创建图窗
figure('Color', 'w', 'Position', [100, 100, 900, 700]);
ax = axes;
hold(ax, 'on');

%% 绘制三维曲面主体
hSurf = surf(ax, X, Y, Z, ...
    'EdgeColor', 'none', ...
    'FaceAlpha', 0.88);

colormap(ax, parula);

%% XY底面投影
surf(ax, X, Y, zPlane * ones(size(Z)), Z, ...
    'EdgeColor', 'none', ...
    'FaceAlpha', 0.85);

%% XZ侧面投影
% 将曲面沿Y方向投影到 y = yPlane 的侧面
surf(ax, X, yPlane * ones(size(Y)), Z, Z, ...
    'EdgeColor', 'none', ...
    'FaceAlpha', 0.75);

%% YZ侧面投影
% 将曲面沿X方向投影到 x = xPlane 的侧面
surf(ax, xPlane * ones(size(X)), Y, Z, Z, ...
    'EdgeColor', 'none', ...
    'FaceAlpha', 0.75);

%% 叠加三向等高线投影
levelNum = 14;
levels = linspace(zMin, zMax, levelNum);

% 使用 contourc 获取二维等高线数据
C = contourc(X(1, :), Y(:, 1), Z, levels);

k = 1;
while k < size(C, 2)
    levelValue = C(1, k);      % 当前等高线对应的Z值
    pointNum = C(2, k);        % 当前等高线点数

    idx = k + 1 : k + pointNum;
    xLine = C(1, idx);
    yLine = C(2, idx);

    % XY底面等高线投影
    plot3(ax, xLine, yLine, zPlane * ones(size(xLine)), ...
        'k-', 'LineWidth', 0.45);

    % XZ侧面等高线投影
    plot3(ax, xLine, yPlane * ones(size(xLine)), levelValue * ones(size(xLine)), ...
        'k-', 'LineWidth', 0.45);

    % YZ侧面等高线投影
    plot3(ax, xPlane * ones(size(yLine)), yLine, levelValue * ones(size(yLine)), ...
        'k-', 'LineWidth', 0.45);

    k = k + pointNum + 1;
end

%% 光照设置
lighting gouraud;
material([0.3, 0.7, 0.4, 10, 0.3]);
light('Position', [3, -3, 6], 'Style', 'infinite');

%% 坐标轴与外观
colorbar('Location', 'eastoutside');

xlabel('X 轴', 'FontSize', 11, 'FontWeight', 'bold');
ylabel('Y 轴', 'FontSize', 11, 'FontWeight', 'bold');
zlabel('Z 值', 'FontSize', 11, 'FontWeight', 'bold');

title('三维曲面 + 三向等高线投影', ...
    'FontSize', 13, ...
    'FontWeight', 'bold');

view([-38, 28]);

xlim([xPlane, xMax]);
ylim([yMin, yPlane]);
zlim([zPlane, zMax]);

grid on;
box on;

set(ax, ...
    'FontSize', 10, ...
    'LineWidth', 1.0, ...
    'GridAlpha', 0.25, ...
    'Projection', 'perspective');

%% 添加说明文字
text(xMax, yPlane, zMax, 'XZ投影', ...
    'FontSize', 10, ...
    'FontWeight', 'bold', ...
    'HorizontalAlignment', 'right');

text(xPlane, yMin, zMax, 'YZ投影', ...
    'FontSize', 10, ...
    'FontWeight', 'bold');

text(xMax, yMin, zPlane, 'XY投影', ...
    'FontSize', 10, ...
    'FontWeight', 'bold');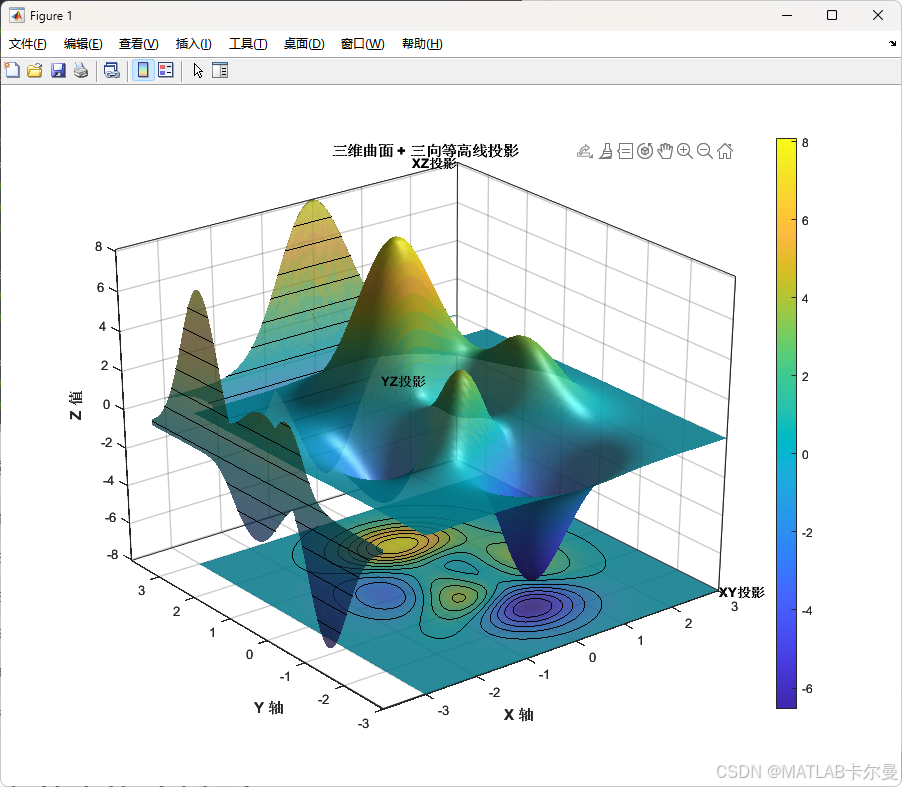
关键函数速查:
| 功能 | 函数 / 参数 |
|---|---|
| 底面投影 | contourf(..., 'ZLocation', zMin) |
| 侧面投影 | contour(..., 'YLocation', yMax) |
| 去除网格线 | surf(..., 'EdgeColor', 'none') |
| 透明度 | surf(..., 'FaceAlpha', 0.85) |
| 光照模型 | lighting gouraud + light(...) |
进阶示例:剖面切割 + 自定义配色
matlab
%% 示例2:三维曲面 + 剖面线切割 + 渐变配色
clc; clear; close all;
rng(0);

[X, Y] = meshgrid(linspace(-4, 4, 100));
Z = sin(sqrt(X.^2 + Y.^2)) ./ (sqrt(X.^2 + Y.^2) + 0.5);  % 径向sinc函数

figure('Color', 'w', 'Position', [100, 80, 1000, 720]);

% --- ① 主曲面 ---
ax = axes('Position', [0.08, 0.12, 0.78, 0.80]);
hold on;

hSurf = surf(X, Y, Z);
hSurf.EdgeColor  = 'none';
hSurf.FaceAlpha  = 0.82;

% 自定义颜色映射:蓝→绿→黄→红
nColors = 256;
cmap = [linspace(0.0, 0.9, nColors)', ...
        linspace(0.4, 0.9, nColors)', ...
        linspace(0.9, 0.1, nColors)'];
colormap(ax, cmap);

% --- ② 底面等高线(填充) ---
zFloor = min(Z(:)) - 0.15;
[~, hC] = contourf(X, Y, Z, 20, 'ZLocation', zFloor);
hC.LineColor = 'none';

% --- ③ X=0 和 Y=0 两个剖切平面 ---
% X=0 剖面
xSlice = 0;
[~, ix] = min(abs(X(1,:) - xSlice));
zSlice_x = Z(:, ix);
ySlice   = Y(:, ix);
fill3(xSlice * ones(size(ySlice)), ySlice, zSlice_x, ...
      zSlice_x, 'EdgeColor', 'none', 'FaceAlpha', 0.6);  % 着色剖面

% 剖面轮廓线(白色加粗)
plot3(xSlice * ones(size(ySlice)), ySlice, zSlice_x, ...
      'w-', 'LineWidth', 1.8);

% Y=0 剖面
ySlice2 = 0;
[~, iy] = min(abs(Y(:,1) - ySlice2));
zSlice_y = Z(iy, :);
xSlice_v = X(iy, :);
fill3(xSlice_v, ySlice2 * ones(size(xSlice_v)), zSlice_y, ...
      zSlice_y, 'EdgeColor', 'none', 'FaceAlpha', 0.6);
plot3(xSlice_v, ySlice2 * ones(size(xSlice_v)), zSlice_y, ...
      'w-', 'LineWidth', 1.8);

% --- ④ 光照 ---
lighting phong;
material([0.25, 0.75, 0.5, 12, 0.2]);
light('Position', [5, 5, 10]);
light('Position', [-5, -5, 5], 'Color', [0.4, 0.4, 0.6]);  % 补光

% --- ⑤ 外观 ---
cb = colorbar('Location', 'eastoutside');
cb.Label.String   = 'Z 值';
cb.Label.FontSize = 10;
xlabel('X', 'FontSize', 11);
ylabel('Y', 'FontSize', 11);
zlabel('Z', 'FontSize', 11);
title('径向 sinc 曲面 + 剖面切割', 'FontSize', 13, 'FontWeight', 'bold');
view([-42, 32]);
axis tight;
xlim([-4.5, 4.5]);
ylim([-4.5, 4.5]);
grid on;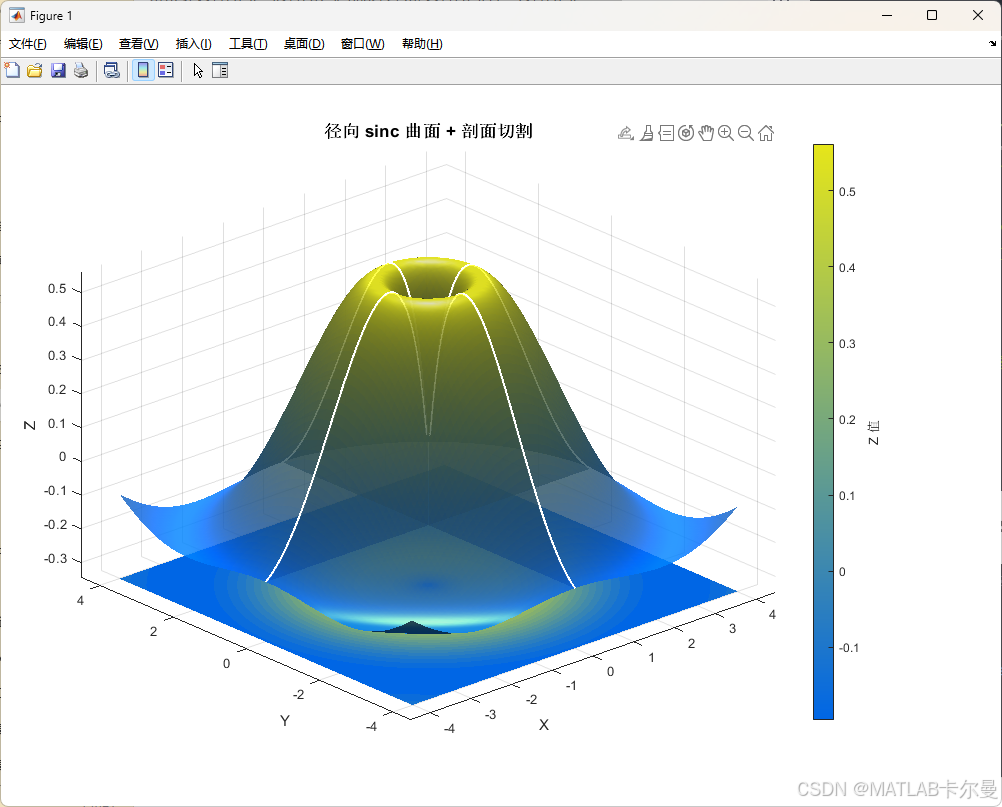
高级示例:2×2 多子图组合
matlab
%% 示例3:同一数据,四种视角/映射方式并列
clc; clear; close all;
rng(0);

[X, Y] = meshgrid(linspace(-3, 3, 70));
Z = peaks(X, Y);
zMin = min(Z(:));
zMax = max(Z(:));

figure('Color', 'w', 'Position', [80, 60, 1100, 850]);
tl = tiledlayout(2, 2, 'TileSpacing', 'compact', 'Padding', 'compact');
title(tl, '三维曲面多角度映射组合', 'FontSize', 14, 'FontWeight', 'bold');

% ---------- 子图①:经典斜视图 ----------
ax1 = nexttile;
surf(X, Y, Z, 'EdgeColor', 'none');
hold on;
contourf(X, Y, Z, 16, 'ZLocation', zMin - 1.2);
colormap(ax1, parula);
lighting gouraud; material dull;
light('Position', [3, -3, 5]);
view(-40, 30); axis tight; grid on;
title('① 斜视图 + 底面投影', 'FontSize', 10);

% ---------- 子图②:俯视图(纯等高线映射) ----------
ax2 = nexttile;
contourf(X, Y, Z, 24);
colormap(ax2, cool);
colorbar;
axis equal tight;
title('② 俯视等高线图(XY 映射)', 'FontSize', 10);
xlabel('X'); ylabel('Y');

% ---------- 子图③:透明曲面 + 等值面示意 ----------
ax3 = nexttile;
hS = surf(X, Y, Z);
hS.EdgeColor  = 'none';
hS.FaceAlpha  = 0.55;         % 半透明曲面,可透视内部
colormap(ax3, turbo);
hold on;
% 叠加网格线(稀疏,用于透视参考)
hS2 = surf(X(1:4:end, 1:4:end), Y(1:4:end, 1:4:end), Z(1:4:end, 1:4:end));
hS2.FaceAlpha = 0;
hS2.EdgeColor = [0.6, 0.6, 0.6];
hS2.EdgeAlpha = 0.4;
lighting gouraud; light('Position', [0, 0, 10]);
view(-50, 28); axis tight; grid on;
title('③ 半透明曲面 + 参考网格', 'FontSize', 10);

% ---------- 子图④:正射视图(三视图风格) ----------
ax4 = nexttile;
surf(X, Y, Z, 'EdgeColor', 'none');
colormap(ax4, hot);
hold on;
% 添加三向轮廓线
xMax = max(X(:)); yMin = min(Y(:));
contour3(X, Y, Z, 20, 'LineWidth', 0.6, 'LineColor', [0.3 0.3 0.3]);
view(0, 90);                  % 完全俯视
axis tight; colorbar;
title('④ 垂直俯视(带高度色彩)', 'FontSize', 10);
xlabel('X'); ylabel('Y');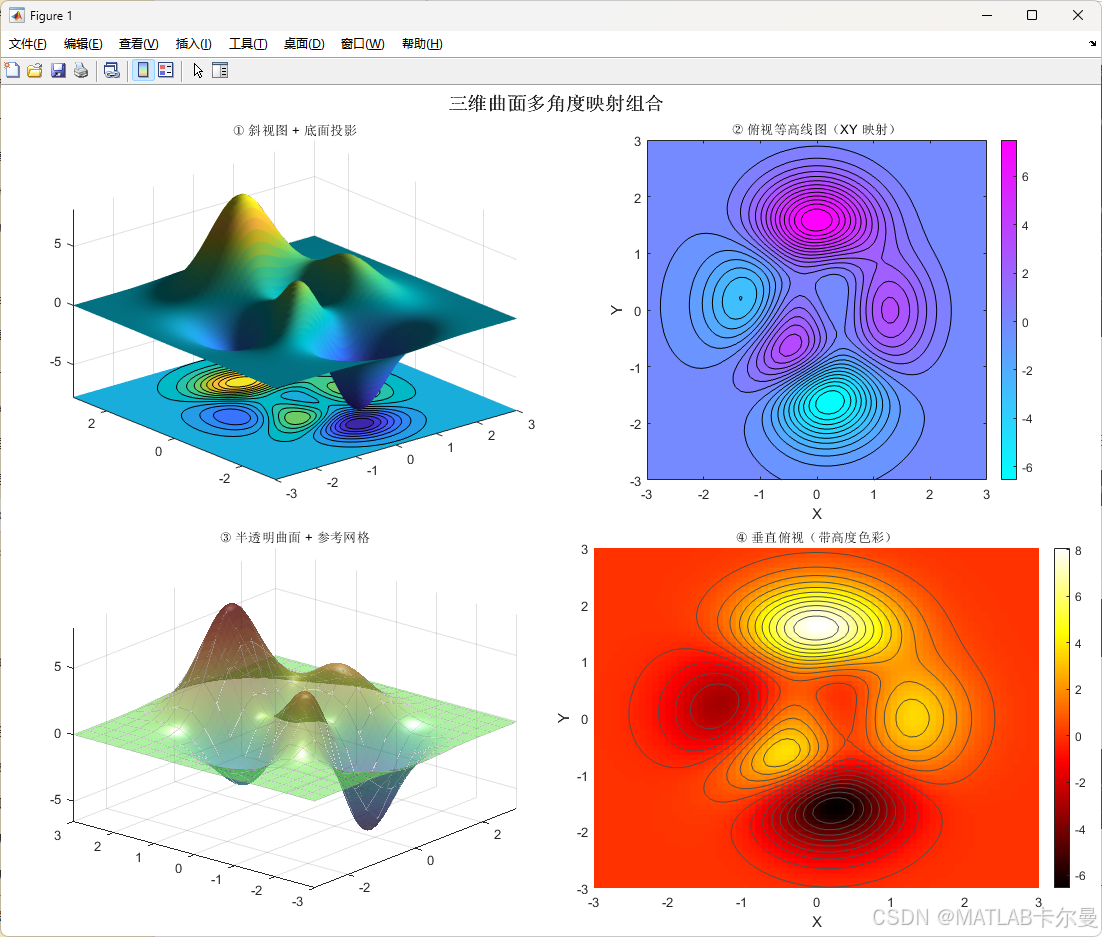
常见问题与技巧
① 投影与曲面重叠?
通过偏移 ZLocation 值让等高线低于曲面最小值即可:
matlab
contourf(X, Y, Z, 'ZLocation', min(Z(:)) - 0.5);② 配色与曲面脱钩?
多子图中每个 axes 要单独指定 colormap,否则会共享最后一次设置:
matlab
colormap(ax1, parula);
colormap(ax2, cool);
③ 光照没有效果?
lighting 只对 surf/patch 对象生效,必须在 light() 调用之后才有效:
matlab
surf(...);
lighting gouraud;    % ← 先设置模型
light('Position', [3, 3, 5]);  % ← 再放光源
④ 剖面颜色与主曲面一致?
fill3 的第四个参数传入 Z Z Z值数组,再与主曲面共用同一 colormap 即可自动对齐颜色。