前言:
介绍:
Canvas(画布) 是 HTML5 提供的原生绘图标签 ,它本身只是一个空白的矩形容器,没有任何视觉效果 ,需要通过 JavaScript 动态绘制图形、图像、动画、视频等所有视觉内容。
在学习 gsap 的时候看到了关于canvas的内容,但我之前仅作过初略的了解,并没有深入,想要深入了解一下,故本周开始学习canvas。本篇博客内容并不全面,后续学习之后会逐渐更新。
核心特点:
- 位图渲染:绘制的是像素点,放大后会模糊(和 SVG 矢量图相反);
- 即时模式:绘制后不会保留图形的 "记录",只保留最终像素,想修改必须重绘;
- 依赖 JS:纯 HTML 无法生效,必须搭配 JavaScript 操作绘图 API;
- 高性能:适合大量动态图形、复杂动画、游戏渲染。
Canvas 凭借高性能、动态绘制、像素级控制 的优势,主要用在需要大量动态图形、实时渲染、交互动画的场景,是前端可视化和交互领域的核心技术。
学习文档:
基本使用:
canvas 标签一般使用 id、height、weight 三个属性来实现获取和大小确定,如:
<canvas id="can" ref="can" width="600" height="400px"></canvas>
第一步获取画布元素:
const can = document.getElementById("can");
//vue3里面使用ref 获取
const can = ref(null);
第二步创建该画布的 2d 上下文对象(相当于画笔):
let ctx = can.value.getContext("2d");
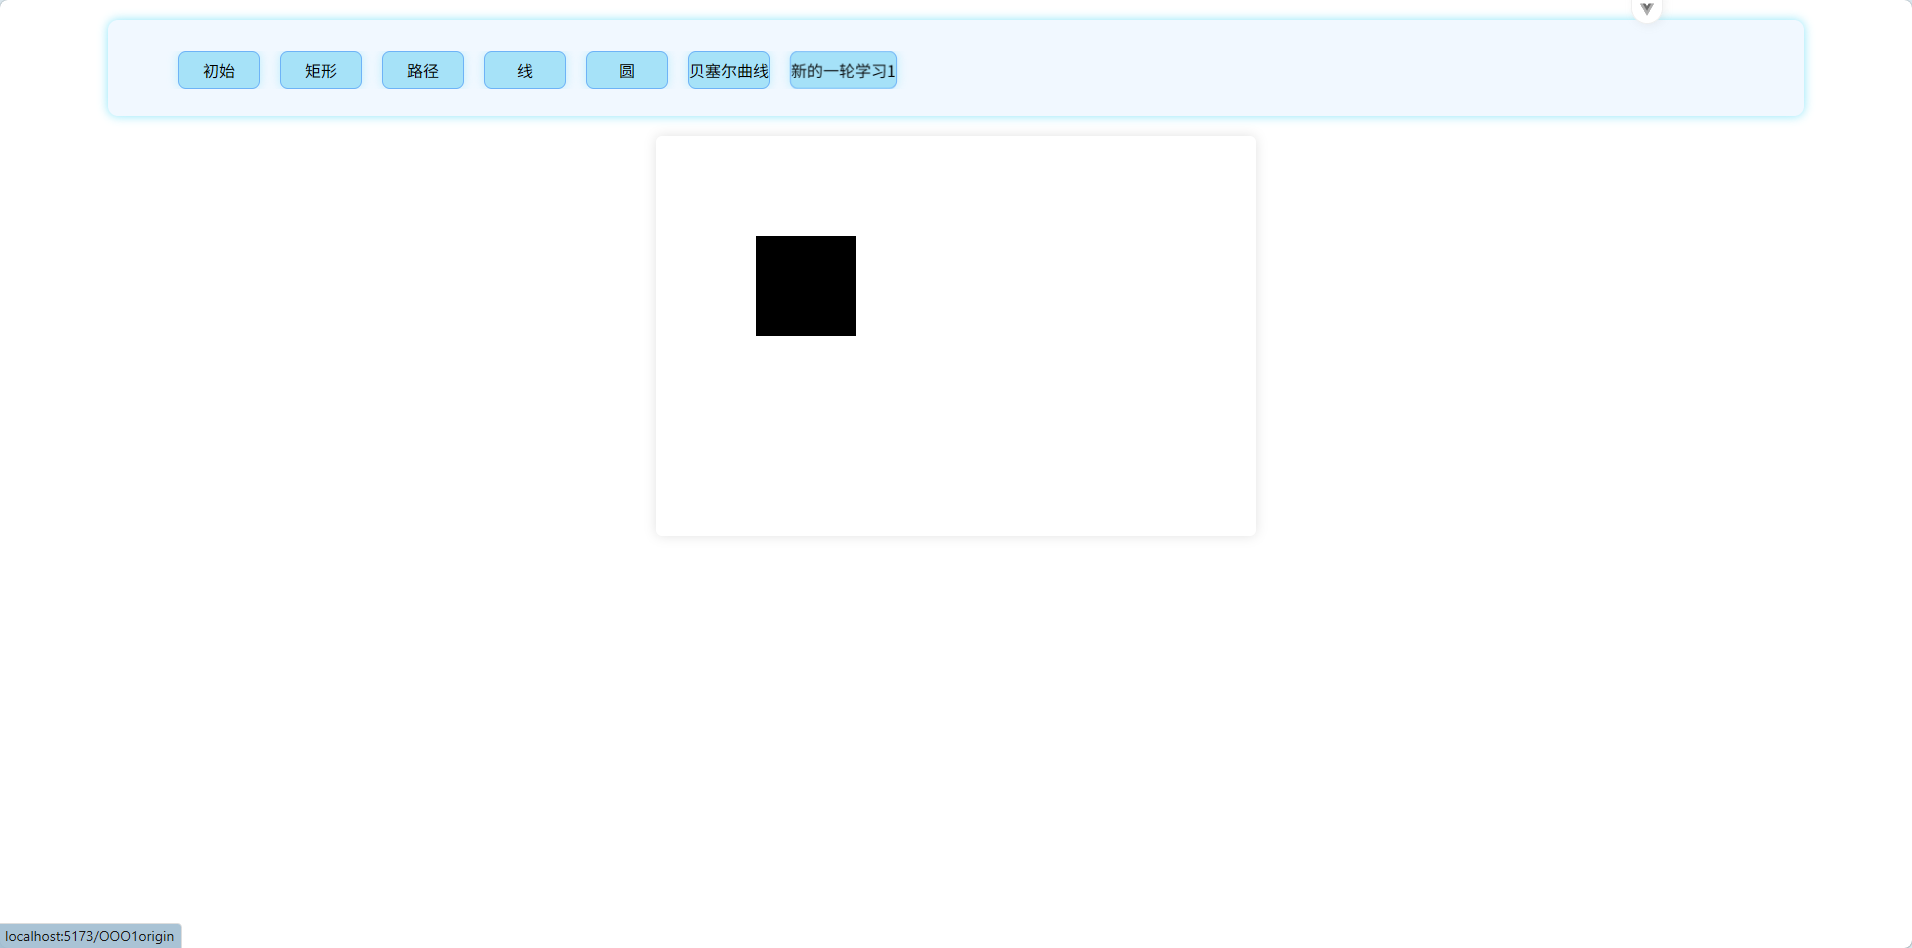
第三步开始画画,这里以一个简单矩形示例:
ctx.fillRect(100, 100, 100, 100)
结果如下:
绘制基本图形:
weight/height 属性和 weight/height 样式的区别和联系:
canvas 标签可以同时设置 w/h 属性和样式,如果同时存在属性和样式,就以样式为大小设置,但里面的像素个数却是以属性为主,即样式仅作缩放功能,实际像素由属性决定。
示例:
<canves weight="1" height="1" style="weight=100px;height=100px"></canvas>
视图大小是 100*100px ,但里面实际只有一个像素,即只有一个可以绘画的栅格。
路径概念:
每个 canvas 里面都只有一个全局路径列表,对于 canvas 画布里面的每个图形,如果想要互不干扰,就必须在画之前使用 beginPath 清空路径列表,然后再画。这也意味着,对于之前画的所有内容,canvas 不会保留路径记录,只会保留当前正在绘制的图形的路径列表。
对于一个图形来说,其肯定是通过 beginPath 和 closePath 包裹的,然而,如果该图形并不是所有的路径都是连在一起,就会出现相连的错误情况,这时可以使用 moveTo 来解决这个问题,即松一下笔,然后落到指定位置,但是并没有开新的路径集
矩形的绘制:
方法:
1、绘制空心矩形:ctx.strokeRect()/ctx.rect()->ctx.stroke()
2、绘制实心矩形:ctx.fillRect()/ctx.rect()->ctx.fill()
3、清除矩形:ctx.clearRect()
方法解析:
beginPath:开始新的路径,即把路径列表清空
closePath:结束当前路径,也会清空列表
rect:绘制一个矩形,但不显示,需要填充或描边
stroke:描边
fill:填充
示例:
javascript
<script setup>

    import { ref, onMounted } from "vue";

    let can = ref(null);

    onMounted(() => {

        let ctx = can.value.getContext("2d");

        // // 使用路径绘制矩形

        // ctx.strokeRect(100, 100, 100, 100);

        // // 使用填充绘制矩形

        // ctx.fillRect(250, 100, 100, 100);

        // // 清除矩形

        // let h = 0;

        // let t1 = setInterval(function () {

        // ctx.clearRect(0, 0, 600, h);

        // h++;

        // if (h > 400) {

            // clearInterval(t1);

        // }

        // }, 10);

    // 使用拆分后的写法

    ctx.beginPath();

    ctx.rect(100, 100, 100, 100);

    ctx.stroke();

    ctx.closePath(); // 这里不是必要的,因为beginPath()会清除之前的路径,但是为了代码的规范性,还是建议在绘制完之后使用closePath()来关闭路径


    ctx.beginPath();

    ctx.rect(250, 120, 100, 100);

    ctx.fill(); // 这里会把前面全部的都给填充完,因为之前的路径没有被清除掉,所以会把之前的路径也给填充掉,因此使用beginPath()和closePath()来清除路径

    ctx.closePath();

});

</script>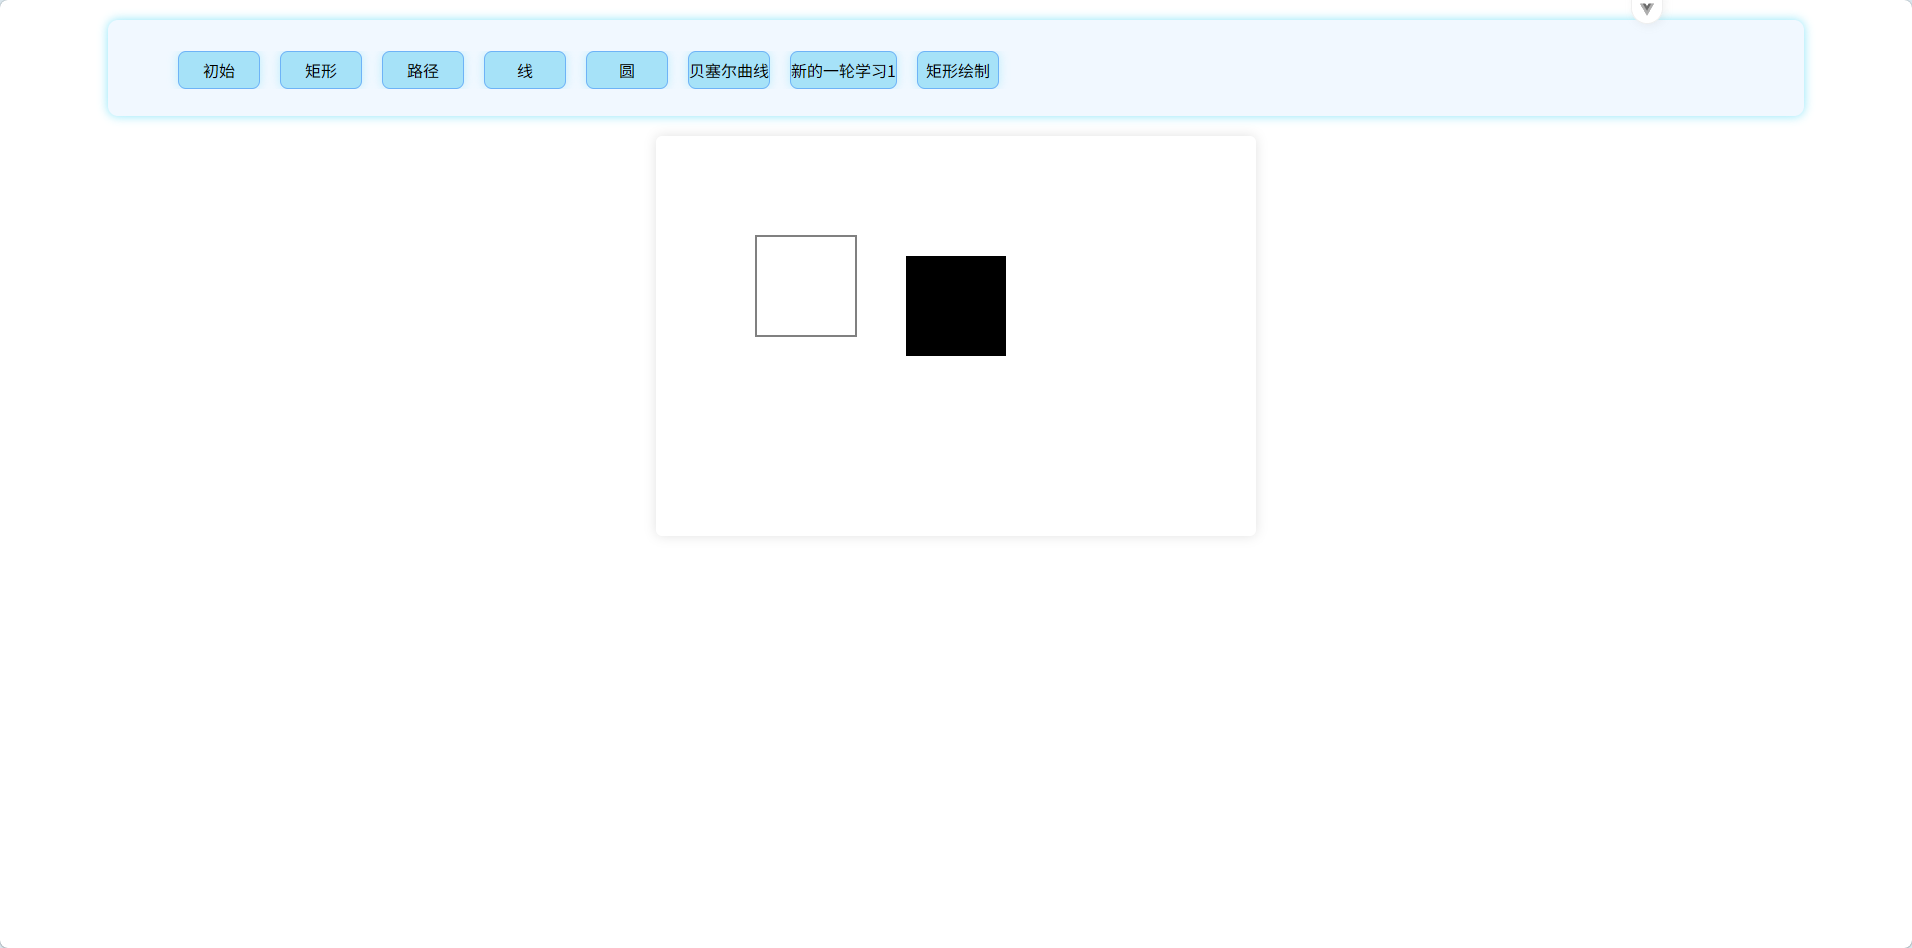
圆形的绘制:
方法:
ctx.arc(圆心 x , 圆心 y , 半径 r , 绘制的开始角度 , 绘制的结束角度 , 是否逆时针);
方法解析:
圆心 x 和圆心 y 用来确定圆心
半径 r 确定半径
绘制开始的角度确定开始点,角度是从圆心正右边为 0 开始,顺时针到 2Pi
绘制结束的角度确定结束点
是否逆时针,默认 false
注意,对于逆时针来说,角度的确定还是按照顺时针的标准来的,所以有的时候看着比较奇怪,如下:
javascript
ctx.beginPath();
ctx.arc(300, 200, 60, 0, Math.PI / 2, true);
ctx.fill();
ctx.closePath();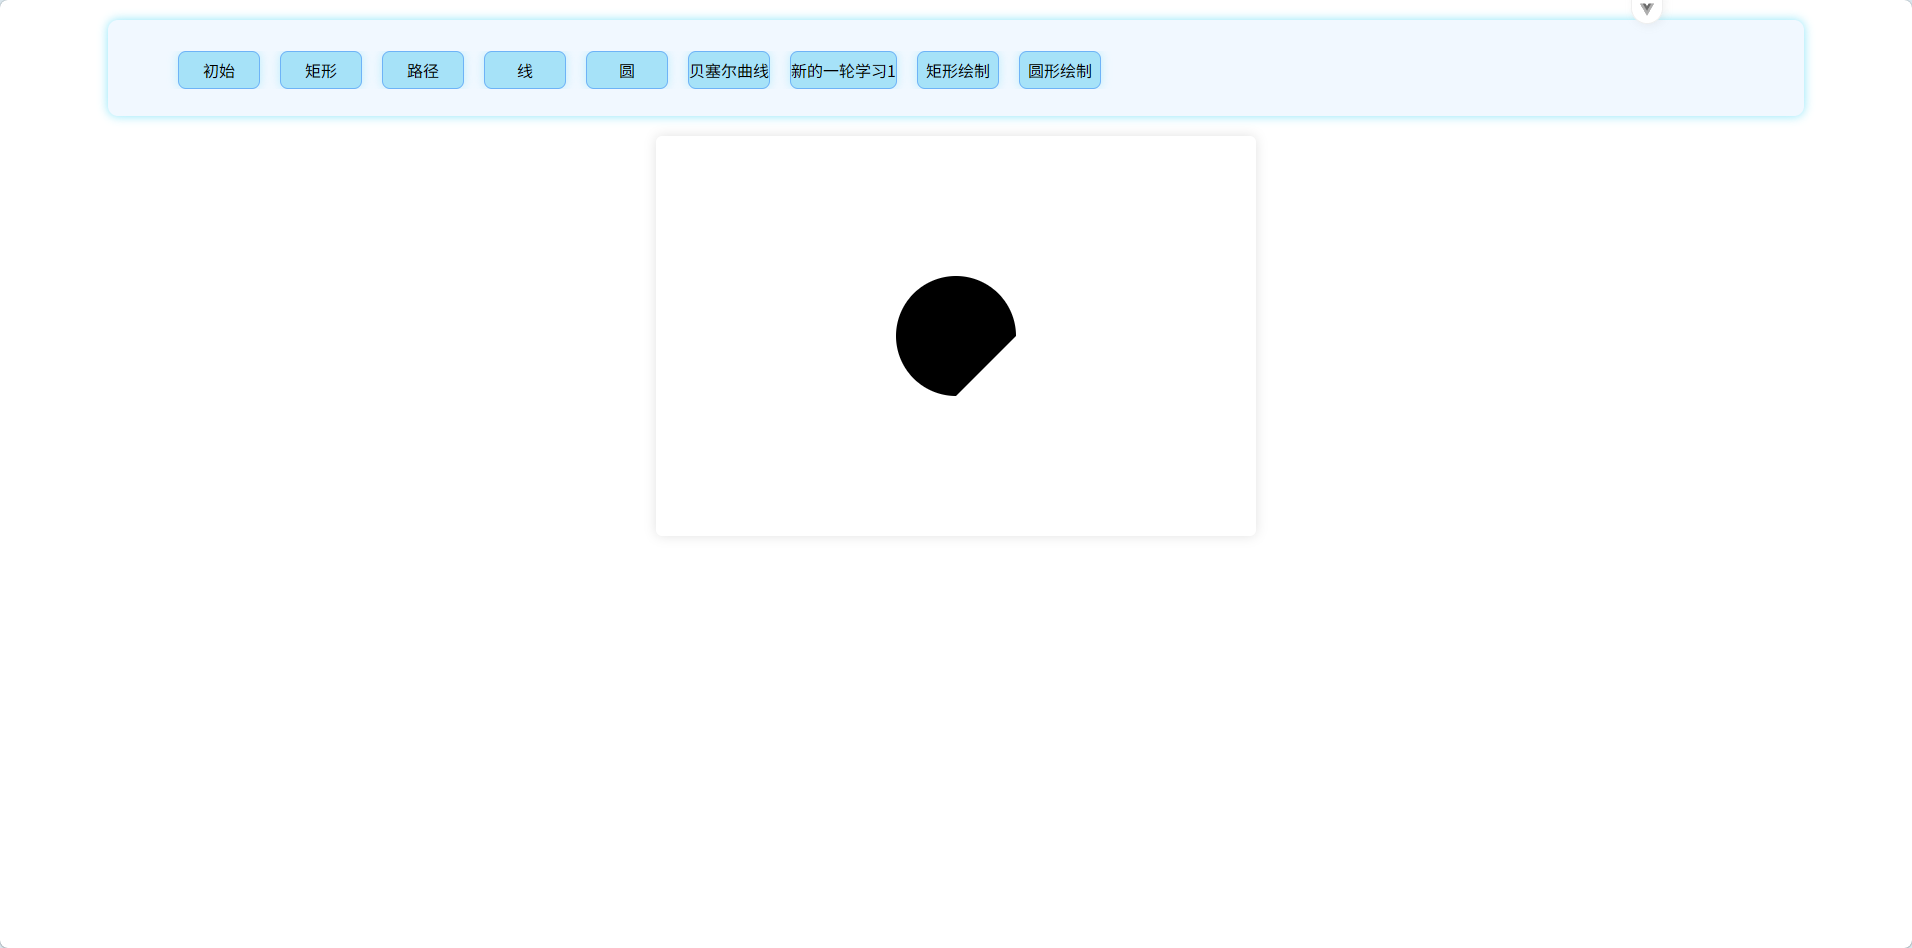
笑脸案例:
javascript
// 绘制一个笑脸
  ctx.beginPath();
  ctx.arc(210, 130, 30, 0, Math.PI * 2);
  ctx.stroke();
  ctx.moveTo(420, 130);
  ctx.arc(390, 130, 30, 0, Math.PI * 2);
  ctx.stroke();
  ctx.moveTo(360, 200);
  ctx.arc(300, 200, 60, 0, Math.PI);
  ctx.stroke();
  ctx.closePath();
线段的绘制:
方法:
ctx.lineTo(目标 x , 目标 y);
方法解析:
将从当前位置以一条线段的形式移动到目标坐标处。
可以只有 moveTo 来移动到指定的初始位置
示例:
javascript
let ctx = can.value.getContext("2d");
  ctx.beginPath();
  ctx.moveTo(300, 200);
  ctx.lineTo(300, 150);
  ctx.lineTo(350, 150);
  ctx.lineTo(300, 200);
  ctx.stroke();
  ctx.closePath();
圆弧的绘制 2:
方法:
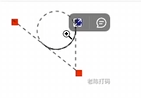
ctx.arcTo(x1,y1,x2,y2,r);
方法解析:
从当前点开始,与(x1,y1)连一条线段,然后(x1,y1)与(x2,y2)连一条线段,做一个与两条线段相切的半径为 r 的圆,取该圆与线段相交两点之间的部分和两条线段
示例:
javascript
let ctx = can.value.getContext("2d");
  ctx.beginPath();
  ctx.moveTo(300, 200);
  ctx.lineTo(300, 300);
  ctx.lineTo(200, 300);

  ctx.moveTo(250, 250);
  ctx.lineTo(250, 300);
  ctx.moveTo(250, 250);
  ctx.lineTo(300, 250);

  ctx.moveTo(300, 200);
  ctx.arcTo(300, 300, 200, 300, 50);
  ctx.stroke();
  ctx.closePath();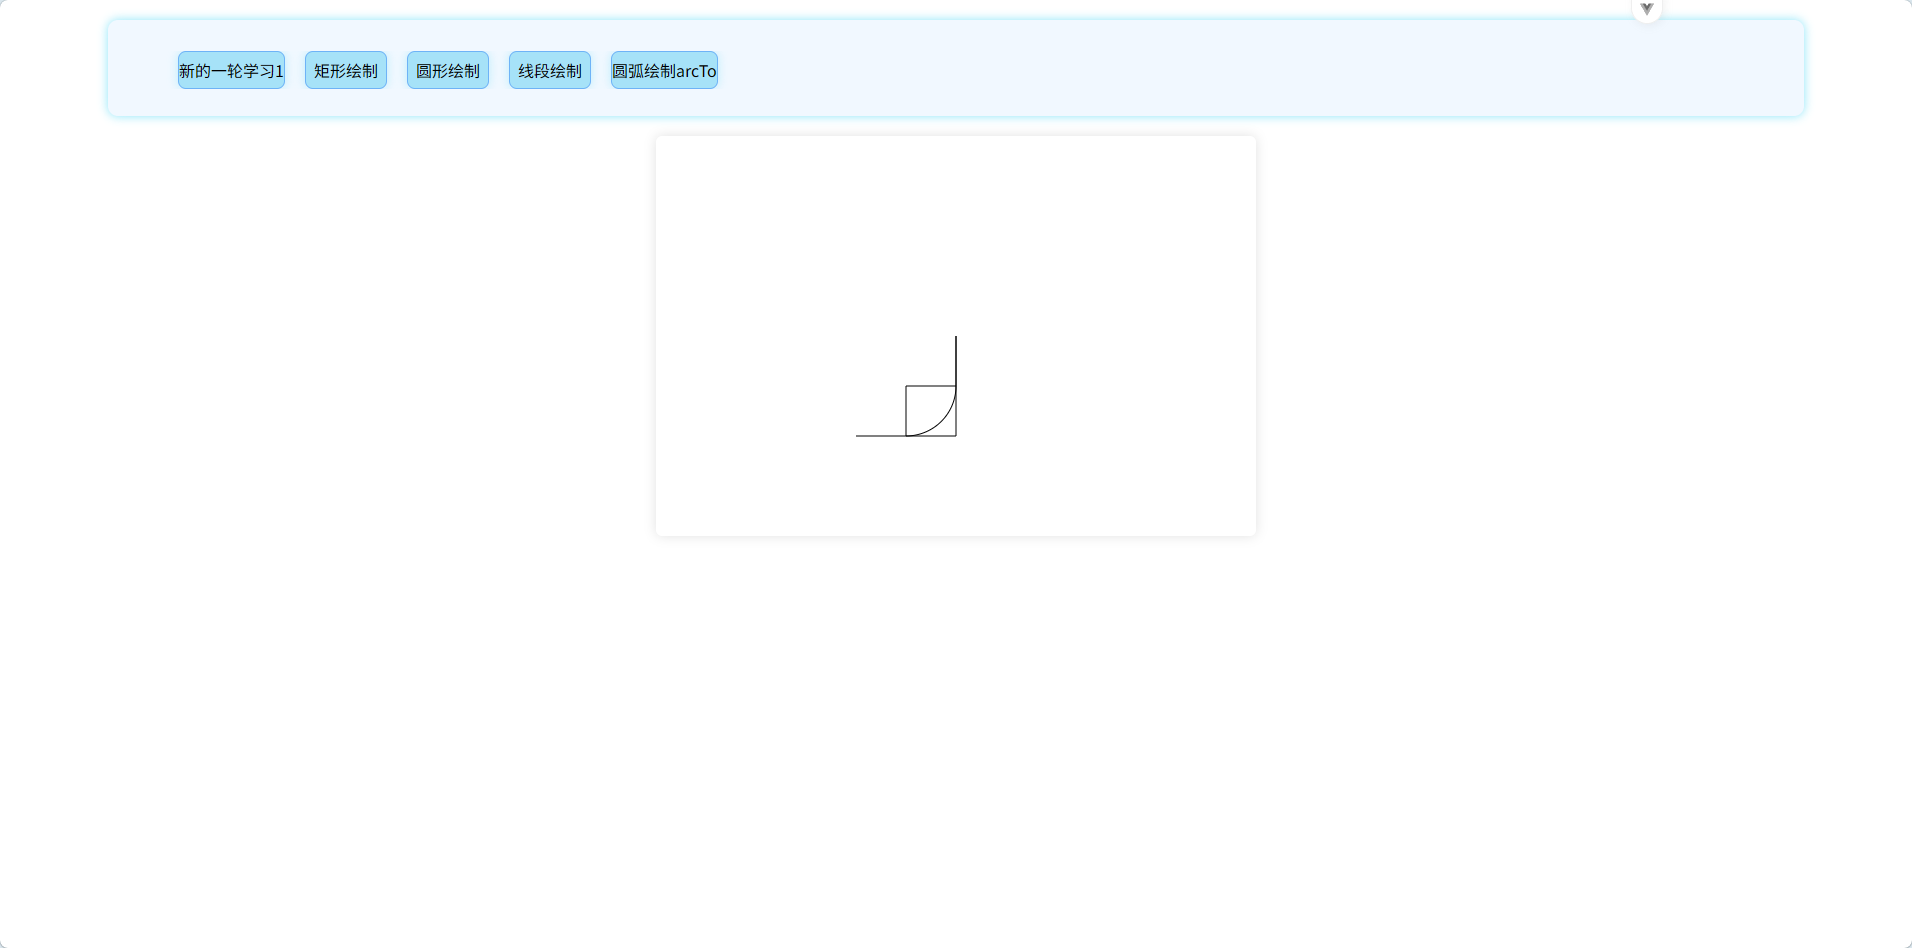
二次贝塞尔曲线的绘制:
方法:
ctx.quadraticCurveTo(x1,y1,x2,y2)
quadraticCurveTo:二次曲线 To
方法解析:
从当前点为起点,以(x1,y1)为控制点,以 (x2,y2)为终点绘制一条二次贝塞尔曲线
示例:
javascript
<template>
  <canvas id="can" ref="can" width="600" height="400px">
    <p>你的浏览器不支持canvas</p>
    <a href="https://www.google.com/chrome/" target="_blank">点击下载最新版浏览器</a>
  </canvas>
</template>

<script setup>
import { ref, onMounted } from "vue";
let can = ref(null);
onMounted(() => {
  let ctx = can.value.getContext("2d");
  ctx.beginPath();
  ctx.moveTo(300, 200);
  ctx.quadraticCurveTo(200, 200, 200, 140);
  ctx.quadraticCurveTo(200, 85, 260, 80);
  ctx.quadraticCurveTo(480, 50, 450, 140);
  ctx.quadraticCurveTo(430, 200, 350, 200);
  ctx.quadraticCurveTo(320, 250, 270, 250);
  ctx.quadraticCurveTo(300, 250, 300, 200);
  ctx.stroke();
  ctx.closePath();
});
</script>

<style scoped>
* {
  padding: 0;
  margin: 0;
  box-sizing: border-box;
}
body {
  background-color: aliceblue;
}
#can {
  box-shadow: 0px 0px 12px rgba(0, 0, 0, 0.12);
  margin: auto;
  display: block;
  border-radius: 6px;
  background-color: white;
}
</style>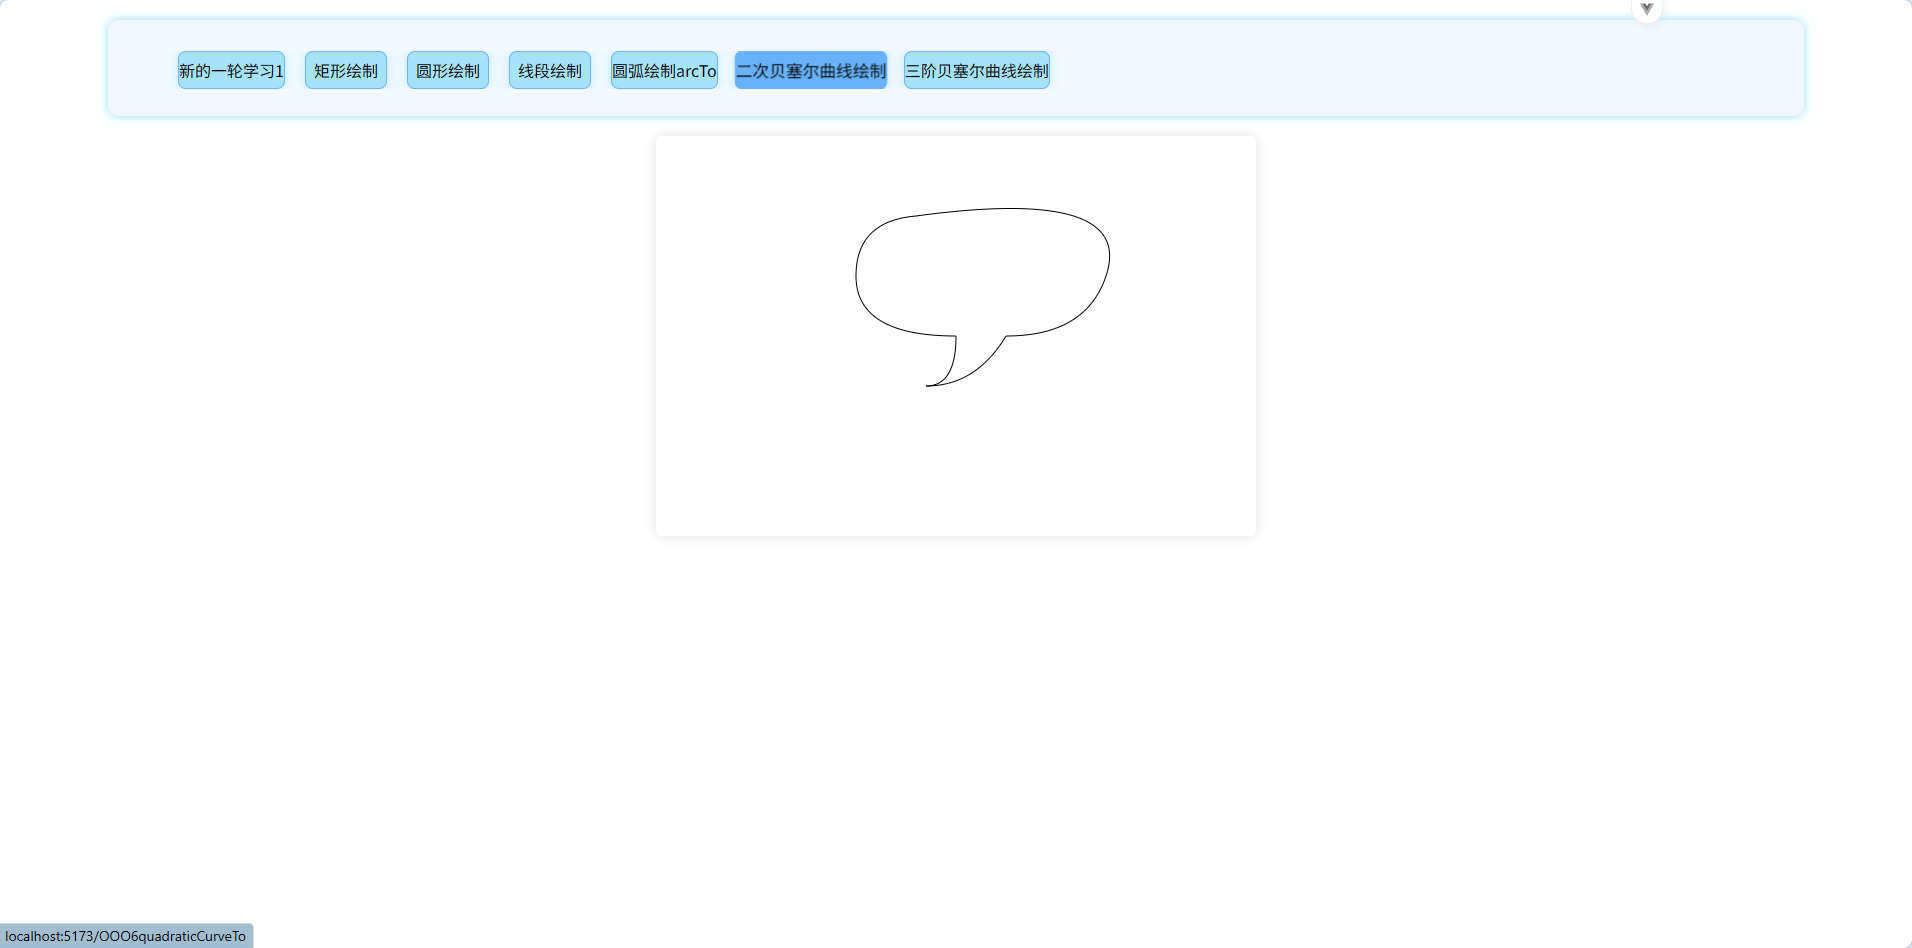
三次贝塞尔曲线:
方法:
bezierCurveTo(x1,y1,x2,y2,x3,y3)
bezierCurveTo:贝塞尔曲线 To
方法解析:
以当前所在点为起点,以(x1,y1)、(x2,y2)两个点为控制点,以(x3,y3)为终点画一条三次贝塞尔曲线。
示例:
javascript
<template>
  <canvas id="can" ref="can" width="600" height="400px">
    <p>你的浏览器不支持canvas</p>
    <a href="https://www.google.com/chrome/" target="_blank">点击下载最新版浏览器</a>
  </canvas>
</template>

<script setup>
import { ref, onMounted } from "vue";
let can = ref(null);
onMounted(() => {
  let ctx = can.value.getContext("2d");
  ctx.beginPath();
  ctx.moveTo(300, 200);
  ctx.bezierCurveTo(220, 100, 400, 100, 450, 200);
  ctx.moveTo(300, 200);
  ctx.bezierCurveTo(220, 300, 400, 300, 450, 200);
  ctx.stroke();
  ctx.closePath();
});
</script>

<style scoped>
* {
  padding: 0;
  margin: 0;
  box-sizing: border-box;
}
body {
  background-color: aliceblue;
}
#can {
  box-shadow: 0px 0px 12px rgba(0, 0, 0, 0.12);
  margin: auto;
  display: block;
  border-radius: 6px;
  background-color: white;
}
</style>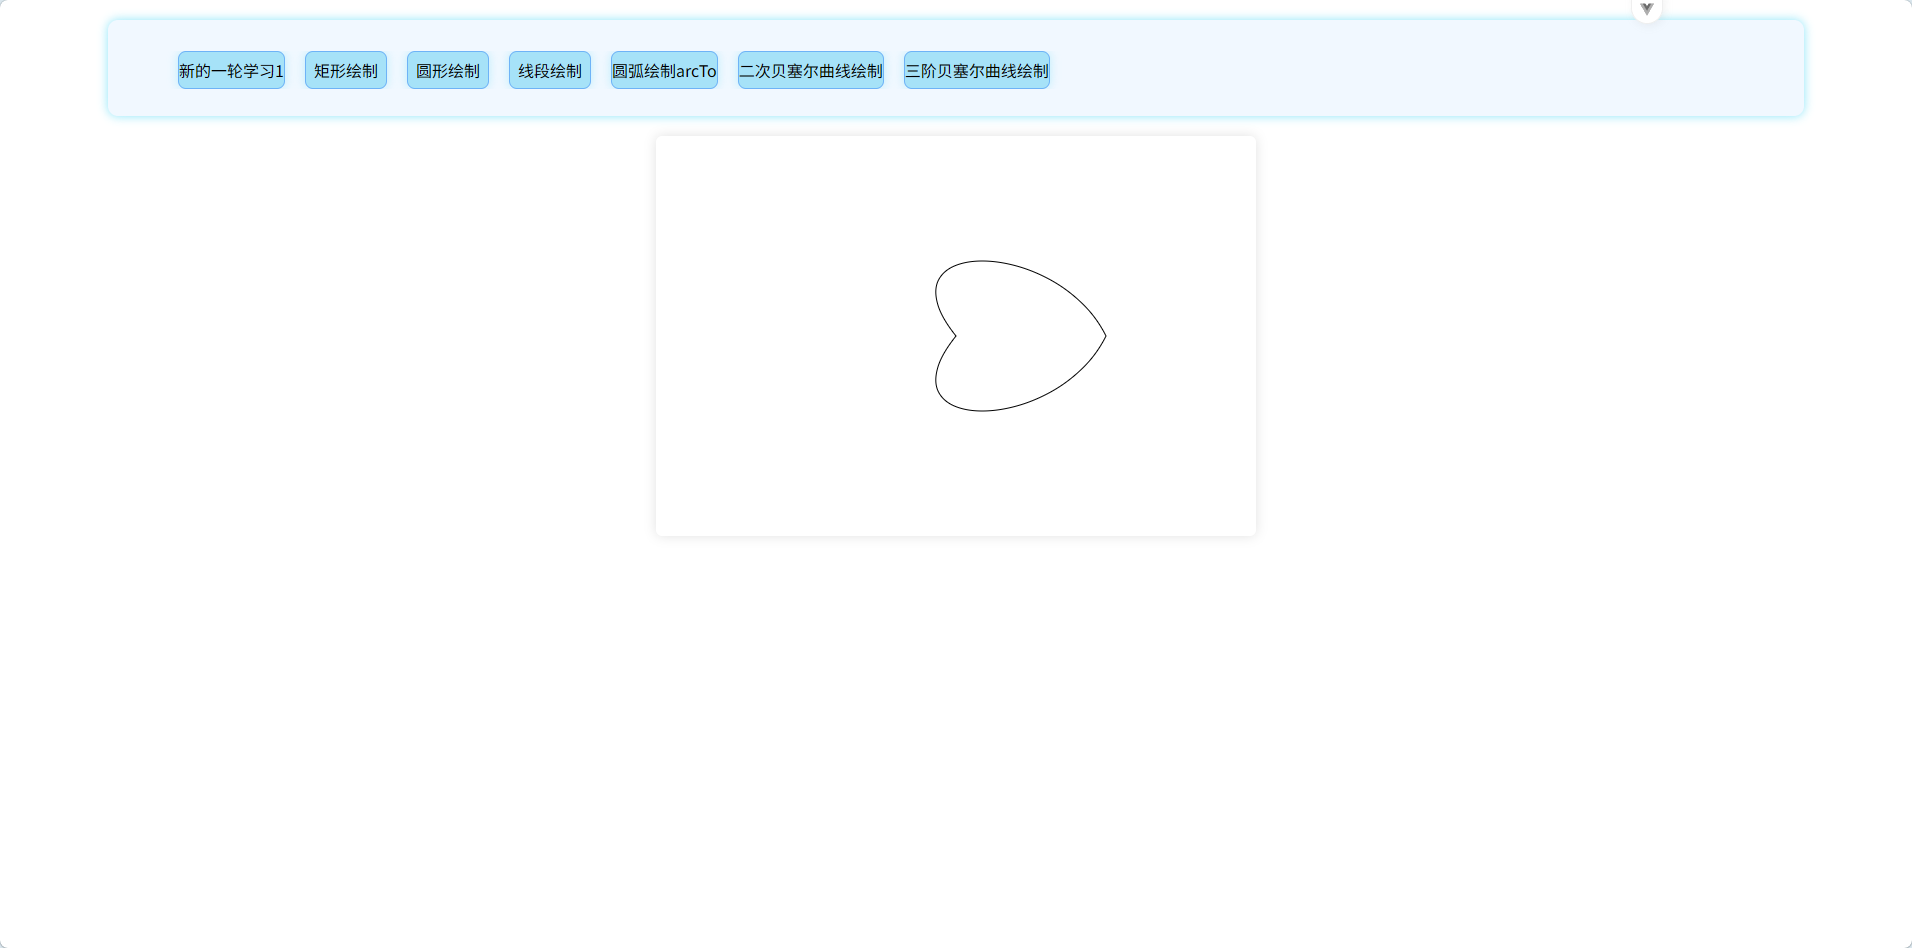
path2D 创建路径对象实现路径封装:
方法:
let pathObj = new Path2D(); 创建一个路径对象,可以存储一个路径信息
使用解析:
使用流程:
1、创建一个路径对象
2、绘制该对象的路径:
不再 ctx.arc....了,而是 pathObj.arc().....,moveTo 等方法同理
3、描边或者填充该对象的路径,实现路径使用
示例:
javascript
<template>
  <canvas id="can" ref="can" width="600" height="400px">
    <p>你的浏览器不支持canvas</p>
    <a href="https://www.google.com/chrome/" target="_blank">点击下载最新版浏览器</a>
  </canvas>
</template>

<script setup>
import { ref, onMounted } from "vue";
let can = ref(null);
onMounted(() => {
  let ctx = can.value.getContext("2d");
  ctx.beginPath();

  let heartPath = new Path2D(); // 创建一个爱心的路径对象
  heartPath.moveTo(300, 200);
  heartPath.bezierCurveTo(220, 100, 400, 100, 450, 200);
  heartPath.moveTo(300, 200);
  heartPath.bezierCurveTo(220, 300, 400, 300, 450, 200);
  ctx.fill(heartPath);

  let chatPath = new Path2D(); // 创建一个聊天气泡的路径对象
  chatPath.moveTo(100, 200);
  chatPath.quadraticCurveTo(0, 200, 0, 140);
  chatPath.quadraticCurveTo(0, 85, 60, 80);
  chatPath.quadraticCurveTo(280, 50, 250, 140);
  chatPath.quadraticCurveTo(230, 200, 150, 200);
  chatPath.quadraticCurveTo(120, 250, 70, 250);
  chatPath.quadraticCurveTo(100, 250, 100, 200);
  ctx.stroke(chatPath);

  ctx.closePath();
});
</script>

<style scoped>
* {
  padding: 0;
  margin: 0;
  box-sizing: border-box;
}
body {
  background-color: aliceblue;
}
#can {
  box-shadow: 0px 0px 12px rgba(0, 0, 0, 0.12);
  margin: auto;
  display: block;
  border-radius: 6px;
  background-color: white;
}
</style>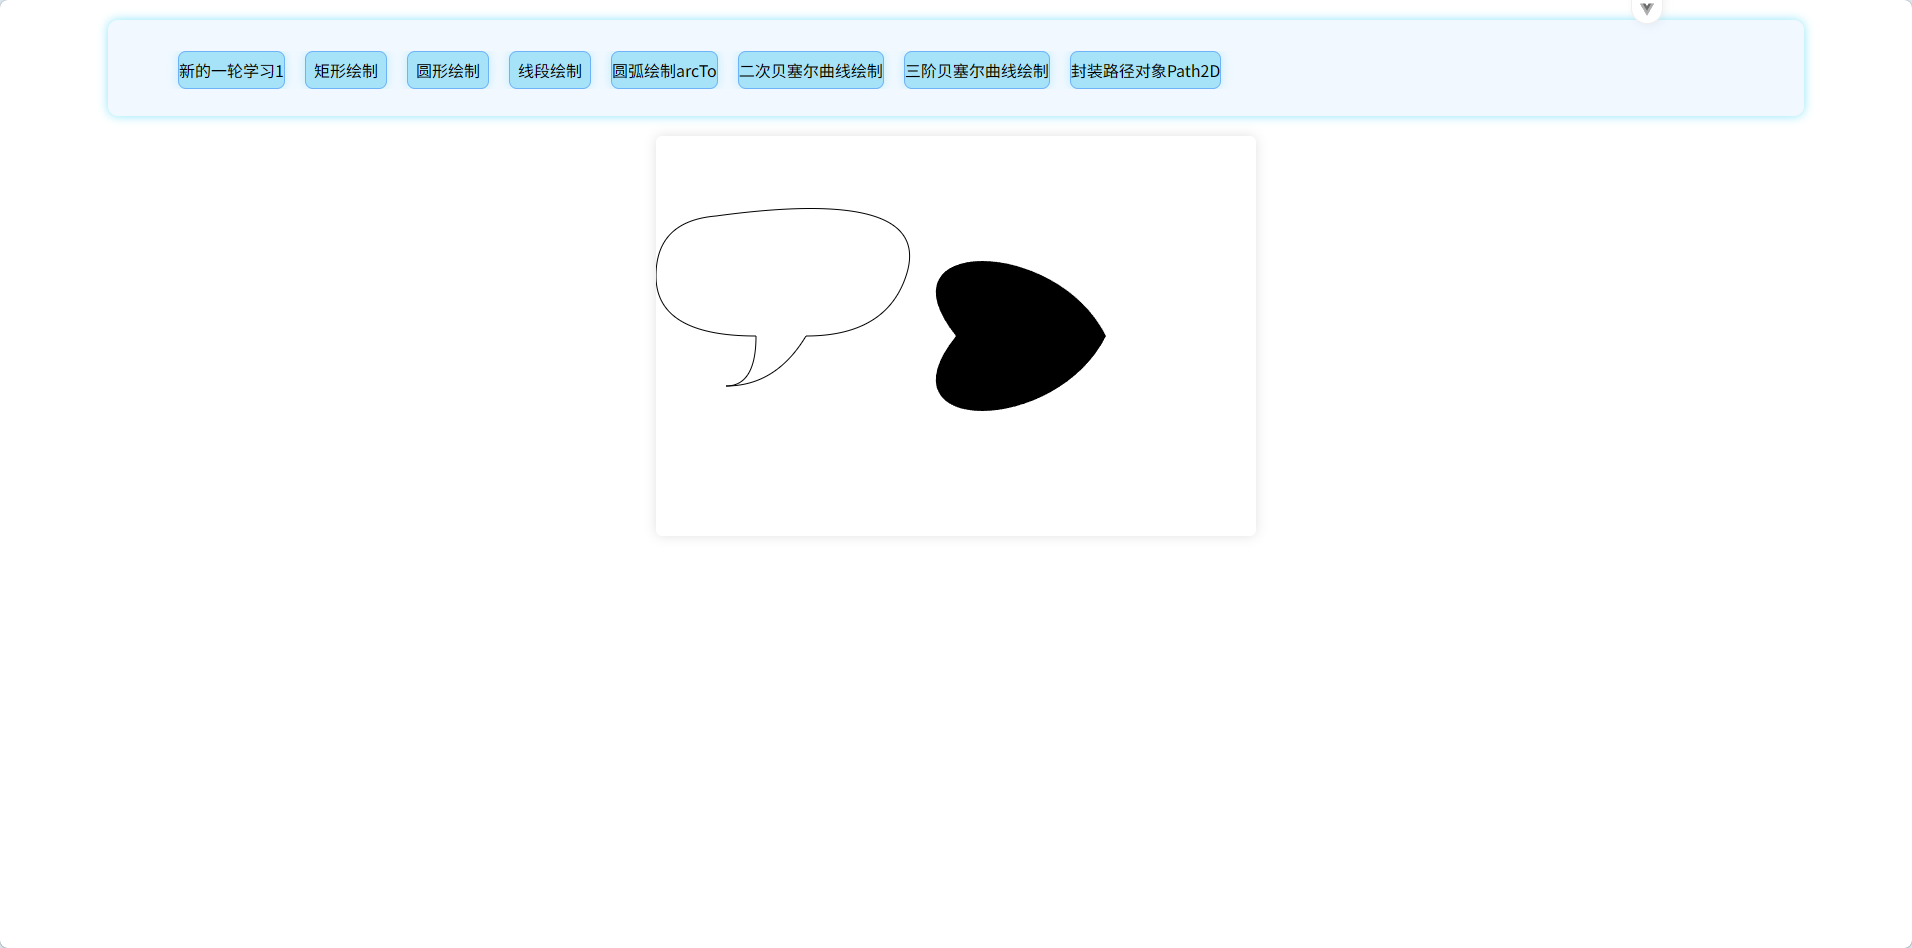
样式设置:
颜色设置:
方法:
ctx.fillStyle = 颜色值;
ctx.strokeStyle = 颜色值;
ctx.globalAlpha = 透明度值;
方法解析:
ctx.fillStyle = 颜色值:
给画笔设置填充颜色,值可以为颜色字母、rgb、rgba、八进制值
ctx.strokeStyle = 颜色值;
给画笔设置轮框颜色,值和 fillStyle 一样
ctx.globalAlpha = 透明度值;
给画笔设置全局透明度,后面填充和轮框的颜色都会设置该透明度,同时如果再设置 rgba 里面的透明度时仍以全局透明度为主,值的取值范围为 0 - 1
使用事项:
fillStyle 和 strokeStyle 要注意变化时机,当设置之后如果不进行手动更改就不会变化,所以
当需要的颜色变化时要及时修改其值。
globalAlpha 尽量少用,使用 rgba 替代它更好一点,相对而言更灵活,其适用于需要设置全局透明度的时候
示例:
javascript
<template>
  <canvas id="can" ref="can" width="600" height="400px">
    <p>你的浏览器不支持canvas</p>
    <a href="https://www.google.com/chrome/" target="_blank">点击下载最新版浏览器</a>
  </canvas>
</template>

<script setup>
import { ref, onMounted } from "vue";
let can = ref(null);
onMounted(() => {
  let ctx = can.value.getContext("2d");

  ctx.globalAlpha = 0.7; // 设置全局透明度

  ctx.beginPath();
  ctx.rect(100, 100, 100, 100);
  ctx.fillStyle = "rgb(255,200,200)";
  ctx.fill();
  ctx.closePath();

  ctx.beginPath();
  ctx.rect(300, 100, 100, 100);
  ctx.strokeStyle = "red";
  ctx.stroke();
  ctx.fillStyle = "rgb(200,255,200)";
  ctx.fill();
  ctx.closePath();
});
</script>

<style scoped>
* {
  padding: 0;
  margin: 0;
  box-sizing: border-box;
}
body {
  background-color: aliceblue;
}
#can {
  box-shadow: 0px 0px 12px rgba(0, 0, 0, 0.12);
  margin: auto;
  display: block;
  border-radius: 6px;
  background-color: white;
}
</style>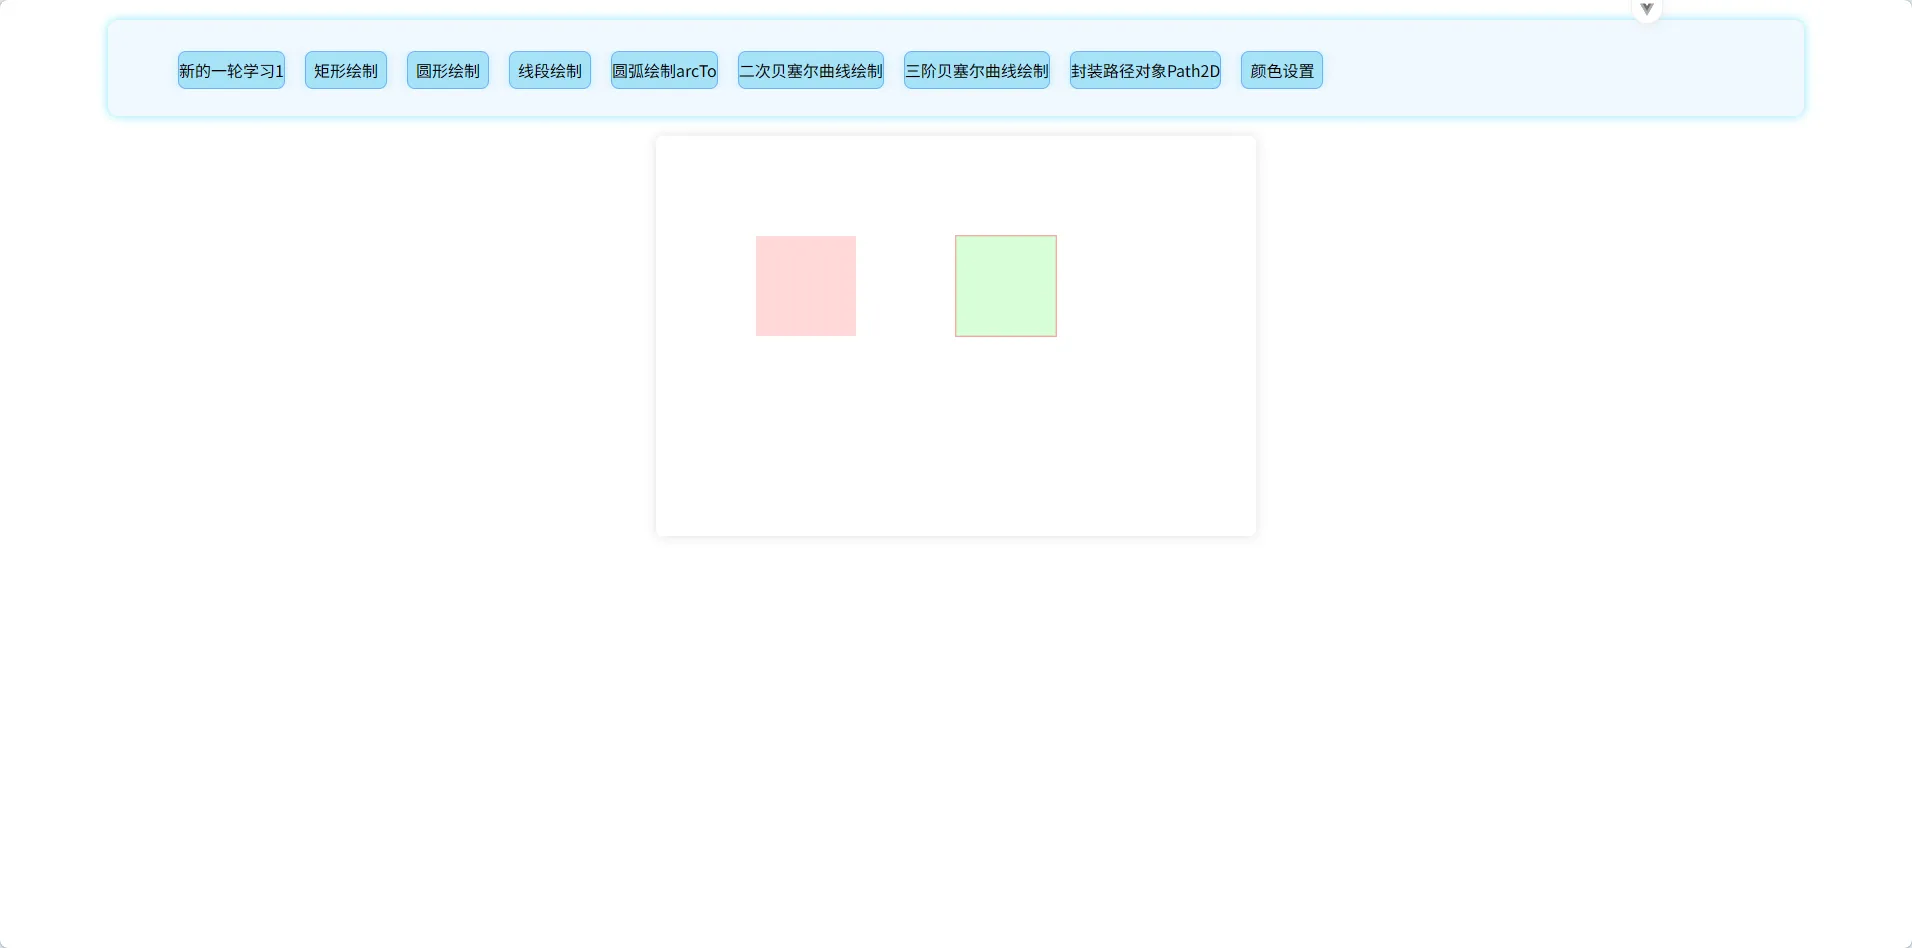
线条宽度设置:
方法:
ctx.lineWidth = 宽度值
方法解析:
ctx.lineWidth = 宽度值:
设置的宽度值是单位宽度,其 1 代表的是 canvas width 属性值/canvas 元素实际宽度。
默认值为 1.0,值必须是正数
设置的作用范围包含:stroke 的样式.......
注意,当宽度为 1 时,如果中心线位置为整数,左右各分 0.5,此时会出现宽度变大的情况
示例:
javascript
<template>
  <P>设置线条宽度</P>
  <canvas id="can" ref="can" width="600" height="400px">
    <p>你的浏览器不支持canvas</p>
    <a href="https://www.google.com/chrome/" target="_blank">点击下载最新版浏览器</a>
  </canvas>
</template>

<script setup>
import { ref, onMounted } from "vue";
let can = ref(null);
onMounted(() => {
  function draw() {
    const ctx = can.value.getContext("2d");
    for (let i = 0; i < 10; i++) {
      ctx.lineWidth = 1 + i;
      ctx.beginPath();
      ctx.moveTo(225 + i * 14, 65);
      ctx.lineTo(225 + i * 14, 200);
      ctx.stroke();
    }
  }
  draw();
});
</script>

<style scoped>
* {
  padding: 0;
  margin: 0;
  box-sizing: border-box;
}
body {
  background-color: aliceblue;
}
#can {
  box-shadow: 0px 0px 12px rgba(0, 0, 0, 0.12);
  margin: auto;
  display: block;
  border-radius: 6px;
  background-color: white;
}
p {
  text-align: center;
  margin: 10px;
  font-size: 24px;
  font-weight: bold;
}
</style>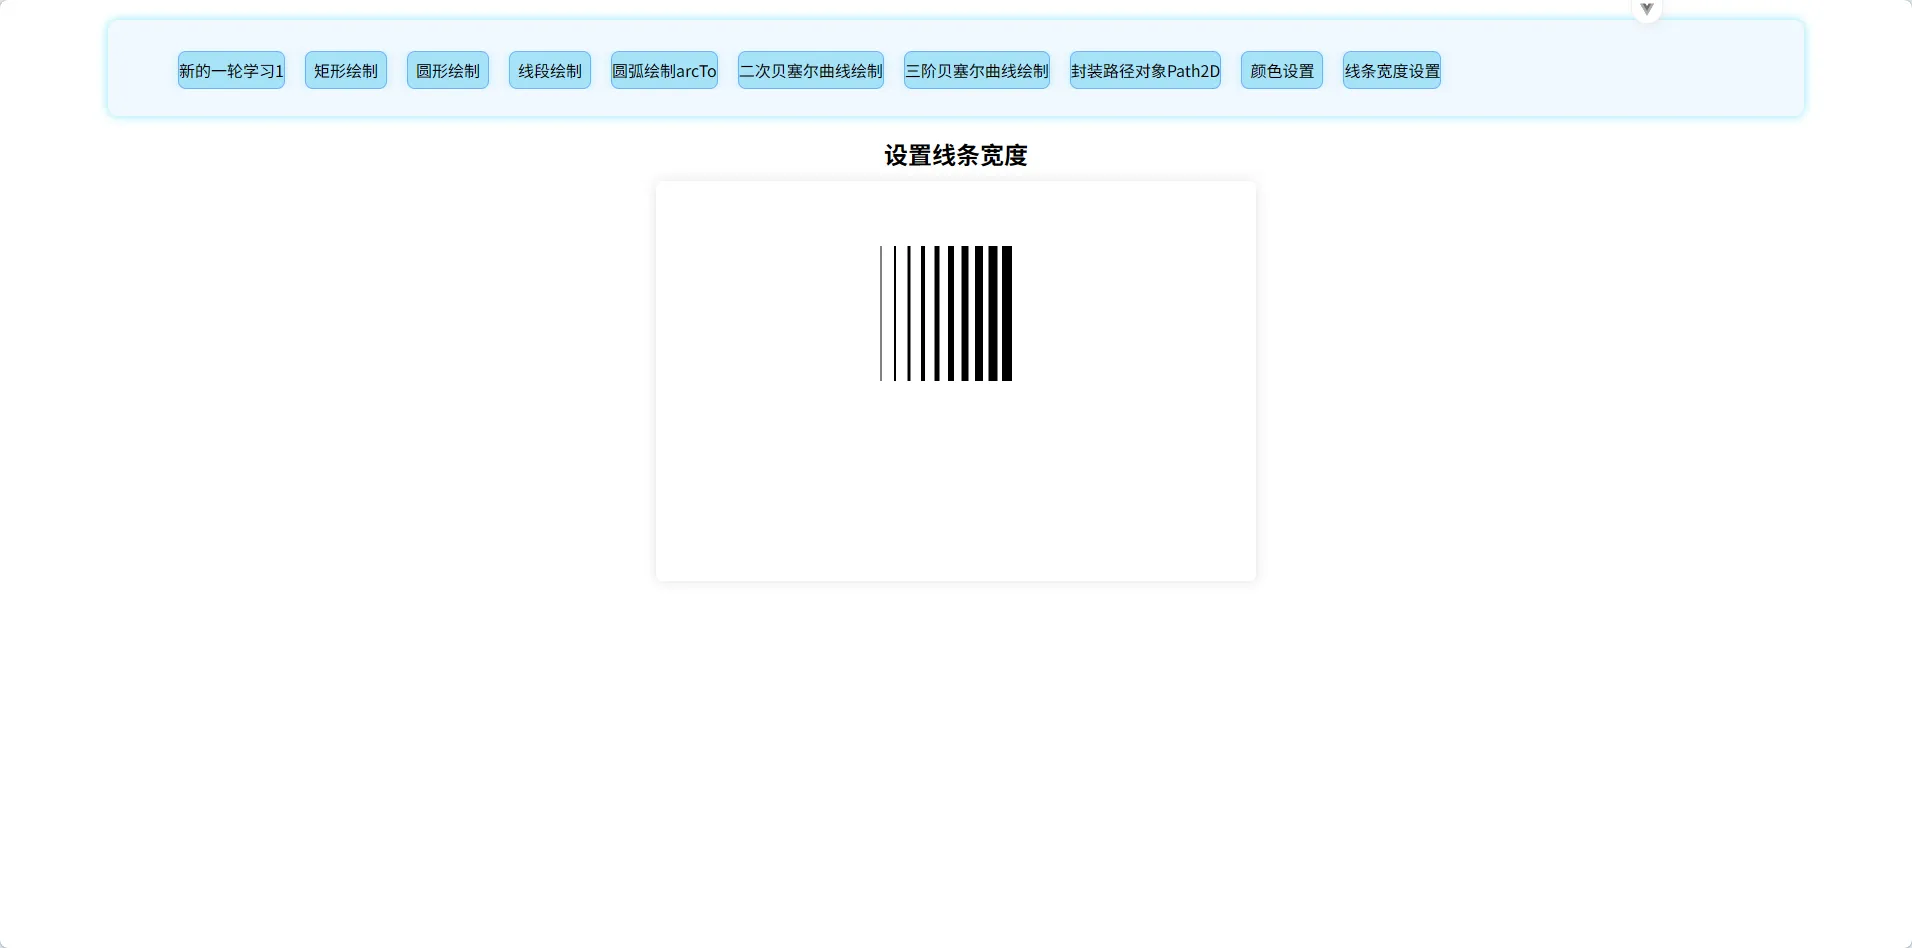
线条末端样式设置:
方法:
ctx.lineCap = 样式值
方法解析:
样式取值:
mutt:正常方形末端
round:圆形末端,半径为宽度一半
square:也是方形末端,不过相较于 mutt 向外延申宽度一半的距离
示例:
javascript
<template>
  <P>设置线条宽度</P>
  <canvas id="can" ref="can" width="600" height="400px">
    <p>你的浏览器不支持canvas</p>
    <a href="https://www.google.com/chrome/" target="_blank">点击下载最新版浏览器</a>
  </canvas>
</template>

<script setup>
import { ref, onMounted } from "vue";
let can = ref(null);
onMounted(() => {
  function draw() {
    const ctx = can.value.getContext("2d");

    // 创建路径
    ctx.strokeStyle = "#09f";
    ctx.beginPath();
    ctx.moveTo(210, 110);
    ctx.lineTo(340, 110);
    ctx.moveTo(210, 240);
    ctx.lineTo(340, 240);
    ctx.stroke();

    // 画线条
    ctx.strokeStyle = "black";
    ["butt", "round", "square"].forEach((lineCap, i) => {
      ctx.lineWidth = 15;
      ctx.lineCap = lineCap;
      ctx.beginPath();
      ctx.moveTo(210 + i * 50, 110);
      ctx.lineTo(210 + i * 50, 240);
      ctx.stroke();
    });
  }
  draw();
});
</script>

<style scoped>
* {
  padding: 0;
  margin: 0;
  box-sizing: border-box;
}
body {
  background-color: aliceblue;
}
#can {
  box-shadow: 0px 0px 12px rgba(0, 0, 0, 0.12);
  margin: auto;
  display: block;
  border-radius: 6px;
  background-color: white;
}
p {
  text-align: center;
  margin: 10px;
  font-size: 24px;
  font-weight: bold;
}
</style>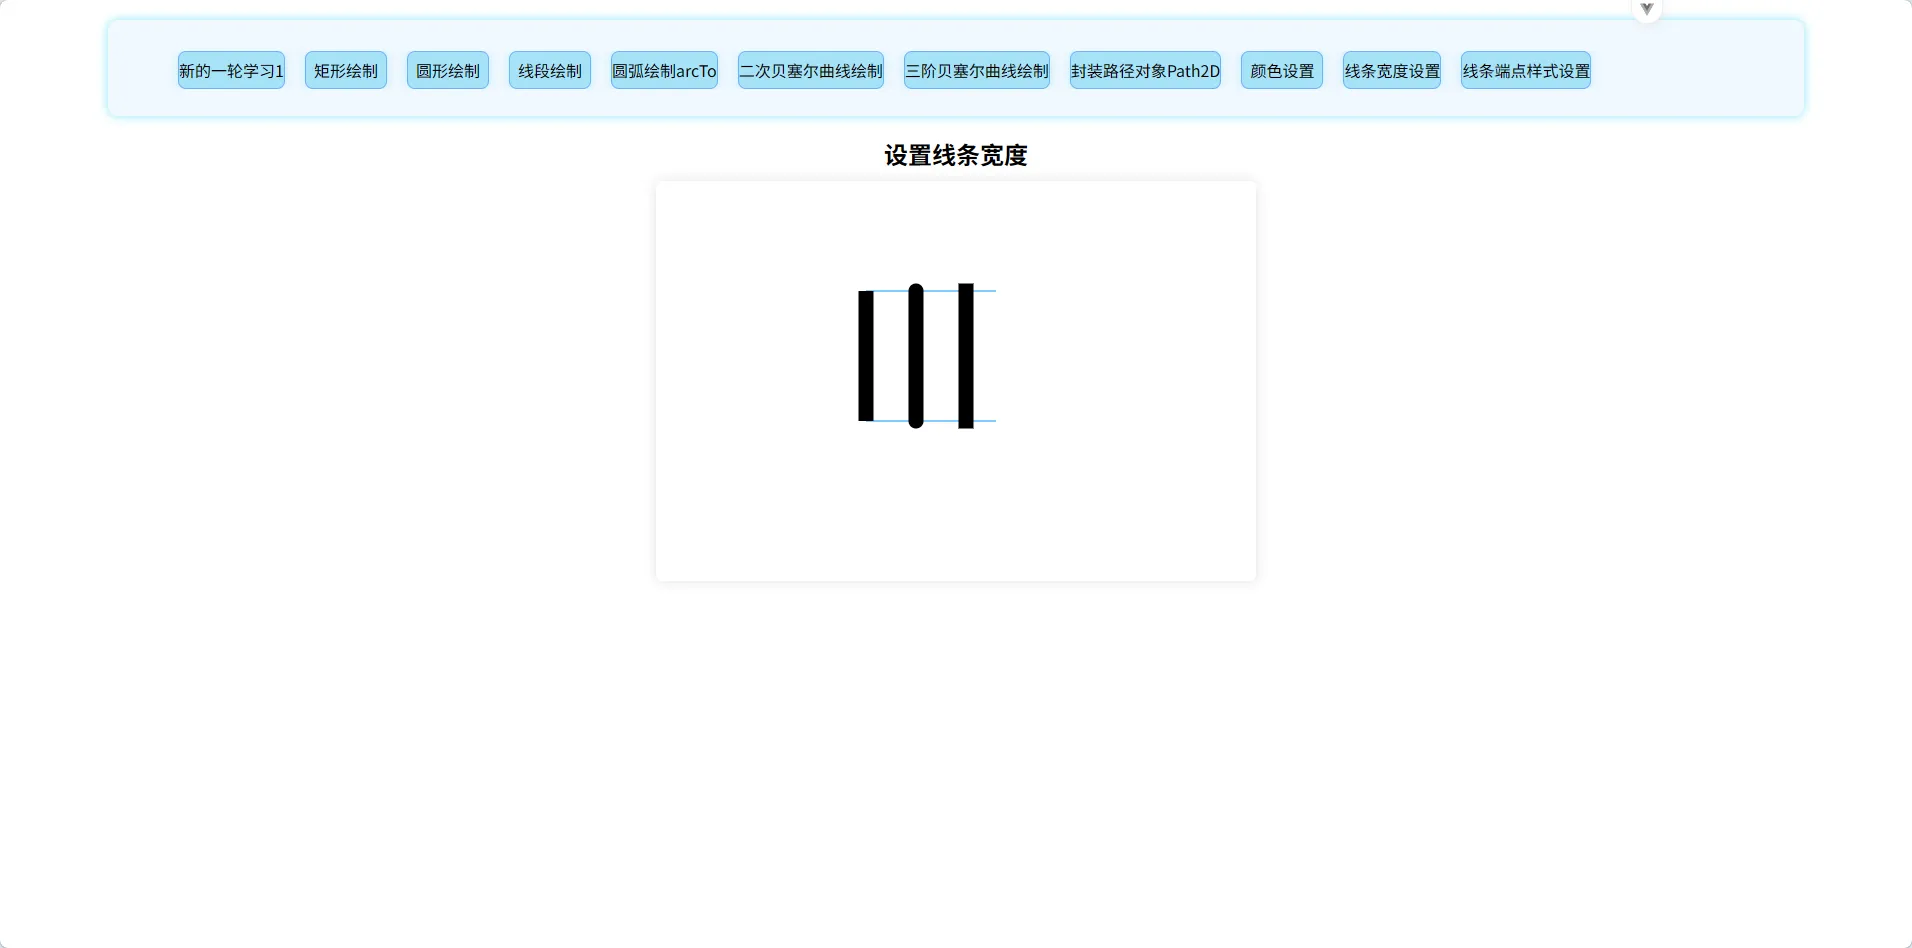
线条连接处样式设置:
方法:
ctx.lineJoin = 样式值
方法解析:
样式值取值:
round:外圆角连接样式,半径等于线宽
bevel:三角连接样式
miter:尖角连接样式(默认),即两线外延伸直至相交,故当角度偏小的时候会出现连接处偏移过大的情况,可以使用
miterLimit解决:
miterLimit:miterLimit 属性就是用来设定外延交点与连接点的最大距离,默认为 10.0
当实际距离大于 miterLimit 设置的值时,会以 miterLimit 为界限变为 bevel 样式的连接
示例:
javascript
<template>
  <P>设置线条连接处样式</P>
  <canvas id="can" ref="can" width="600" height="400px">
    <p>你的浏览器不支持canvas</p>
    <a href="https://www.google.com/chrome/" target="_blank">点击下载最新版浏览器</a>
  </canvas>
</template>

<script setup>
import { ref, onMounted } from "vue";
let can = ref(null);
onMounted(() => {
  function draw() {
    const ctx = can.value.getContext("2d");
    ctx.lineWidth = 10;
    ["round", "bevel", "miter"].forEach((lineJoin, i) => {
      ctx.lineJoin = lineJoin;
      ctx.beginPath();
      ctx.moveTo(205, 105 + i * 40);
      ctx.lineTo(235, 145 + i * 40);
      ctx.lineTo(275, 105 + i * 40);
      ctx.lineTo(315, 145 + i * 40);
      ctx.lineTo(355, 105 + i * 40);
      ctx.stroke();
    });
  }
  draw();
});
</script>

<style scoped>
* {
  padding: 0;
  margin: 0;
  box-sizing: border-box;
}
body {
  background-color: aliceblue;
}
#can {
  box-shadow: 0px 0px 12px rgba(0, 0, 0, 0.12);
  margin: auto;
  display: block;
  border-radius: 6px;
  background-color: white;
}
p {
  text-align: center;
  margin: 10px;
  font-size: 24px;
  font-weight: bold;
}
</style>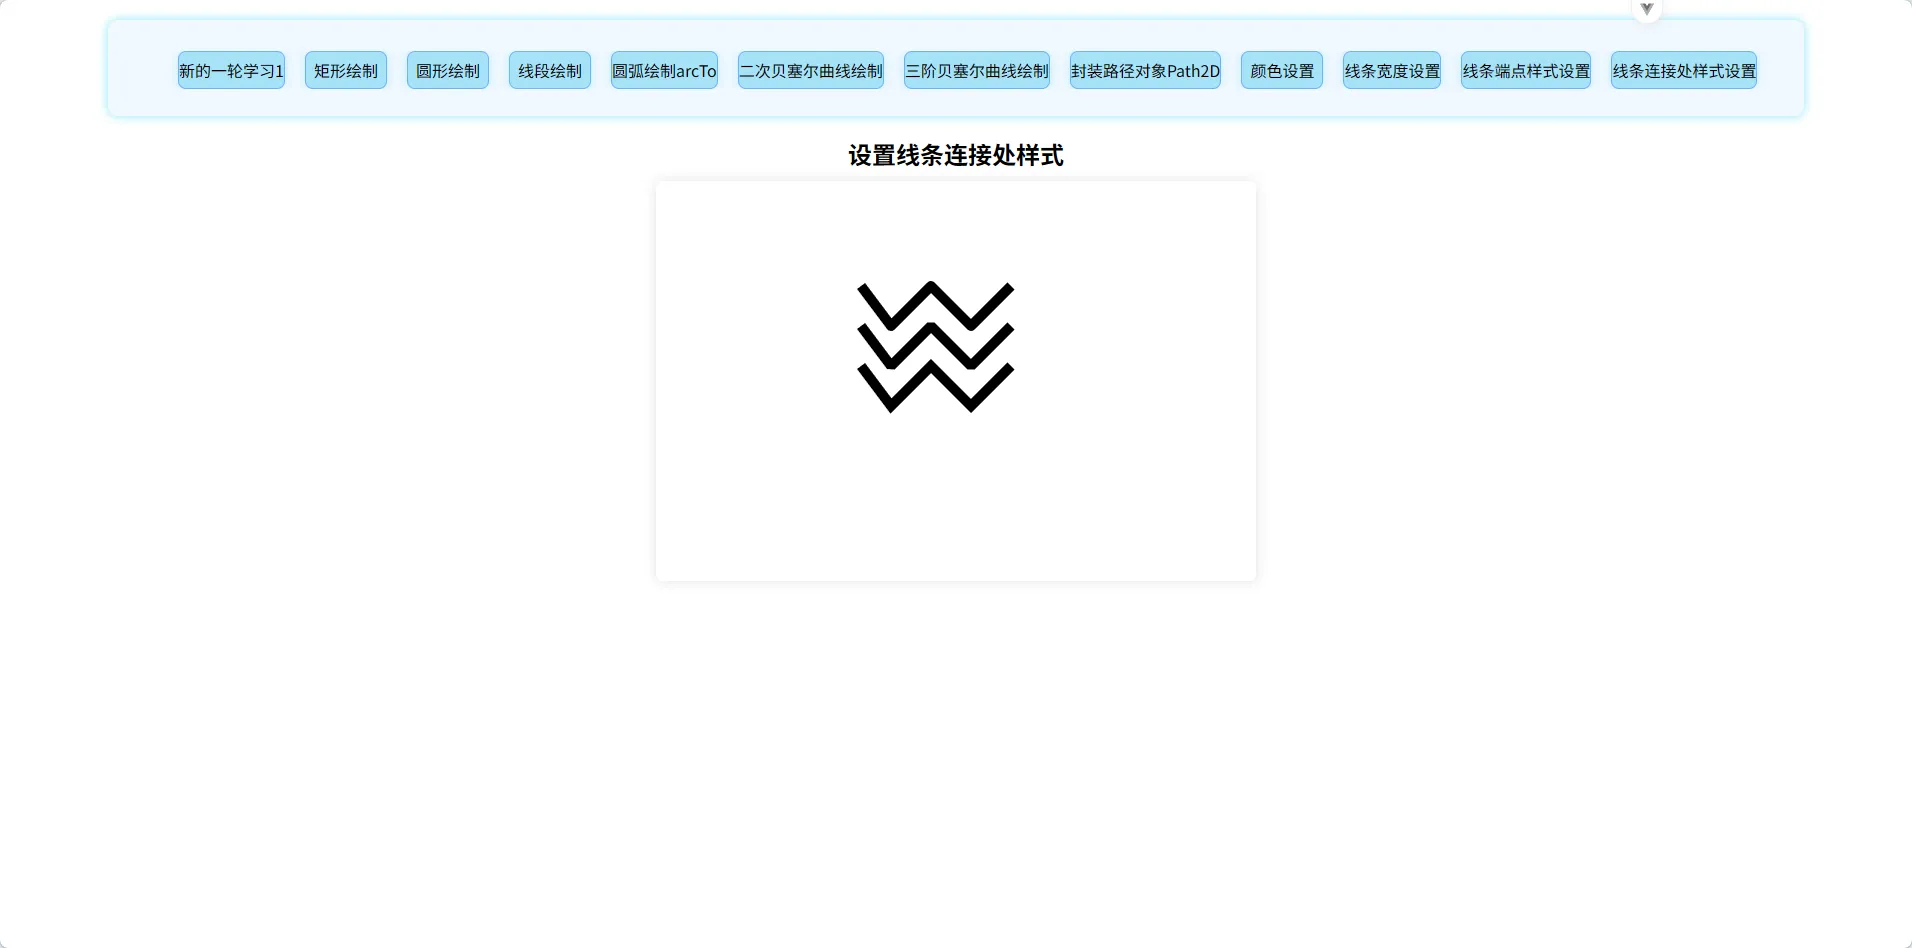
线条虚线设置:
方法:
ctx.setLineDash = 实线 1、空白 1、实线 2、空白 2....
ctx.lineDashOffset = 虚线首位偏移值
方法解析:
ctx.setLineDash = 实线 1、空白 1、实线 2、空白 2....:
设置虚线的样式,即实现段和空白线段的分布,根据数组里面的设置进行循环渲染
ctx.lineDashOffset = 虚线首位偏移值:
设置虚线的偏移值,偏移值是指左上角顺时针方向上的首位实现段的偏移值
示例:
javascript
<template>
  <P>虚线设置</P>
  <canvas id="can" ref="can" width="600" height="400px">
    <p>你的浏览器不支持canvas</p>
    <a href="https://www.google.com/chrome/" target="_blank">点击下载最新版浏览器</a>
  </canvas>
</template>

<script setup>
import { ref, onMounted } from "vue";
let can = ref(null);
onMounted(() => {
  let offset = 0;
  function draw() {
    const ctx = can.value.getContext("2d");

    ctx.clearRect(0, 0, 600, 400);
    ctx.beginPath();
    ctx.moveTo(50, 50);
    ctx.lineTo(300, 50);
    ctx.setLineDash([10, 5]);
    ctx.lineDashOffset = 0;
    ctx.stroke();

    ctx.moveTo(50, 100);
    ctx.lineTo(300, 100);
    ctx.setLineDash([5, 5]);
    ctx.lineDashOffset = 0;
    ctx.stroke();

    ctx.moveTo(50, 150);
    ctx.lineTo(300, 150);
    ctx.setLineDash([10, 5, 20, 5]);
    ctx.lineDashOffset = 0;
    ctx.stroke();
    ctx.closePath();

    ctx.beginPath();
    ctx.moveTo(50, 200);
    ctx.rect(50, 200, 150, 150);
    ctx.setLineDash([5, 4]);
    ctx.lineDashOffset = offset;
    ctx.stroke();
    ctx.closePath();
  }
  function offsetChange() {
    offset++;
    if (offset > 5) offset = 0;
    draw();
    setTimeout(offsetChange, 20);
  }
  offsetChange();
});
</script>

<style scoped>
* {
  padding: 0;
  margin: 0;
  box-sizing: border-box;
}
body {
  background-color: aliceblue;
}
#can {
  box-shadow: 0px 0px 12px rgba(0, 0, 0, 0.12);
  margin: auto;
  display: block;
  border-radius: 6px;
  background-color: white;
}
p {
  text-align: center;
  margin: 10px;
  font-size: 24px;
  font-weight: bold;
}
</style>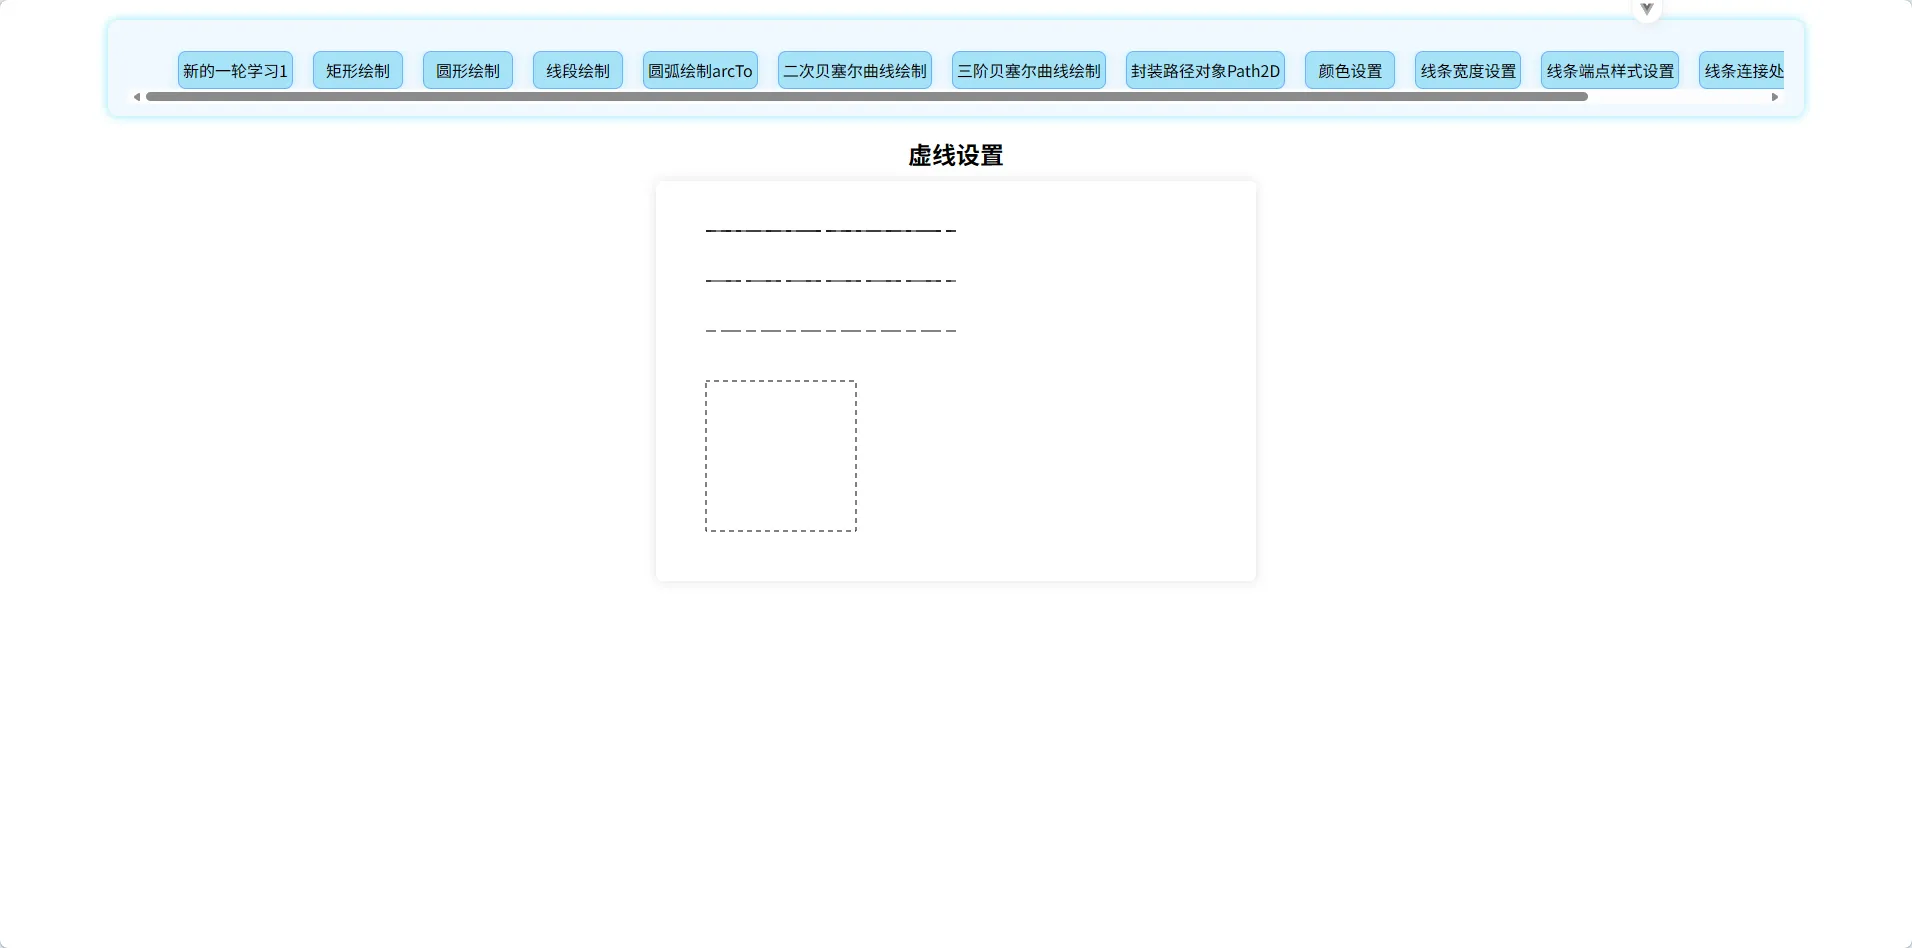
线性渐变设置:
方法:
const linerGradientObj = ctx.createLinearGradient(x1,y1,x2,y2) //创建线性渐变对象
linerGradientObj.addColorStop(position,color) // 给线性渐变对象添加颜色节点
方法解析:
const linerGradientObj = ctx.createLinearGradient(x1,y1,x2,y2):
从(x1,y1)到(x2,y2)方向实现渐变效果,范围也仅仅局限于这里:
当竖直方向渐变时只有 y1-y2 范围内有渐变效果
当水平方向渐变时只有 x1-x2 范围内有渐变效果
当 x1!=x2 且 y1!=y2 时渐变效果在(x1,y1)-(x2,y2)的矩形范围内生效,且方向为(x1,y1)指向(x2,y2)
linerGradientObj.addColorStop(position,color):
设置渐变颜色:
position:相对于渐变生效区间,值为 0-1
color:当前颜色节点的颜色
当 0-x 范围内 0 没有设置颜色,x 设置了颜色时,0-x 范围内都将显示 x 处第一个设置的颜色(纯色)
x-1 同理
使用:
先使用 createLinearGradinet 创建线性渐变对象,然后使用该对象的 addColorStop 方法设置渐变效果,最后将线性渐变对象作为 fillStyle/strokeStyle 的值使其生效(注意生效范围!!!)
示例:
javascript
<template>
  <P>线性渐变设置</P>
  <canvas id="can" ref="can" width="600" height="400">
    <p>你的浏览器不支持canvas</p>
    <a href="https://www.google.com/chrome/" target="_blank">点击下载最新版浏览器</a>
  </canvas>
</template>

<script setup>
import { ref, onMounted } from "vue";
let can = ref(null);
onMounted(() => {
  function draw() {
    const ctx = can.value.getContext("2d");

    // 创建渐变
    const linGrad = ctx.createLinearGradient(0, 0, 0, 400);
    linGrad.addColorStop(0, "#00ABEB");
    linGrad.addColorStop(0.5, "#fff");
    linGrad.addColorStop(0.5, "#26C000");
    linGrad.addColorStop(1, "#fff");

    const linGrad2 = ctx.createLinearGradient(0, 150, 0, 250);
    linGrad2.addColorStop(0.5, "#000");
    linGrad2.addColorStop(1, "rgb(0 0 0 / 0%)");

    // assign gradients to fill and stroke styles
    ctx.fillStyle = linGrad;
    ctx.strokeStyle = linGrad2;

    // 画图形
    ctx.fillRect(0, 0, 600, 400);
    ctx.strokeRect(250, 150, 100, 100);
  }
  draw();
});
</script>

<style scoped>
* {
  padding: 0;
  margin: 0;
  box-sizing: border-box;
}
body {
  background-color: aliceblue;
}
#can {
  box-shadow: 0px 0px 12px rgba(0, 0, 0, 0.12);
  margin: auto;
  display: block;
  border-radius: 6px;
  background-color: white;
}
p {
  text-align: center;
  margin: 10px;
  font-size: 24px;
  font-weight: bold;
}
</style>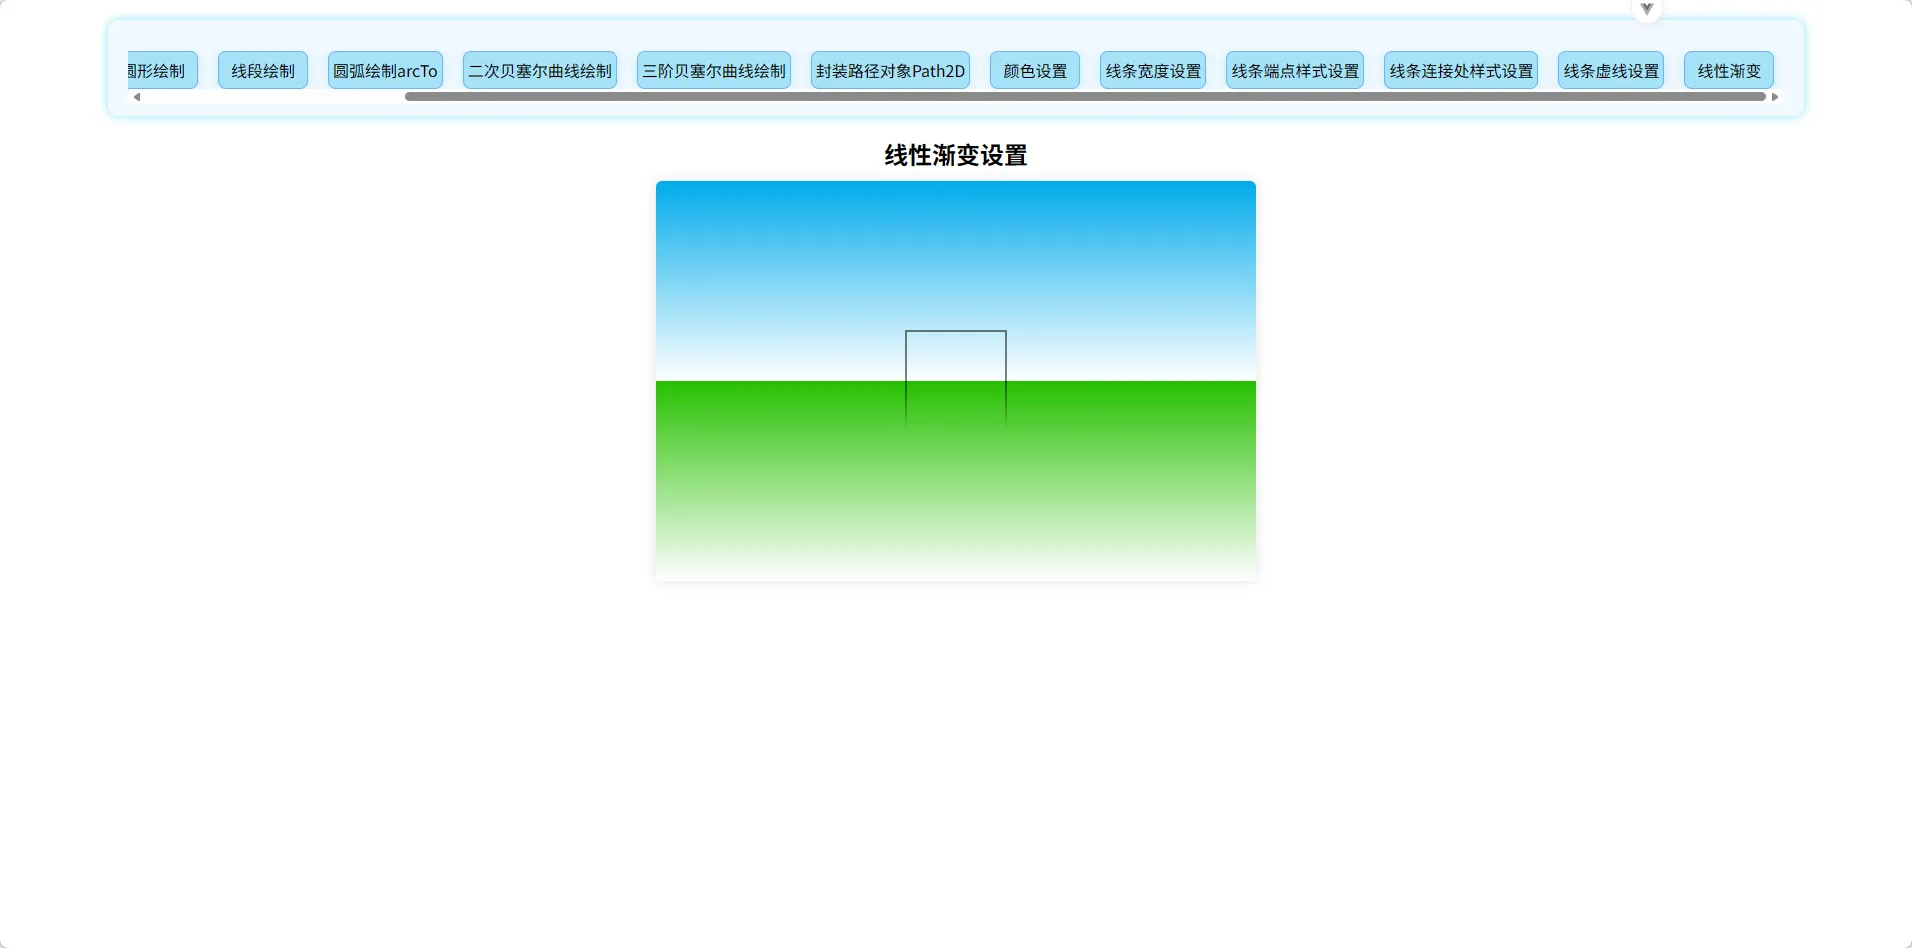
径向渐变设置:
方法:
const radiaGradientObj = ctx.createRadiaGradient(x1,y1,r1,x2,y2,r2)
radiaGradientObj.addColorStop(position,color)
方法解析:
const radiaGradientObj = ctx.createRadiaGradient(x1,y1,r1,x2,y2,r2):
创建一个径向渐变,范围为从以(x1,y1)为圆心、以 r1 为半径的圆 1 到以(x2,y2)为圆心、以 r2 为半径的圆 2,其中渐变是从圆 1 的边缘到圆 2 的内边(看下面)
radiaGradientObj.addColorStop(position,color):
设置颜色渐变,但相较于线性渐变不同的是:
对于 0 位置,其指内圆的颜色,纯色
对于 0-1(不含 0),其指内圆到外圆,即使 0.001 也不属于内圆,内圆仅 0 位置
故:对于内圆,一般设置半径为零,防止颜色变化不均
偏心光晕:
内圆和外圆的圆心不同即偏心光晕
使用:
赋值给 fillStyle,作为填充渐变样式
示例:
javascript
<template>
  <P>线性渐变设置</P>
  <canvas id="can" ref="can" width="150" height="150">
    <p>你的浏览器不支持canvas</p>
    <a href="https://www.google.com/chrome/" target="_blank">点击下载最新版浏览器</a>
  </canvas>
</template>

<script setup>
import { ref, onMounted } from "vue";
let can = ref(null);
onMounted(() => {
  function draw() {
    var ctx = can.value.getContext("2d");

    // 创建渐变
    var radgrad = ctx.createRadialGradient(45, 45, 10, 52, 50, 30);
    radgrad.addColorStop(0, "#A7D30C");
    radgrad.addColorStop(0.9, "#019F62");
    radgrad.addColorStop(1, "rgba(1,159,98,0)");

    var radgrad2 = ctx.createRadialGradient(105, 105, 20, 112, 120, 50);
    radgrad2.addColorStop(0, "#FF5F98");
    radgrad2.addColorStop(0.75, "#FF0188");
    radgrad2.addColorStop(1, "rgba(255,1,136,0)");

    var radgrad3 = ctx.createRadialGradient(95, 15, 15, 102, 20, 40);
    radgrad3.addColorStop(0, "#00C9FF");
    radgrad3.addColorStop(0.8, "#00B5E2");
    radgrad3.addColorStop(1, "rgba(0,201,255,0)");

    var radgrad4 = ctx.createRadialGradient(0, 150, 50, 0, 140, 90);
    radgrad4.addColorStop(0, "#F4F201");
    radgrad4.addColorStop(0.8, "#E4C700");
    radgrad4.addColorStop(1, "rgba(228,199,0,0)");

    // 画图形
    ctx.fillStyle = radgrad4;
    ctx.fillRect(0, 0, 150, 150);
    ctx.fillStyle = radgrad3;
    ctx.fillRect(0, 0, 150, 150);
    ctx.fillStyle = radgrad2;
    ctx.fillRect(0, 0, 150, 150);
    ctx.fillStyle = radgrad;
    ctx.fillRect(0, 0, 150, 150);
  }
  draw();
});
</script>

<style scoped>
* {
  padding: 0;
  margin: 0;
  box-sizing: border-box;
}
body {
  background-color: aliceblue;
}
#can {
  box-shadow: 0px 0px 12px rgba(0, 0, 0, 0.12);
  margin: auto;
  display: block;
  border-radius: 6px;
  background-color: white;
}
p {
  text-align: center;
  margin: 10px;
  font-size: 24px;
  font-weight: bold;
}
</style>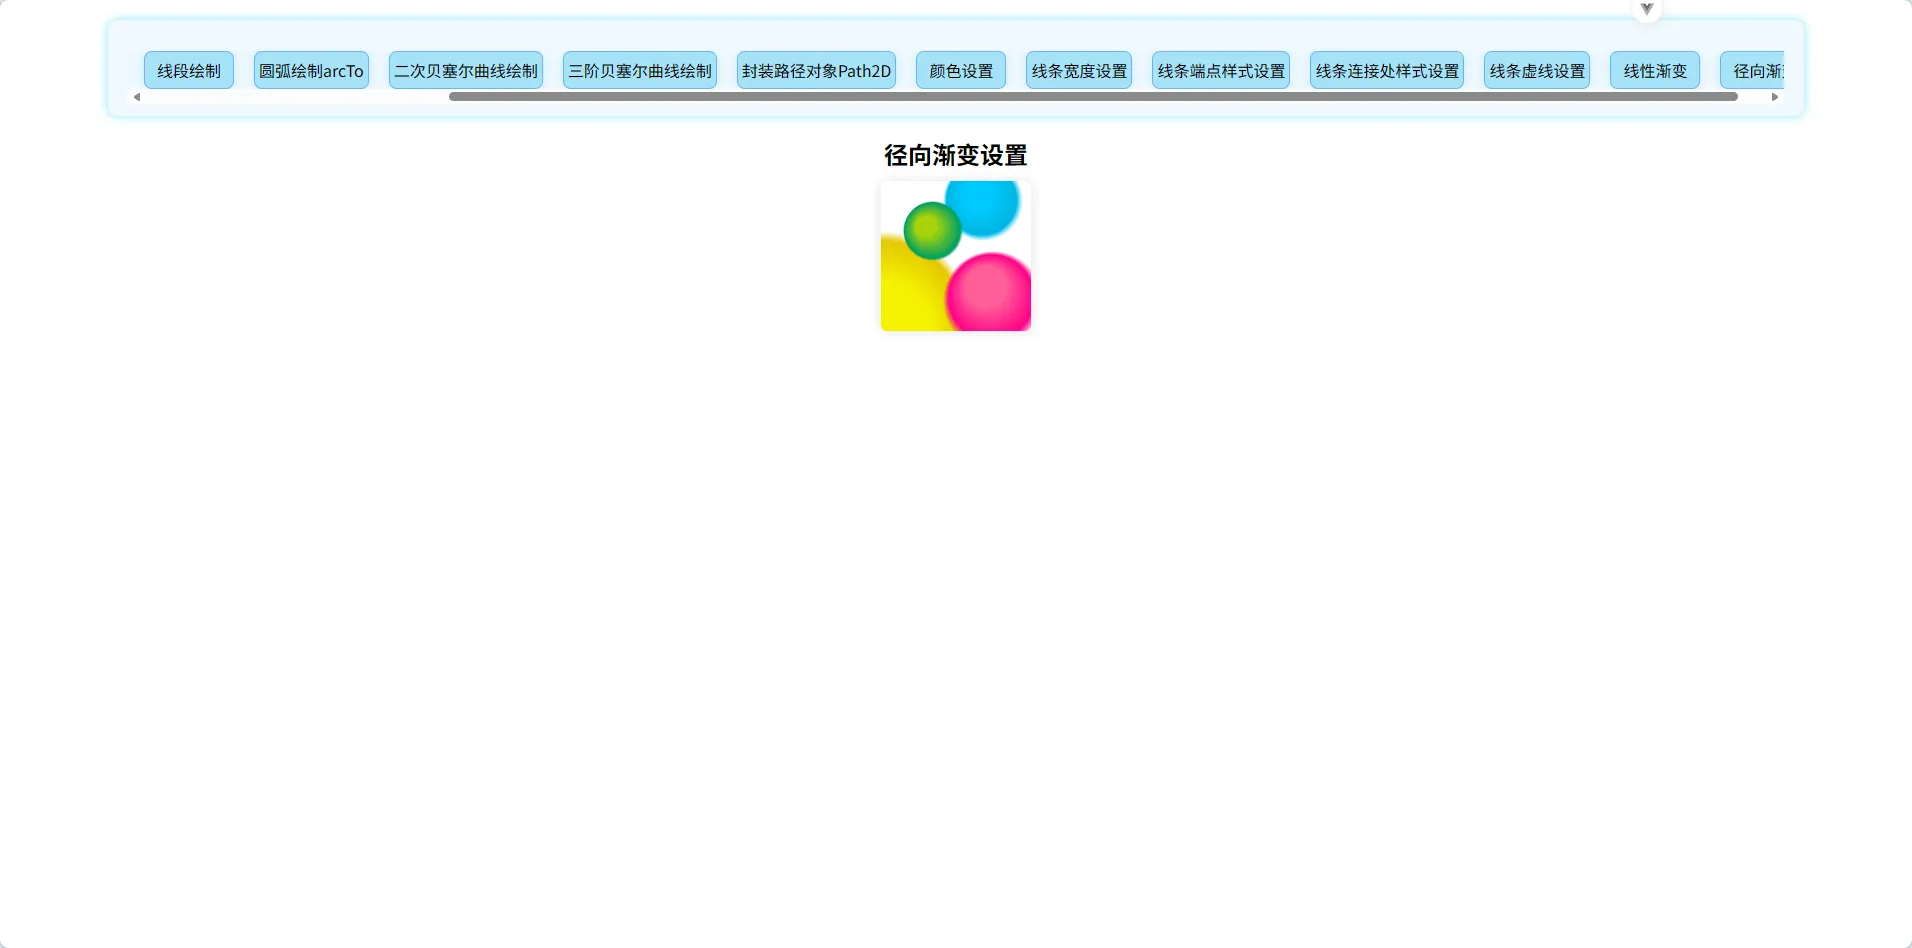
吐槽:csdn写博客的时候好难受啊,可选样式太少了,还都不是很好看,尤其是行高行间距,默认的真的不太好用,还有块引用,灰色的多了太丑了,建议可以自己换颜色,然后代码那里可以给代码块加标题 QaQ....