一、生成数据表
方法:
1.首先导入pandas库,一般都会用到numpy库,所以我们先导入备用
python
import numpy as np
import pandas as pd
2.导入csv或者xlsx文件
csv:纯文本格式,用逗号分隔字段,体积小、通用性强,但无数据类型和样式
xlsx:excel的压缩xml格式(zip包),支持多工作表、公式、格式、数据类型等,功能丰富但体积较大
python
# 方法一
df = pd.DataFrame(pd.read_csv('name.csv',header=1))
df = pd.DataFrame(pd.read_excel('name.xlsx'))

# 方法二
import pandas as pd
from collections import namedtuple

Item = namedtuple('Item','reply pv')
items = []

with codecs.open('reply.pv.07','r','utf-8') as f:
    for line in f:
        line_split = line.strip().split('\t')
        items.append(Item(line_split[0].strip(),line_split[1].strip()))

df = pd.DataFrame.from_records(items, columns=['reply','pv'])
3.用pandas创建数据表
python
df = pd.DataFrame(
       {"id":[1001, 1002, 1003, 1004, 1005, 1006],
        "date":pd.date_range('20130102', periods=6)
        "city":['Beijing', 'SH', 'guangzhou', 'Shenzhen', 'shanghai', 'BEIJING']
        "age":[23, 44, 54, 32, 34, 32],
        "category":['100-A', '100-B','110-A', '110-C','210-A','130-F'],
        "price":[1200, np.nan, 2133, 5433, np.nan, 4432]}),
        columns = ['id', 'date', 'city', 'age', 'category', 'price'])
实际应用:
场景:拿到切坡建房数据的 CSV 文件(18.8万条),或者从数据库导出的传感器数据(300G太大,通常抽样部分)。
用到的Pandas操作:用 pd.read_csv 加载了切坡建房的 CSV 数据
二、数据表信息查看
方法:
1.维度查看
python
df.shape2.数据表基本信息(维度、列名称、数据格式、所占空间等)
python
df.info()3.每一列数据的格式
python
df.dtypes4.某一列格式
python
df['B'].dtype5.空值
python
df.isnull()6.查看某一列空值
python
df['B'].isnull()7.查看某一列的唯一值
python
df['B'].unique()8.查看数据表的值
python
df.values9.查看列名称
python
df.columns10.查看前5行数据、后5行数据
python
# 默认前5行数据
df.head()

# 默认后5行数据
df.tail()
实际应用:
场景:拿到切坡建房数据的 CSV 文件(18.8万条),或者从数据库导出的传感器数据(300G太大,通常抽样部分)。
用到的Pandas操作:用 .head(),.info(),.describe() 快速了解数据概览,.shape 查看行数列数。用 .info() 发现经度、纬度字段存在大量空值,用 .describe() 看到经度最小值出现了-300多度,明显异常。
三、数据表清洗
方法:
1.用数字0填充空值
python
df.fillna(value = 0)2.使用列price的均值对NA进行填充
python
df['price'].fillna(df['price'].mean())3.大小写转换
python
df['city'] = df['city'].str.lower()4.清除city字段的字符空格
python
df['city'] = df['city'].map(str.strip)5.更改数据格式
python
df['price'].astype('int')6.更改列名称
python
df.rename(columns = {'category': 'category-size'})7.删除"后出现"的重复值
python
df['city'].drop_duplicates()8.删除"先出现"的重复值
python
df['city'].drop_duplicates(keep = 'last')9.数据替换
python
df['city'].replace('sh', 'shanghai')实际应用:
场景:切坡建房表中"房屋结构"字段有缺失,监测数据中某些设备字段为空。
用到的Pandas操作:用 .isnull().sum() 统计每列缺失数;"房屋结构"字段缺失率超过30%,就用 .fillna(value) 填充(如用"未知"填充房屋结构);而对于经度缺失的行,因为无法定位,直接用 .dropna() 删除(如果某行关键字段缺失严重)。
四、数据预处理
方法:
python
df1 = pd.DataFrame({"id":[1001, 1002, 1003, 1004, 1005, 1006, 1007, 1008],
                    "gender":['male', 'female', 'male', 'female', 'male', 'female', 'male', 'female'],
                    "pay":['Y', 'N', 'Y', 'Y', 'N', 'Y', 'N', 'Y'],
                    "m-point":[10, 12, 20, 40, 40, 40, 30, 20]})
1.数据表合并
1.1 merge
python
# 匹配合并,交集
df_inner = pd.merge(df, df1, how = 'inner')

# 匹配合并,并集
df_outer = pd.merge(df, df1, how = 'outer')

df_left = pd.merge(df, df1, how = 'left')

df_right = pd.merge(df, df1, how = 'right')
1.2 append
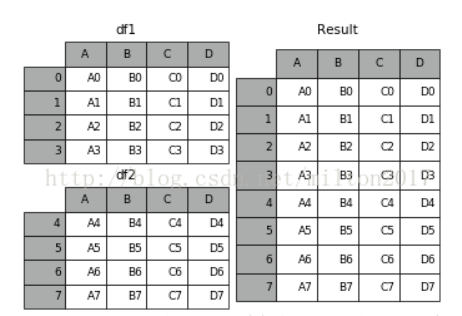
python
result = df1.append(df2)1.3 join
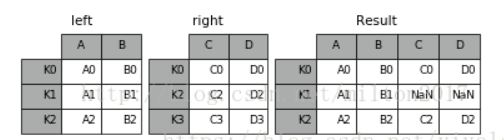
python
result = left.join(right, on = 'key')1.4 concat
python
pd.concat(
          # 要拼接的多个 DataFrame/Series 的序列
          objs,
          # 拼接方向,0为纵向(行方向堆叠),1为横向(列方向并排)
          axis = 0,
          # 索引对齐方式,'outer' 取并集,'inner' 取交集
          join = 'outer',
          # 旧版中指定保留哪些索引,现用 join='outer' + 索引切片替代
          join_axes = None,
          # 是否忽略原索引,True 则生成 0,1,2... 新索引
          ignore_index = False,
          # 在最外层创建多级索引,区分数据来自哪个对象
          keys = None,
          # 指定多级索引的层级具体取值
          levels = None,
          # 为多级索引的层级命名
          names = None,
          # 检查新索引是否有重复,True 时若有重复会报错
          verify_integrity = False,
          # 是否复制数据,True 保证独立新对象;False 尽量用视图
          copy = True)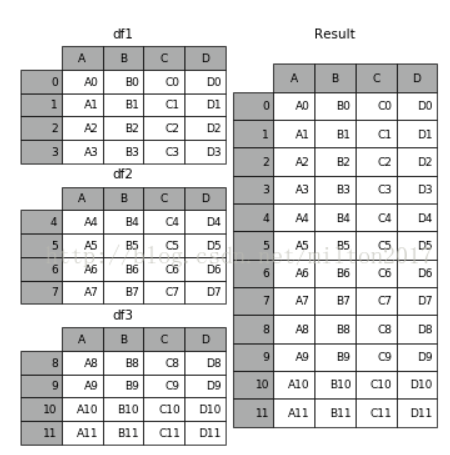
python
frames = [df1, df2, df3]
result = pd.concat(frames)
2.设置索引例
python
df_inner.set_index('id')3.按照特定列的值排序
python
df_inner.sort_values(by = ['age'])4.按照索引列排序
python
df_inner.sort_index()5.若price列的值>3000,group列显示high,否则显示low
python
df_inner['group'] = np.where(df_inner['price'] > 3000, 'high', 'low')6.对复合多个条件的数据进行分组标记
python
df_inner.loc[(df_inner['city'] == 'beijing') & (df_inner['price'] >= 4000), 'sign']7.对category字段的值依次进行分列,并创建数据表,索引值为df_inner的索引列,列名称为category和size
python
pd.DataFrame((x.split('-') for x in df_inner['category']), index = df_inner.index, columns = ['category', 'size'])8.将完成分裂后的数据表和原df_inner数据表进行匹配
python
df_inner = pd.merge(df_inner, split, right_index=True, left_index=True)实际应用:
场景 :风险防范区表(yzt_risk_prevention_zj)和监测设备表(tbl_jc_monitorpointinfo)需要通过 num 和 risk_prevention_num 关联,找出没有关联设备的防范区。
用到的操作:
python
pd.merge(df1, df2, left_on='num', right_on='risk_prevention_num', how='left')然后筛选 isnull() 得到未关联的记录
用 pd.merge 把防范区表和监测设备表左连接,然后筛选出 monitorpointcode 为空的记录,发现大约有15%的防范区没有关联任何监测设备。我把这个结果反馈给了业务方,他们补充了关联关系。
五、数据提取
主要用到的三个函数:loc,ilox,ix
loc:按标签值进行提取
iloc:按位置进行提取
ix:可以同时按照标签和位置进行提取
1.按索引提取单行的数值
python
df_inner.loc[3]2.按索引提取区域行数值
python
df_inner.iloc[0:5]3.重设索引
python
df_inner.reset_index()4.设置日期为索引
python
df_inner = df_inner.set_index('date')5.提取4日之前的所有数据
python
df_inner[:'2013-01-04']6.使用iloc按位置区域提取数据
python
# 冒号前后的数字不再是索引的标签名称,而是数据所在的位置
# 从0开始前三行 前两列
df_inner.iloc[:3, :2]
7.使用iloc按位置单独提取数据
python
# 提取第0 2 5行 4 5列
df_inner.iloc[[0, 2, 5], [4, 5]]
8.使用ix按索引标签和位置混合提取数据
python
# 2013-01-03号之前,前四列数据
df_inner.ix[:'2013-01-03', :4]
9.判断city列的值是否为北京
python
df_inner['city'].isin(['beijing'])10.判断city列里是否包含beijing和shanghai,然后将符合条件的数据提取出来
python
df_inner.loc[df_inner['city'].isin(['beijing', 'shanghai'])]11.提取前三个字符,并生成数据表
python
pd.DataFrame(df_inner['category'].str[:3])六、数据筛选
方法:
使用与、或、非三个条件配合大于、小于、等于对数据进行筛选,并进行计数和求和
1.使用"与"进行筛选
python
df_inner.loc[(df_inner['age'] > 25) & (df_inner['city'] == 'beijing'), ['id','city','age','category','gender']]2.使用"或"进行筛选
python
df_inner.loc[(df_inner['age'] > 25) | (df_inner['city'] == 'beijing'), ['id','city','age','category','gender']].sort(['age']) 3.使用"非"条件进行筛选
python
df_inner.loc[(df_inner['city'] != 'beijing'), ['id','city','age','category','gender']].sort(['id']) 4.对筛选后的数据按city列进行计数
python
df_inner.loc[(df_inner['city'] != 'beijing'), ['id','city','age','category','gender']].sort(['id']).city.count()5.使用query函数进行筛选
python
df_inner.query('city == ["beijing", "shanghai"]')6.对筛选后的结果按price进行求和
python
df_inner.query('city == ["beijing", "shanghai"]').price.sum()实际应用:
场景 :传感器数据中的经度值应该在73~135之间,纬度3~53之间;降雨量不能为负。
用到的操作:
条件筛选找到异常
python
df[(df['lon'] < 73) | (df['lon'] > 135)]使用 .loc 定位并修改;np.where() 或直接布尔索引替换
写了一个过滤条件,筛选出经度超出中国范围的记录,大概有200多条。确认是录入错误后,用中位数或相邻站点的平均值做了替换
七、数据汇总
方法:
主要函数是groupby和pivote_table
groupby:按指定列分组后,对每组独立进行聚合或转换操作
pivot_table:像 Excel 透视表一样,按行列维度重塑数据并聚合值
1.对所有的列进行计数汇总
python
df_inner.groupby('city').count()2.按城市对id字段进行计数
python
df_inner.groupby('city')['id'].count()3.对两个字段进行汇总计数
python
df_inner.groupby(['city','size'])['id'].count()4.对city字段进行汇总,并分别计算prince的合计和均值
python
df_inner.groupby('city')['price'].agg([len,np.sum, np.mean]) 实际应用:
场景 :按地市统计风险防范区数量;按设备类型统计平均降雨量。
用到的操作:
python
df.groupby('column')['value'].agg(['count', 'mean', 'sum']).reset_index() 把分组结果转回 DataFrame
需要统计每个地市的风险防范区数量,就用 groupby('area_code').size() 快速得到。另外为了分析不同类型传感器的异常率按 device_type 分组后计算了空值比例。
八、数据统计
数据采样,计算标准差,协方差和相关系数
1.简单的数据采样
python
df_inner.sample(n=3) 2.手动设置采样权重
python
weights = [0, 0, 0, 0, 0.5, 0.5]
df_inner.sample(n=2, weights=weights)
3.采样后不放回
python
df_inner.sample(n=6, replace=False) 4.采样后放回
python
df_inner.sample(n=6, replace=True)5.数据表描述性统计
python
# round函数设置显示小数位,T表示转置
df_inner.describe().round(2).T
6.计算列的标准差
python
df_inner['price'].std()7.计算两个字段间的协方差
python
df_inner['price'].cov(df_inner['m-point']) 8.数据表中所有字段间的协方差
python
df_inner.cov()9.两个字段的相关性分析
python
# 相关系数在-1到1之间,接近1为正相关,接近-1为负相关,0为不相关
df_inner['price'].corr(df_inner['m-point'])
10.数据表的相关性分析
python
df_inner.corr()九、数据输出
方法:
分析后的数据可以输出为xlsx格式和csv格式
1.写入Excel
python
df_inner.to_excel('excel_to_python.xlsx', sheet_name='bluewhale_cc') 2.写入csv
python
df_inner.to_csv('excel_to_python.csv') 实际应用:
场景 :清洗后的数据需要写回CSV或导入数据库。
用到的操作:
python
df.to_csv('clean_data.csv', index=False)处理完的数据保存成新的CSV,再通过数据中台的库表导入任务加载到数仓中