提示:本文原创作品,良心制作,干货为主,简洁清晰,一看就会
文章目录
- 前言
- 一、环境介绍
- 二、运行Nginx/Mysql/Redis/Docker/Rabbitmq服务
- 三、安装各类exporter
- 四、exporter地址
- 五、修改prometheus配置
- 六、添加触发器
- 七、Grafana导入dashboard监控模版
前言
在当下运维工作中,服务器与各类中间件运行状态把控尤为重要。传统人工巡检效率低、无法及时发现故障,难以满足业务稳定运行需求。本文基于Prometheus监控体系,结合对应Exporter组件,实战讲解Nginx、MySQL、Redis、Docker、RabbitMQ主流服务监控部署流程,搭配可视化面板实现数据实时采集、指标查看与异常预警,助力运维人员快速掌握服务状态,高效排查问题,保障业务平稳运行
一、环境介绍
| 主机名 | ip地址 | 服务 | 备注 |
|---|---|---|---|
| prometheus | 192.168.13.141 | docker、docker-compose、prometheus、alertmanager、node-exporter、grafana | 监控端,已安装 |
| ubuntu | 192.168.13.142 | docker、docker-compose、 | 被监控端,未安装 |
关于监控端的服务我已经安装好了,prometheus有两种安装方式:二进制安装和docker安装 ,本次实验使用的容器安装的,后续被监控端我也统一使用容器部署,大家可以自行选择
关于监控端的服务如何安装,这里不在赘述,有不懂的同学可以查看此篇文章
Prometheus二进制安装:https://blog.csdn.net/m0_63756214/article/details/161196428?spm=1001.2014.3001.5501
Prometheus容器安装:https://blog.csdn.net/m0_63756214/article/details/161225636?spm=1001.2014.3001.5501
被监控端的docker和docker-compose的安装可以参考此篇文章的2.1和2.2小节
https://blog.csdn.net/m0_63756214/article/details/161240598?spm=1001.2014.3001.5501
二、运行Nginx/Mysql/Redis/Docker/Rabbitmq服务
要监控Nginx/Mysql/Redis/Docker/Rabbitmq等服务,首先是被监控端有这些服务,我们才能去监控数据
为了方便教学,我这里会用容器运行Nginx/Mysql/Redis/Docker/Rabbitmq服务
yaml
## 1. 创建各容器的映射目录
root@ubuntu:~# mkdir -p /data/redis/data /data/nginx/{conf.d,html,log} /data/rabbitmq/{data,log} /data/mysql/{conf,data}
root@ubuntu:~# ls /data/
mysql  nginx  rabbitmq  redis

## 2. stub_status是nginx给prometheus暴露监控数据的 "数据接口",没有它,nginx_exporter 就拿不到任何监控指标
## 所以nginx需要开启stub_status,我们需要把子配置文件挂载到容器中
root@ubuntu:~# vim /data/nginx/conf.d/server.conf
server {
    listen       80;
    server_name  localhost;

    location / {
        root   /usr/share/nginx/html;
        index  index.html index.htm;
    }

   location /stub_status {
        stub_status on;
        access_log off;
        #allow nginx_export的ip;
        allow 0.0.0.0/0;
        deny all;
    }

    error_page   500 502 503 504  /50x.html;
    location = /50x.html {
        root   /usr/share/nginx/html;
    }
}
yaml
## 运行Nginx/Mysql/Redis/Docker/Rabbitmq容器
root@ubuntu:~# cd /data/
root@ubuntu:/data# vim docker-compose.yaml
version: '3.8'

services:
  # 运行redis容器
  redis:
    image: redis:6.2.7
    container_name: redis
    command: redis-server --requirepass 'Qing@123456' --maxmemory 512mb --appendonly yes
    restart: always
    volumes:
      - /data/redis/data:/data
    ports:
      - "6379:6379"
    healthcheck:
      test: ["CMD", "redis-cli", "--raw", "incr", "ping"]
      interval: 10s
      timeout: 3s
      retries: 3

 # 运行nginx容器
  nginx:
    image: nginx:1.25
    container_name: nginx
    restart: always
    volumes:
      - /data/nginx/conf.d:/etc/nginx/conf.d
      - /data/nginx/html:/usr/share/nginx/html
      - /data/nginx/log:/var/log/nginx
    ports:
      - "80:80"
    healthcheck:
      test: ["CMD", "curl", "-f", "http://localhost/"]
      interval: 10s
      timeout: 3s
      retries: 3

 # 运行rabbitmq容器,适用于3.8版本以上
  rabbitmq:
    image: rabbitmq:3.13-management
    container_name: rabbitmq
    restart: always
    volumes:
      - /data/rabbitmq/data:/var/lib/rabbitmq
      - /data/rabbitmq/log:/var/log/rabbitmq
    ports:
      - "5672:5672"
      - "15672:15672"   # RabbitMQ 管理界面 HTTP 端口
      - "15692:15692"  # Prometheus 指标暴露端口(官方插件专用),后续不用安装exporter
    # 容器启动命令,启动管理插件和prometheus插件,然后启动服务
    command: sh -c "rabbitmq-plugins enable rabbitmq_management rabbitmq_prometheus && rabbitmq-server"
    healthcheck:
      test: ["CMD", "rabbitmq-diagnostics", "ping"]
      interval: 10s
      timeout: 5s
      retries: 3

 # 运行mysql容器
  db:
    image: mysql:8.0
    restart: always
    container_name: mysql
    environment:
      TZ: Asia/Shanghai
      LANG: en_US.UTF-8
      MYSQL_ROOT_PASSWORD: Qing@123456
    command:
      --default-authentication-plugin=mysql_native_password
      --character-set-server=utf8mb4
      --collation-server=utf8mb4_general_ci
      --lower_case_table_names=1
      --performance_schema=1
      --sql-mode=""
      --skip-log-bin
    volumes:
      - /data/mysql/conf:/etc/mysql/conf.d
      - /data/mysql/data:/var/lib/mysql
    ports:
      - "3306:3306"
    healthcheck:
      test: ["CMD", "mysqladmin", "ping", "-h", "localhost", "-pQing@123456"]
      interval: 10s
      timeout: 3s
      retries: 5
root@ubuntu:/data# docker-compose up -d
yaml
## 因为stub_status是nginx内置的状态数据输出功能,而这个功能必须通过--with-http_stub_status_module模块编译才能开启
## 没有这个模块,nginx根本无法输出任何状态信息,监控就完全失效
## 这个模块默认都是存在的,以防万一我们可以检查一下
root@ubuntu:/data# docker exec -it nginx /bin/bash
root@d74099a7799c:/# nginx -V 2>&1 | grep -o with-http_stub_status_module
with-http_stub_status_module
root@d74099a7799c:/# exit
exit
root@ubuntu:/data# curl 192.168.13.142/stub_status
Active connections: 1
server accepts handled requests
 557 557 557
Reading: 0 Writing: 1 Waiting: 0
三、安装各类exporter
在上面我们运行了各类服务的容器
针对mysql容器,我们需要进入mysql创建一个用户,这个 用户是用来监控 MySQL 的,它只需要看状态、看指标;不需要删库、不需要改表、不需要权限
这里不建议用root用户,root用户权限过高不安全
yaml
root@ubuntu:/data# docker exec -it mysql /bin/bash
bash-5.1# mysql -uroot -p'Qing@123456'

Type 'help;' or '\h' for help. Type '\c' to clear the current input statement.

mysql> create user 'exporter'@'%' identified by 'Qing@123456';

mysql> grant process,replication client,select on *.* to 'exporter'@'%';

mysql> exit
Bye
bash-5.1# exit
exit
root@ubuntu:/data#
下面我们需要在被监控端安装上各类服务的exporter(rabbitmq特殊,rabbitmq 3.8版本以上可以直接安装prometheus插件,无需安装对应的exporter就可以采集到监控数据)
exporter把各类软件原生状态数据,转成 Prometheus 能识别的标准监控指标,对外暴露 /metrics 接口供抓取 无 Exporter → Prometheus 抓不到任何业务组件监控数据
yaml
root@ubuntu:/data# mkdir prometheus
root@ubuntu:/data# cd prometheus/
root@ubuntu:/data/prometheus# vim docker-compose.yaml
version: '3.8'

services:
  # nginx 监控指标导出器
  nginx_exporter:
    image: nginx/nginx-prometheus-exporter
    container_name: nginx_exporter
    # 指定要监控的nginx状态地址
    command:
      - '-nginx.scrape-uri=http://192.168.13.142/stub_status'
    restart: always
    ports:
      - "9113:9113"

 # redis 监控指标导出器
  redis_exporter:
    image: oliver006/redis_exporter
    container_name: redis_exporter
    restart: always
    # redis exporter支持环境变量传密码,所以可以直接写到yaml文件中
    environment:
      - REDIS_ADDR=192.168.13.142:6379
      - REDIS_PASSWORD=Qing@123456
    ports:
      - "9121:9121"

 # mysql 监控指标导出器
  mysqld-exporter:
    image: prom/mysqld-exporter
    container_name: mysqld-exporter
    restart: always
    # 开启需要的mysql监控指标+指定配置文件
    command:
      - '--collect.info_schema.processlist'
      - '--collect.info_schema.innodb_metrics'
      - '--collect.info_schema.tablestats'
      - '--collect.info_schema.tables'
      - '--collect.info_schema.userstats'
      - '--collect.engine_innodb_status'
      - '--config.my-cnf=/my.cnf'
    # 主机中的my.cnf文件里面是mysql的地址账号密码,MySQL exporter不推荐环境变量传密码,所以只能写到文件中
    volumes:
      - ./my.cnf:/my.cnf
    ports:
      - "9104:9104"

 # docker 容器状态监控
  cadvisor:
    image: google/cadvisor:latest
    container_name: cadvisor
    restart: always
    # 挂载系统目录,让cadvisor采集docker系统状态
    volumes:
      - /:/rootfs:ro
      - /var/run:/var/run:ro
      - /sys:/sys:ro
      - /var/lib/docker:/var/lib/docker:ro
    ports:
      - "8080:8080"
yaml
# 由于我们没有在刚才的docker-compose.yaml中设置mysql的地址账号密码
# mysqld_exporter 目前不知道 mysql的地址账号密码,所以需要在同目录下创建my.cnf
root@ubuntu:/data/prometheus# vim my.cnf
[client]
host=192.168.13.142
user=exporter
password=Qing@123456
port=3306
root@ubuntu:/data/prometheus#
root@ubuntu:/data/prometheus# docker-compose up -d
四、exporter地址
安装好exporter后会暴露一个http://ip:端口/metrics的HTTP服务
大家可以在浏览器上访问,每个网页都对应着不同exporter的监控样本数据
| 名称 | 地址 |
|---|---|
| nginx_exporter | http://192.168.13.142:9113/metrics |
| redis_exporter | http://192.168.13.142:9121/metrics |
| rabbitmq_exporter | http://192.168.13.142:15692/metrics |
| mysql_exporter | http://192.168.13.142:9104/metrics |
| cadvisor | http://192.168.13.142:8080/metrics |
五、修改prometheus配置
接下来我们需要在监控端修改prometheus.yml去拉取exporter的监控样本数据
yaml
root@prometheus:~# vim /opt/prometheus/prometheus/prometheus.yml
# 在scrape_configs块下新增了一些job
scrape_configs:
  - job_name: 'prometheus'
    # 覆盖全局默认值,每15秒从该作业中刮取一次目标
    scrape_interval: 15s
    static_configs:
    - targets: ['localhost:9090']
  - job_name: 'alertmanager'
    scrape_interval: 15s
    static_configs:
    - targets: ['alertmanager:9093']
  - job_name: 'cadvisor'
    scrape_interval: 15s
    static_configs:
    - targets: ['cadvisor:8080']
      labels:
        instance: Prometheus服务器
     # 新增,prometheus拉取被监控端docker的监控数据
    - targets: ['192.168.13.142:8080']
      labels:
        instance: Linux服务器

  - job_name: 'node-exporter'
    scrape_interval: 15s
    static_configs:
    - targets: ['node_exporter:9100']
      labels:
        instance: Prometheus服务器
    - targets: ['192.168.13.142:9100']
      labels:
        instance: Linux服务器
   # 新增,prometheus拉取被监控端nginx-exporter的监控数据
  - job_name: 'nginx-exporter'
    scrape_interval: 15s
    static_configs:
    - targets: ['192.168.13.142:9113']
      labels:
        instance: Linux服务器
   # 新增,prometheus拉取被监控端redis-exporter的监控数据
  - job_name: 'redis-exporter'
    scrape_interval: 15s
    static_configs:
    - targets: ['192.168.13.142:9121']
      labels:
        instance: Linux服务器
   # 新增,prometheus拉取被监控端mysql-exporter的监控数据
  - job_name: 'mysql-exporter'
    scrape_interval: 15s
    static_configs:
    - targets: ['192.168.13.142:9104']
      labels:
        instance: Linux服务器
   # 新增,prometheus拉取被监控端rabbitmq的监控数据
  - job_name: 'rabbitmq-exporter'
    scrape_interval: 15s
    static_configs:
    - targets: ['192.168.13.142:15692']
      labels:
        instance: Linux服务器
yaml
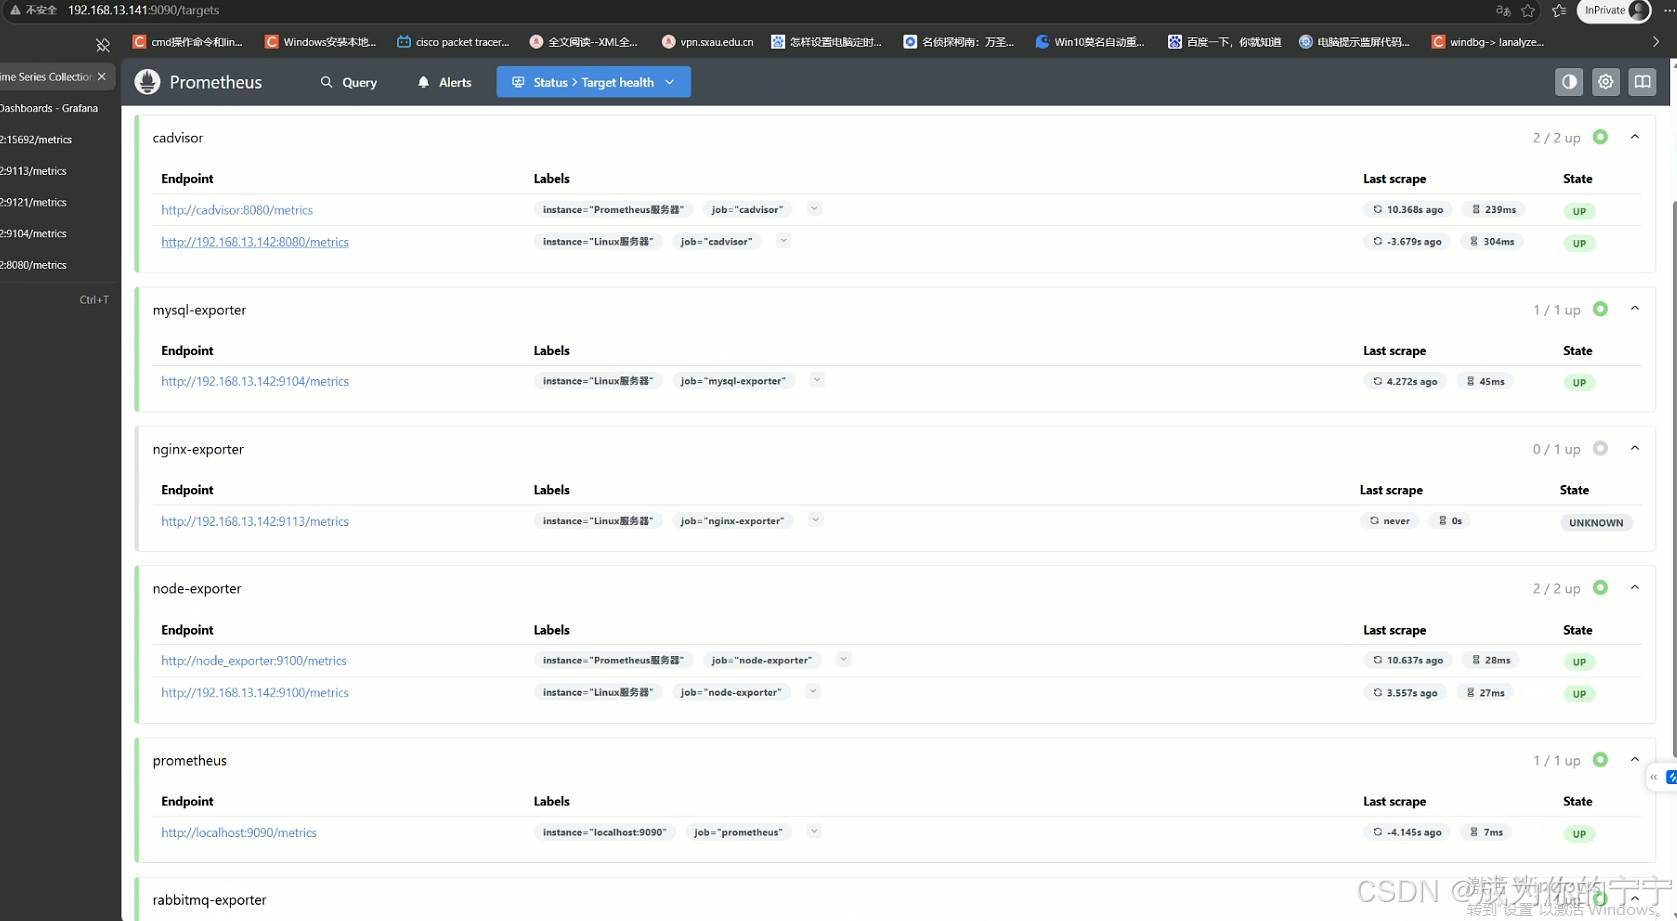
## 热加载prometheus配置
root@prometheus:~# curl -X POST http://localhost:9090/-/reload浏览器访问监控端 ip:9090prometheus的页面,可以看到exporter的状态都正常
六、添加触发器
我这里只是提供一些触发器的参考,大家可以根据自己实际的版本进行调整,或者去网上搜,会有更全面的版本
yaml
root@prometheus:~# cat /opt/prometheus/prometheus/prometheus.yml
# 报警(触发器)配置
rule_files:
  - "alert.yml"
  - "rules/*.yml"
root@prometheus:~# mkdir /opt/prometheus/prometheus/rules
root@prometheus:~# cd /opt/prometheus/prometheus/rules
yaml
root@prometheus:/opt/prometheus/prometheus/rules# vim nginx.yml
groups:
- name: nginx
  rules:
  # Nginx 下线告警(exporter 无法连接 Nginx)
  - alert: NginxDown
    expr: nginx_up == 0
    for: 30s
    labels:
      severity: critical
    annotations:
      summary: "nginx异常,实例:{{ $labels.instance }}"
      description: "{{ $labels.job }} nginx已关闭"
yaml
root@prometheus:/opt/prometheus/prometheus/rules# vim redis.yml
groups:
- name: redis
  rules:
  - alert: RedisDown
    expr: redis_up == 0
    for: 0m
    labels:
      severity: critical
    annotations:
      summary: 'Redis Down,实例:{{ $labels.instance }}'
      description: "Redis实例 is down"
  - alert: RedisMissingBackup
    expr: time() - redis_rdb_last_save_timestamp_seconds > 60 * 60 * 24
    for: 0m
    labels:
      severity: critical
    annotations:
      summary: "Redis备份丢失,实例:{{ $labels.instance }}"
      description: "Redis 24小时未备份"

  - alert: RedisOutOfConfiguredMaxmemory
    expr: redis_memory_used_bytes / redis_memory_max_bytes * 100 > 90
    for: 2m
    labels:
      severity: warning
    annotations:
      summary: "Redis超出配置的最大内存,实例:{{ $labels.instance }}"
      description: "Redis内存使用超过配置最大内存的90%"
  - alert: RedisTooManyConnections
    expr: redis_connected_clients > 100
    for: 2m
    labels:
      severity: warning
    annotations:
      summary: "Redis连接数过多,实例:{{ $labels.instance }}"
      description: "Redis当前连接数为: {{ $value }}"
  - alert: RedisNotEnoughConnections
    expr: redis_connected_clients < 1
    for: 2m
    labels:
      severity: warning
    annotations:
      summary: "Redis没有足够的连接,实例:{{ $labels.instance }}"
      description: "Redis当前连接数为: {{ $value }}"
  - alert: RedisRejectedConnections
    expr: increase(redis_rejected_connections_total[1m]) > 0
    for: 0m
    labels:
      severity: critical
    annotations:
      summary: "Redis有拒绝连接,实例:{{ $labels.instance }}"
      description: "与Redis 的某些连接被拒绝{{ $value }}"
yaml
root@prometheus:/opt/prometheus/prometheus/rules# vim mysql.yml
groups:
- name: MySQL
  rules:
  - alert: MysqlDown
    expr: mysql_up == 0
    for: 30s
    labels:
      severity: critical
    annotations:
      summary: "MySQL Down,实例:{{ $labels.instance }}"
      description: "MySQL_exporter连不上MySQL了,当前状态为:{{ $value }}"
  - alert: MysqlTooManyConnections
    expr: max_over_time(mysql_global_status_threads_connected[1m]) / mysql_global_variables_max_connections * 100 > 80
    for: 2m
    labels:
      severity: warning
    annotations:
      summary: "Mysql连接数过多告警,实例:{{ $labels.instance }}"
      description: "MySQL连接数>80%,当前值:{{ $value }}"
  - alert: MysqlHighThreadsRunning
    expr: max_over_time(mysql_global_status_threads_running[1m]) > 20
    for: 2m
    labels:
      severity: warning
    annotations:
      summary: "Mysql运行的线程过多,实例:{{ $labels.instance }}"
      description: "Mysql运行的线程 > 20,当前运行的线程:{{ $value }}"
  - alert: MysqlSlowQueries
    expr: increase(mysql_global_status_slow_queries[2m]) > 0
    for: 2m
    labels:
      severity: warning
    annotations:
      summary: "Mysql慢日志告警,实例:{{ $labels.instance }}"
      description: "MySQL在过去2分钟有新的{{ $value }}条慢查询"
  #MySQL innodb 日志写入停滞
  - alert: MysqlInnodbLogWaits
    expr: rate(mysql_global_status_innodb_log_waits[15m]) > 10
    for: 0m
    labels:
      severity: warning
    annotations:
      summary: "MySQL innodb日志等待,实例:{{ $labels.instance }}"
      description: "MySQL innodb日志写入停滞,当前值: {{ $value }}"
  - alert: MysqlRestarted
    expr: mysql_global_status_uptime < 60
    for: 0m
    labels:
      severity: info
    annotations:
      summary: "MySQL 重启,实例:{{ $labels.instance }}"
      description: "不到一分钟前,MySQL重启过"

  - alert: RowLockCurrentWaits
    expr: mysql_global_status_innodb_row_lock_current_waits > 0
    for: 1m
    labels:
      severity: info
    annotations:
      summary: "MySQL有锁等待,实例:{{ $labels.instance }}"
      description: "当前有{{ $value }}个锁等待"
yaml
root@prometheus:/opt/prometheus/prometheus/rules# vim rabbitmq.yml
groups:
- name: Rabbitmq
  rules:
  - alert: RabbitMQDown
    expr: rabbitmq_up != 1
    labels:
      severity: High
    annotations:
      summary: "Rabbitmq Down,实例:{{ $labels.instance }}"
      description: "Rabbitmq_exporter连不上RabbitMQ! ! !"
  - alert: RabbitMQ有未确认消息
    expr: rabbitmq_queue_messages_unacknowledged_global  > 0
    for: 1m
    labels:
      severity: critical
    annotations:
      summary: "RabbitMQ有未确认消息,实例:{{ $labels.instance }}"
      description: 'RabbitMQ未确认消息>0,当前值为:{{ $value }}'
  - alert: RabbitMQ可用磁盘空间不足告警
    expr: rabbitmq_node_disk_free_alarm != 0
    #expr: rabbitmq_node_disk_free_limit / rabbitmq_node_disk_free *100 > 90
    for: 0m
    labels:
      severity: critical
    annotations:
      summary: "RabbitMQ可用磁盘空间不足,实例:{{ $labels.instance }}"
      description: "RabbitMQ可用磁盘空间不足,请检查"
  - alert: RabbitMQ可用内存不足告警
    expr: rabbitmq_node_mem_alarm != 0
    #expr: rabbitmq_node_mem_used / rabbitmq_node_mem_limit * 100 > 90
    for: 0m
    labels:
      severity: critical
    annotations:
      summary: "RabbitMQ可用内存不足,实例:{{ $labels.instance }}"
      description: "RabbitMQ可用内存不足,请检查"
  - alert: RabbitMQ_socket连接数使用过高告警
    expr: rabbitmq_sockets_used / rabbitmq_sockets_available * 100 > 60
    for: 0m
    labels:
      severity: critical
    annotations:
      summary: "RabbitMQ_socket连接数使用过高,实例:{{ $labels.instance }}"
      description: 'RabbitMQ_sockets使用>60%,当前值为:{{ $value }}'
  - alert: RabbitMQ文件描述符使用过高告警
    expr: rabbitmq_fd_used / rabbitmq_fd_available * 100 > 60
    for: 0m
    labels:
      severity: critical
    annotations:
      summary: "RabbitMQ文件描述符使用过高,实例:{{ $labels.instance }}"
      description: 'RabbitMQ文件描述符使用>60%,当前值为:{{ $value }}'
yaml
root@prometheus:/opt/prometheus/prometheus/rules# vim docker.yml
groups:
- name: DockerContainers
  rules:
  - alert: ContainerKilled
    expr: time() - container_last_seen > 60
    for: 0m
    labels:
      severity: warning
    annotations:
      isummary: "Docker容器被杀死 容器:{{ $labels.instance }}"
      description: "{{ $value }}个容器消失了"
  # This rule can be very noisy in dynamic infra with legitimate container start/stop/deployment.
  - alert: ContainerAbsent
    expr: absent(container_last_seen)
    for: 5m
    labels:
      severity: warning
    annotations:
      summary: "无容器 容器: {{ $labels.instance }}"
      description: "5分钟检查容器不存在,值为:{{ $value }}"
  - alert: ContainerCpuUsage
    expr: (sum(rate(container_cpu_usage_seconds_total{name!=""}[3m])) BY (instance, name) * 100) > 300
    for: 2m
    labels:
      severity: warning
    annotations:
      summary: "容器cpu使用率告警 容器: {{ $labels.instance }}"
      description: "容器cpu使用率超过300%,当前值为:{{ $value }}"
  - alert: ContainerMemoryUsage
    expr: (sum(container_memory_working_set_bytes{name!=""}) BY (instance, name) / sum(container_spec_memory_limit_bytes > 0) BY (instance, name) * 100) > 80
    for: 2m
    labels:
      severity: warning
    annotations:
      summary: "容器内存使用率告警 容器: {{ $labels.instance }}"
      description: "容器内存使用率超过80%,当前值为:{{ $value }}"
  - alert: ContainerVolumeIoUsage
    expr: (sum(container_fs_io_current{name!=""}) BY (instance, name) * 100) > 80
    for: 2m
    labels:
      severity: warning
    annotations:
      summary: "容器存储io使用率告警 容器: {{ $labels.instance }}"
      description: "容器存储io使用率超过 80%,当前值为:{{ $value }}"
  - alert: ContainerHighThrottleRate
    expr: rate(container_cpu_cfs_throttled_seconds_total[3m]) > 1
    for: 2m
    labels:
      severity: warning
    annotations:
      summary: "容器限制告警 容器:{{ $labels.instance }}"
      description: "容器被限制,当前值为:{{ $value }}"
yaml
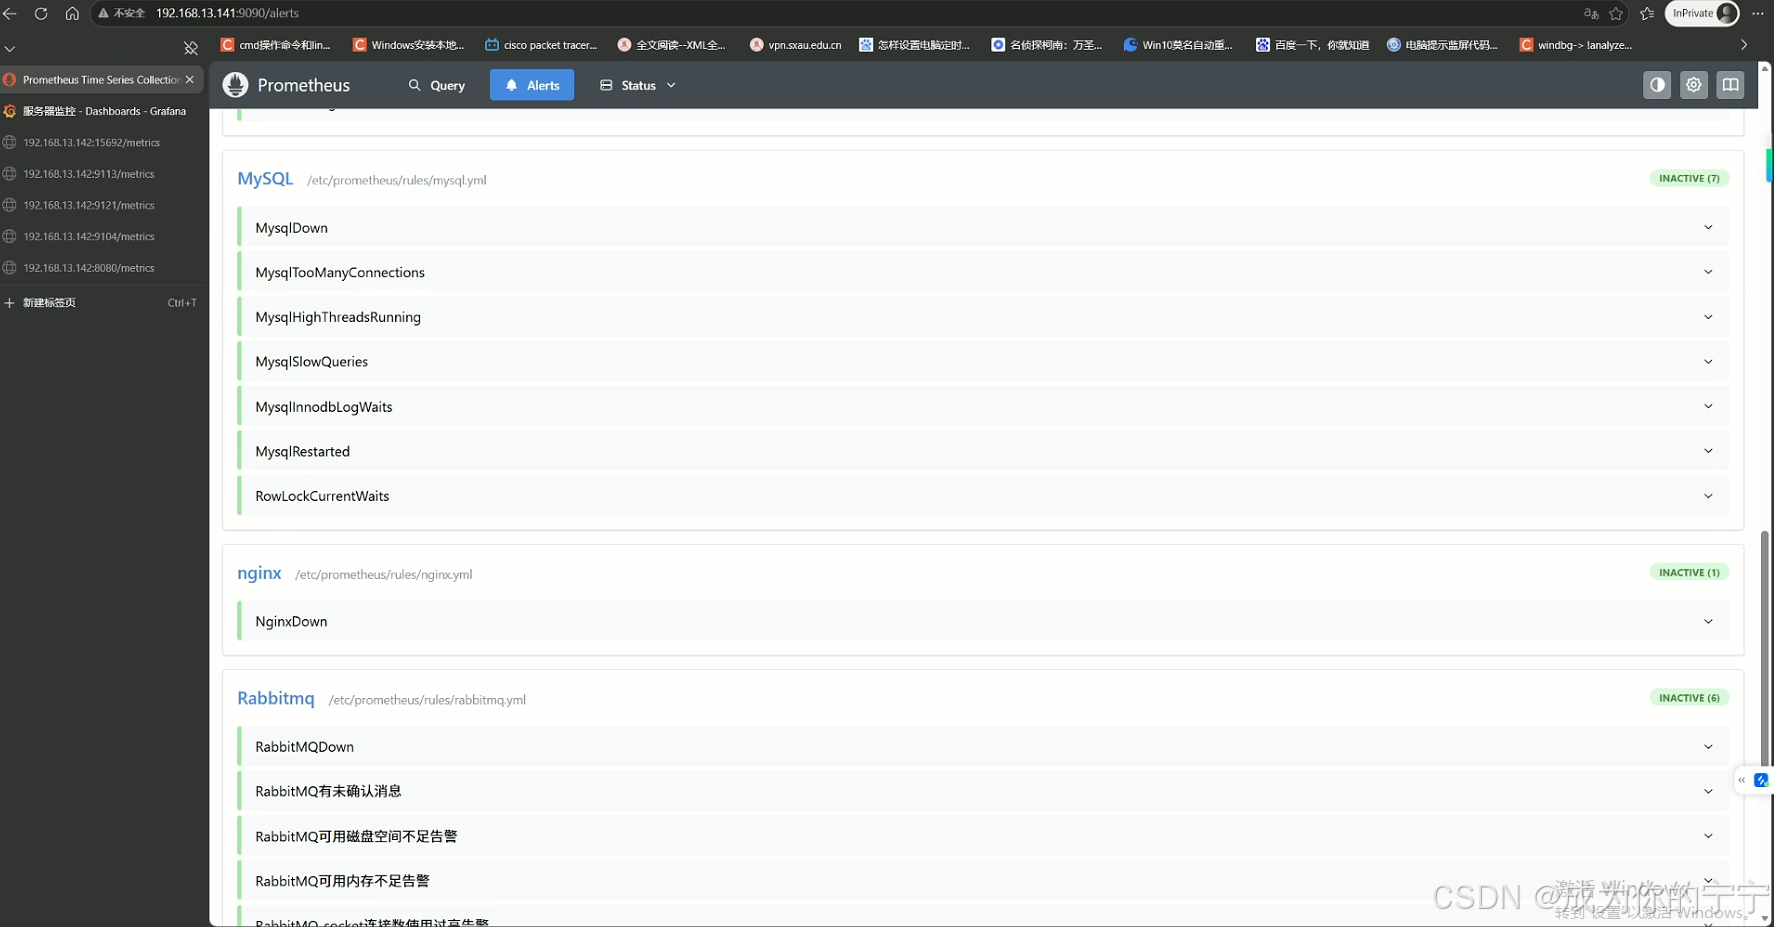
## 热加载prometheus
root@prometheus:~# curl -X POST http://localhost:9090/-/reload浏览器访问监控端 ip:9090prometheus的页面,可以看到alerts报警增加了很多
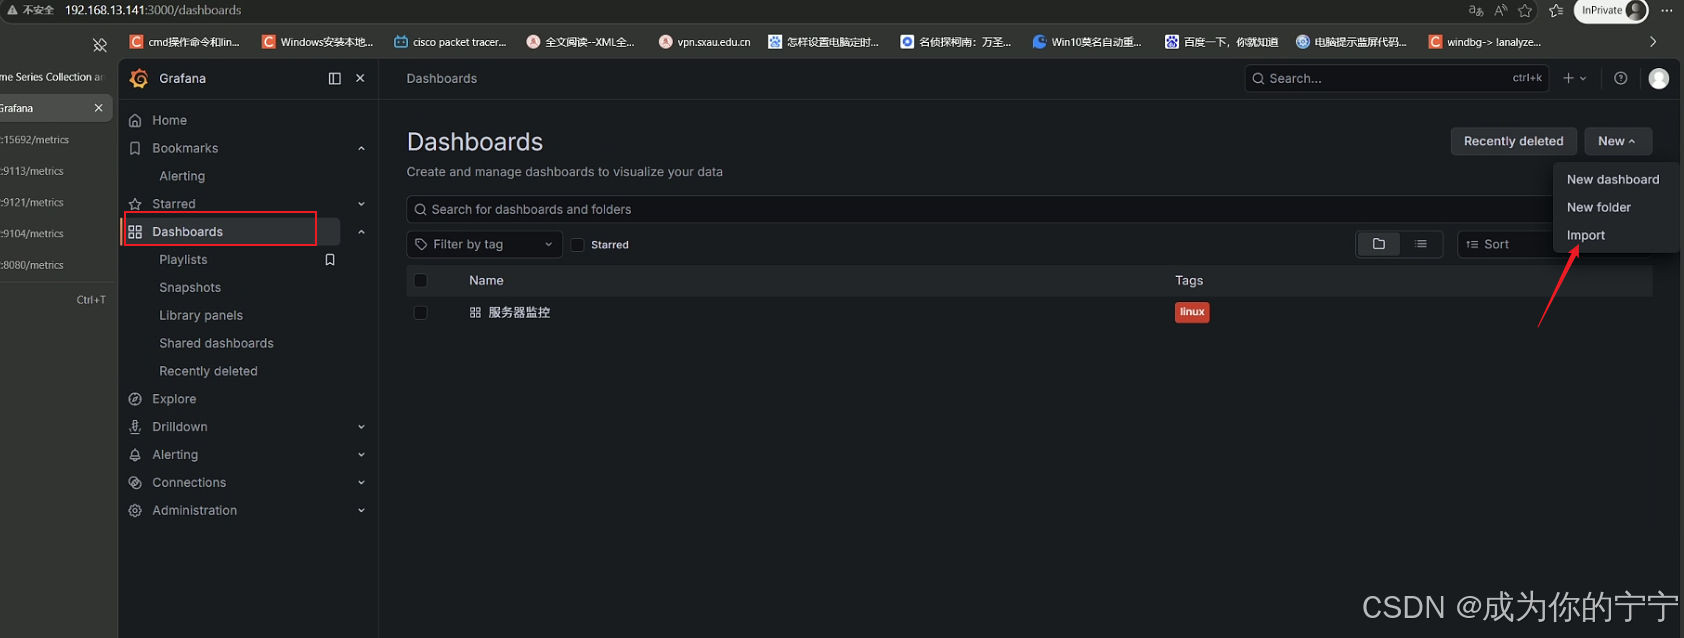
七、Grafana导入dashboard监控模版
现在prometheus已经拉取了被监控端的数据,现在需要在grafana上导入各exporter的创建dashboard模版
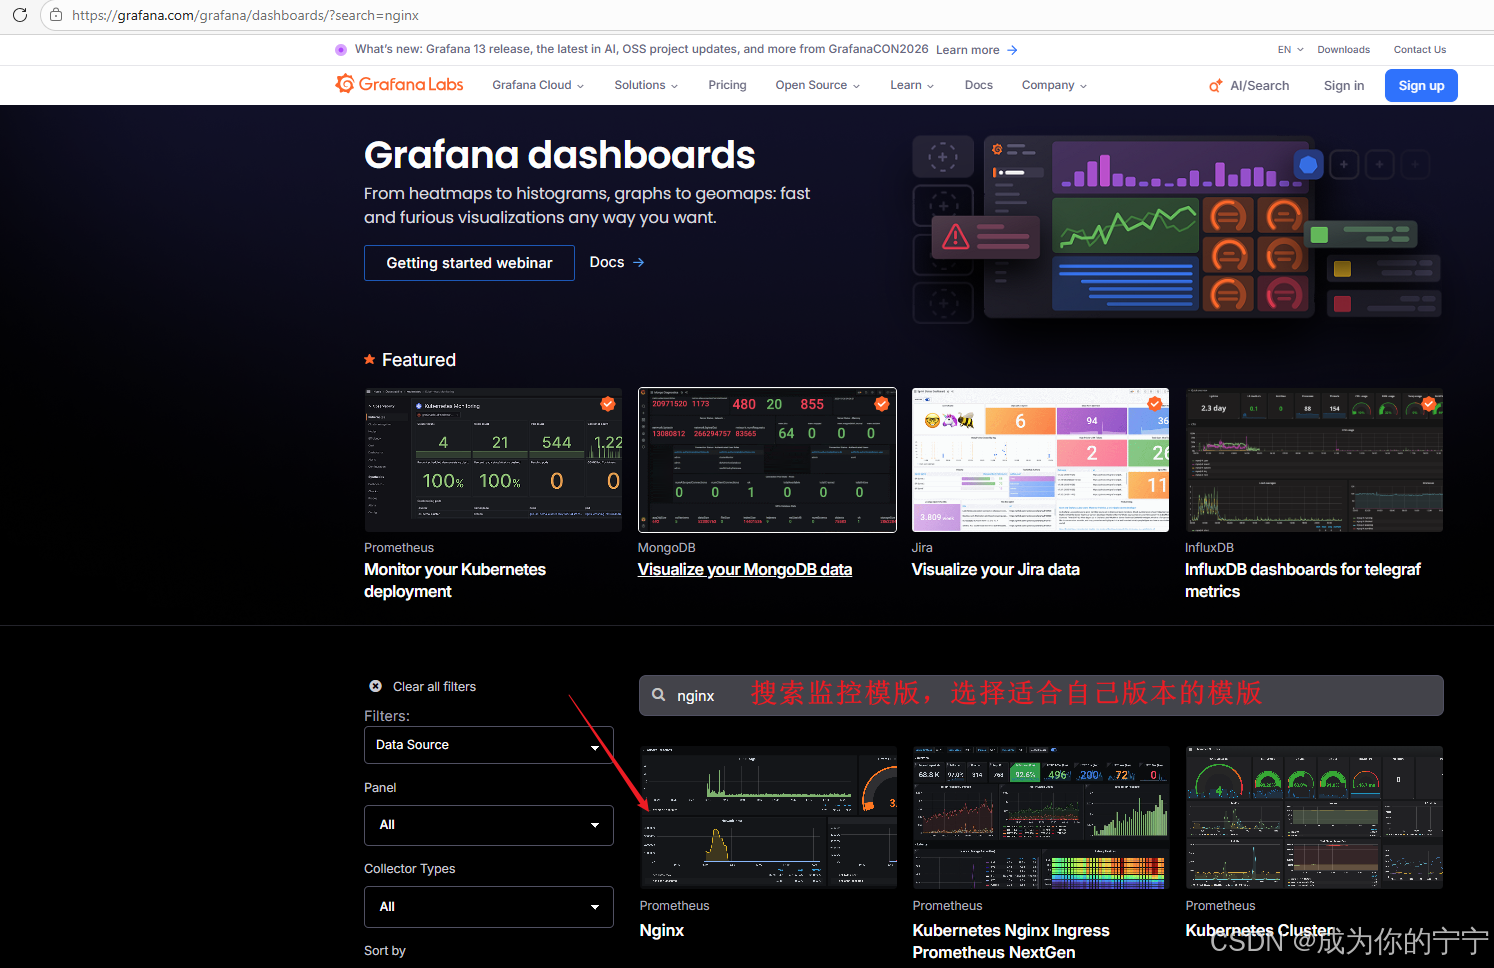
Grafana dashboard官网:https://grafana.com/grafana/dashboards/
下面以nginx_exporter为例,其他的配置一样
首先访问grafana官网,找到适合的dashboard
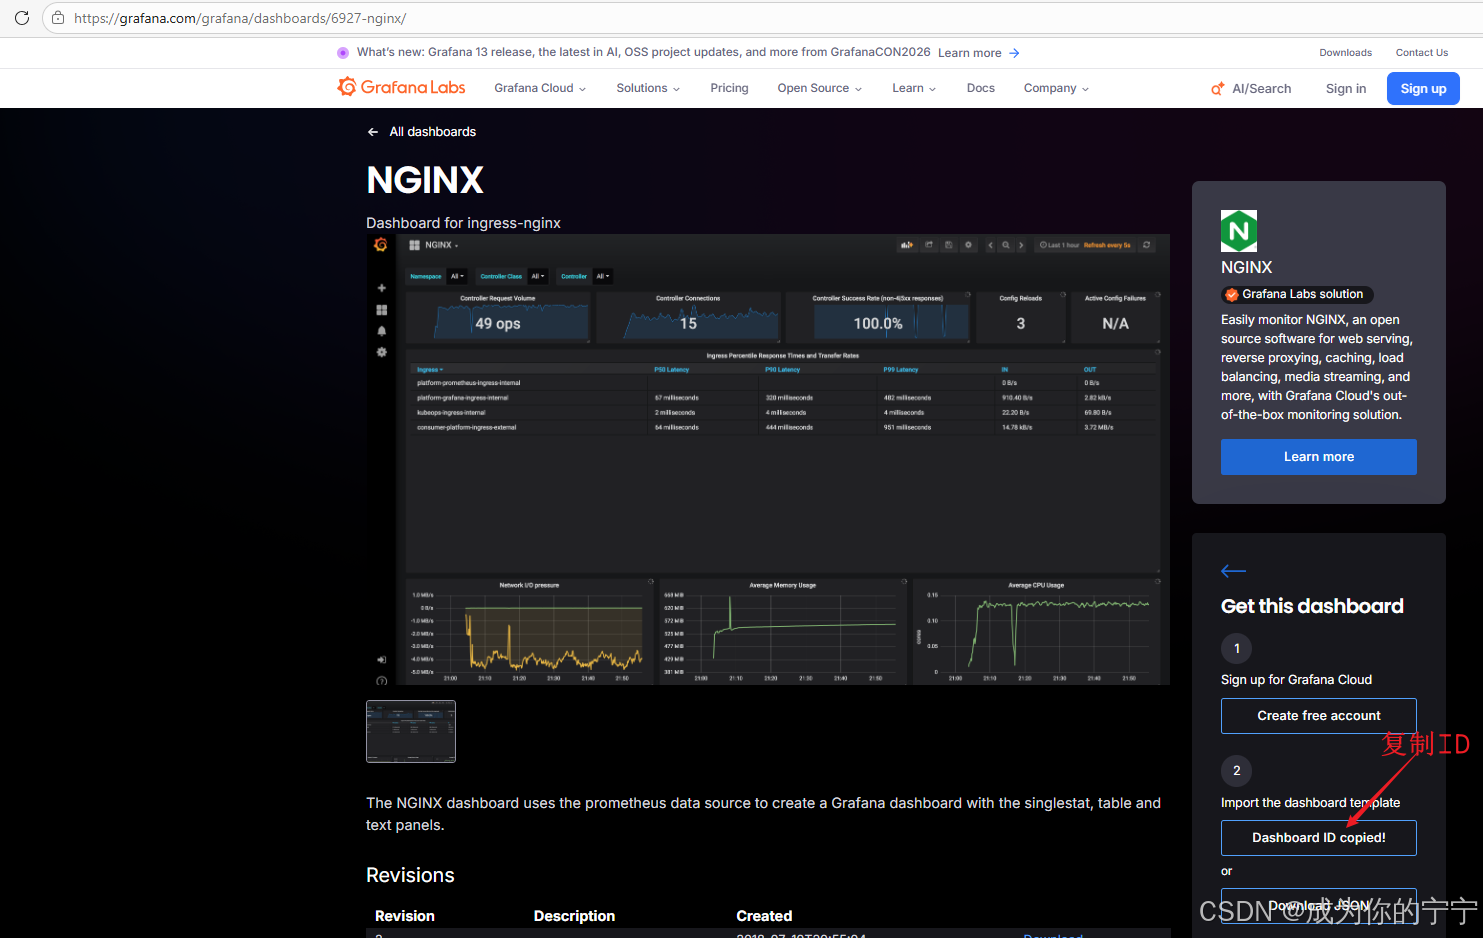
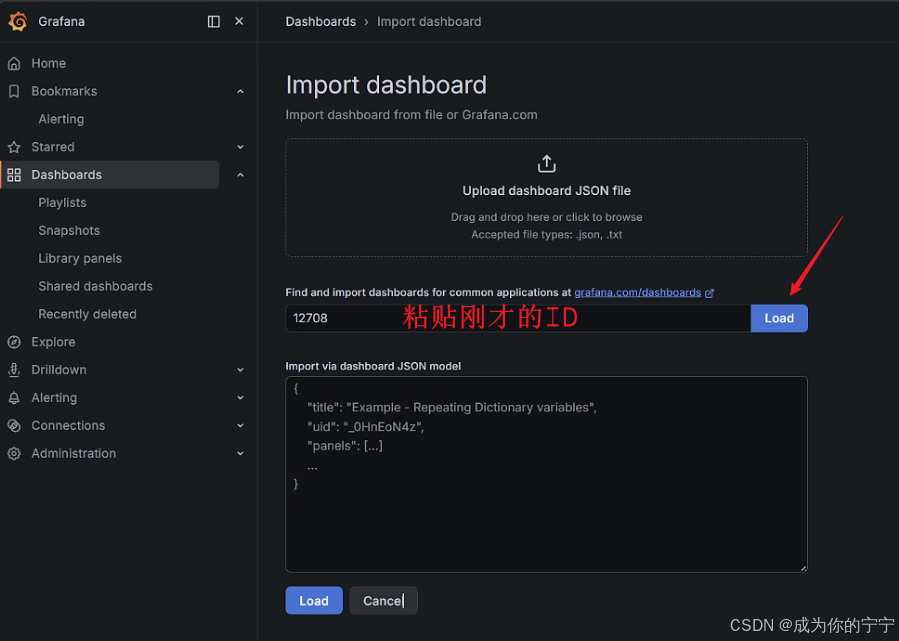
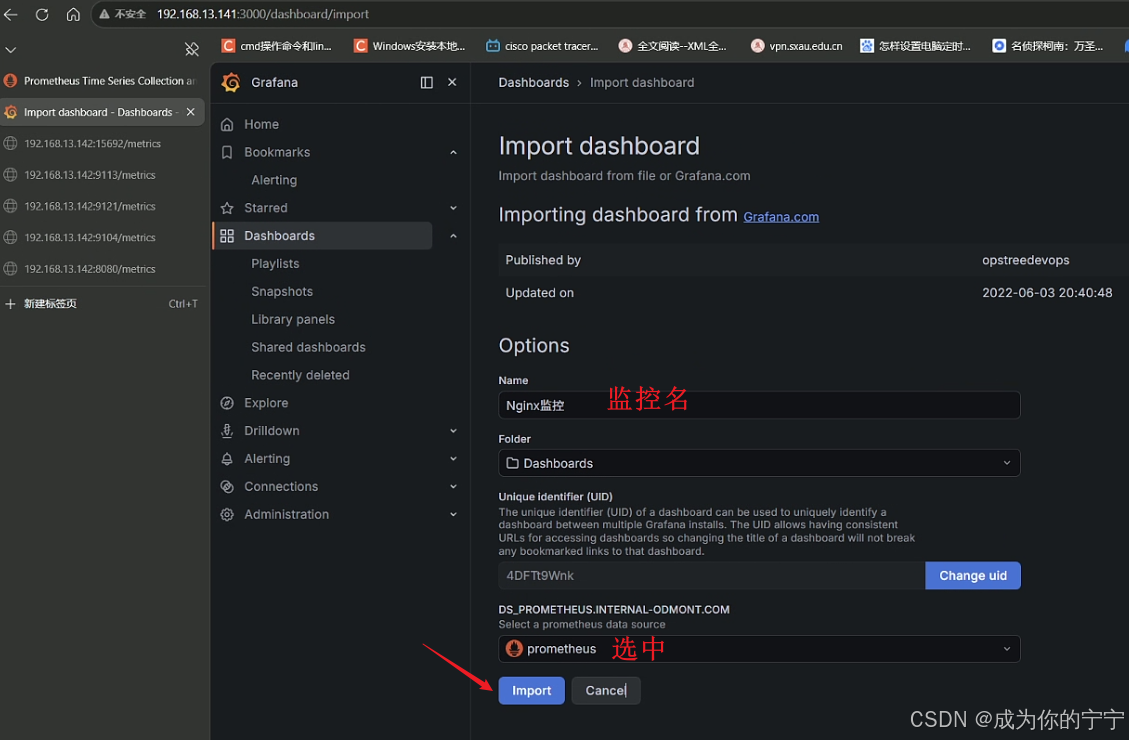
然后回到自己搭建的grafana界面,导入dashboard的ID
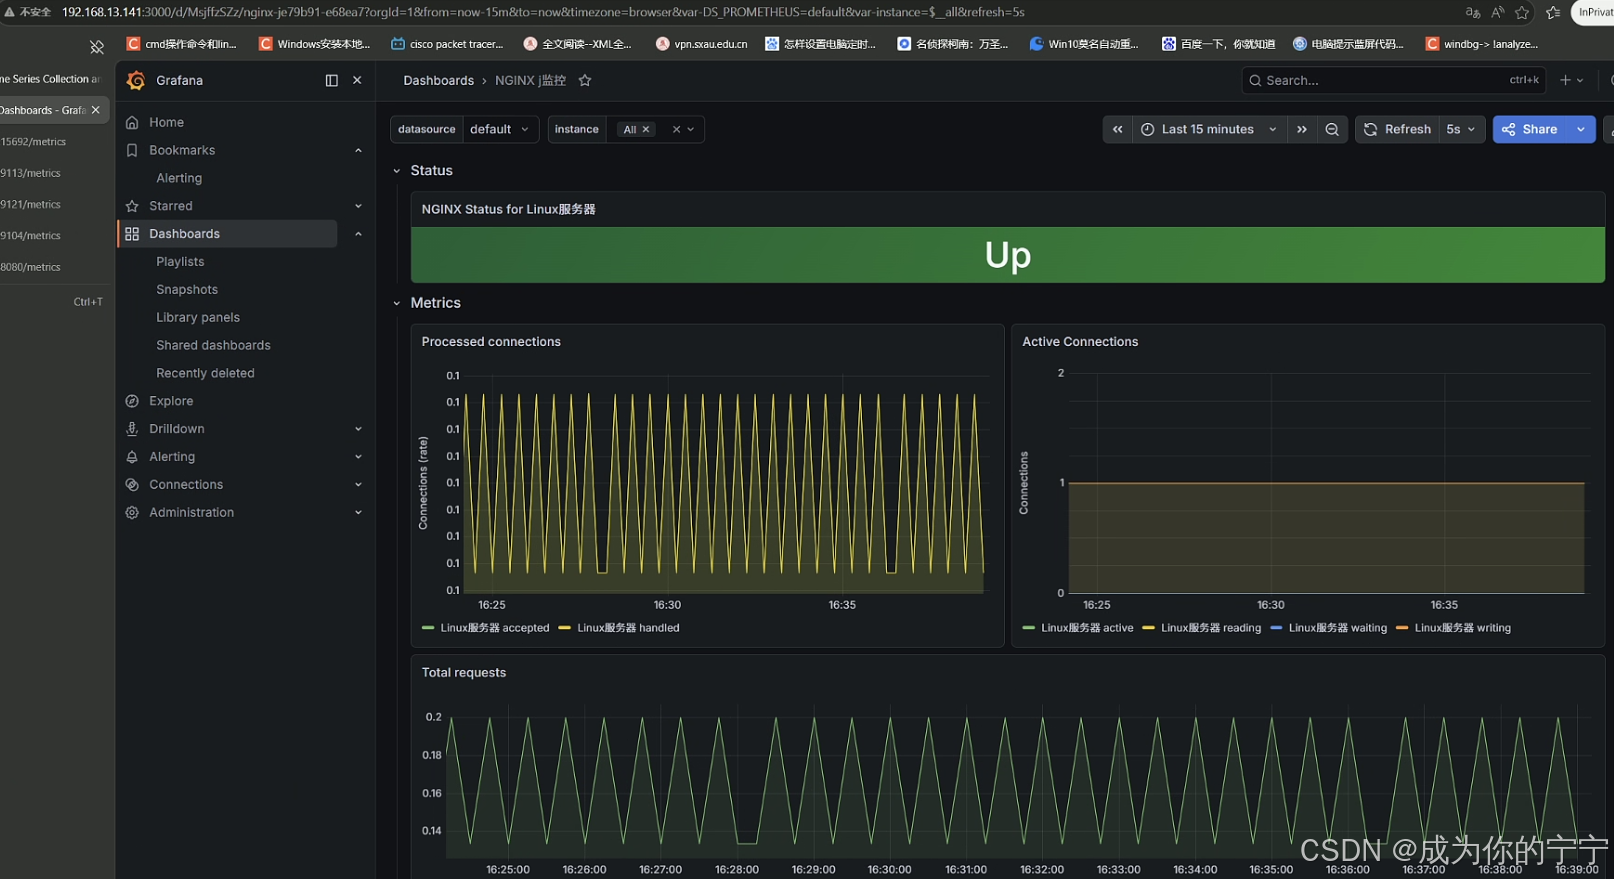
图形展示
下面我挑选了一些服务常用模版,大家也可以自己去grafana官自行挑选
Nginx dashboard:https://grafana.com/grafana/dashboards/12708-nginx/ ID:12780
Redis dashboard:https://grafana.com/grafana/dashboards/22493-redis-overview/ ID:22493
Mysql dashboard:https://grafana.com/grafana/dashboards/14031-mysql-dashboard/ ID:14031
Rabbitmq dashboard:https://grafana.com/grafana/dashboards/10991-rabbitmq-overview/ ID:10991
至此,Prometheus监控Nginx、MySQL、Redis、Docker、RabbitMQ整套服务部署完毕
后续监控其他服务均可沿用统一流程:
1,被监控主机部署对应业务服务
2,部署该服务专属Exporter采集指标
3,监控端修改
prometheus.yml添加抓取任务4,按需编写告警规则配置告警
5,最后在Grafana导入对应监控面板,即可可视化展示数据
注:
文中若有疏漏,欢迎大家指正赐教。
本文为100%原创,转载请务必标注原创作者,尊重劳动成果。
求赞、求关注、求评论!你的支持是我更新的最大动力,评论区等你~