交互教程体验:可观测性实战:Prometheus + Grafana 全栈监控
服务挂了你能发现,但服务没挂、只是悄悄变慢了呢 → 变慢的是哪个接口、从几点开始、持续多久 → 这些问题,没有指标就没有答案 → 指标靠在代码里埋点产生 → Prometheus 定期拉取这些指标存成时间序列 → PromQL 让你用查询语言问问题 → Grafana 把答案画成图。本教程把这条链路从零跑通。
第一章 · 服务活着,但你看不见它
「活着」不等于「可观测」
go
package main

import (
	"fmt"
	"log"
	"net/http"
)

func handleHealth(w http.ResponseWriter, r *http.Request) {
	w.WriteHeader(http.StatusOK)
	fmt.Fprintf(w, `{"status":"ok"}`)
}

func main() {
	mux := http.NewServeMux()
	mux.HandleFunc("/health", handleHealth)

	log.Printf("Server starting on :8080")
	if err := http.ListenAndServe(":8080", mux); err != nil {
		log.Fatalf("Server failed: %v", err)
	}
}
左边是一个能跑起来的 Go HTTP 服务器:一个 /health 接口,返回 {"status":"ok"},进程不崩。
看起来没问题。但假设你现在被告警叫醒了,需要回答下面这五个问题:
- 这个接口今天被请求了多少次?
- 有多少请求正在处理中,是否有请求堆积?
- 接口的响应时间分布是什么样的------有没有慢请求?
- 错误率是多少,从什么时间开始升高?
- 昨晚凌晨三点那次响应时间飙升,原因是什么?
靠 /health 返回 {"status":"ok"} 一个都答不了。这就是「服务活着」和「服务可观测」的区别------前者只能告诉你进程还在,后者才能告诉你系统里发生了什么。
为什么是指标,不是日志?
日志也能记录请求,但它解决的是「事后排查」------出了问题翻日志找线索。指标(Metrics)解决的是「持续感知」------在问题发生之前,你就能看到异常信号:QPS 开始下降、错误率开始上升、P99 延迟开始拉长。
而且指标非常轻量:一个计数器就几十字节内存,每次抓取只是一段文本。日志要做到同等覆盖,磁盘开销大出一两个数量级。
这条路怎么走
本教程的路径是这样的:
bash
在代码里定义指标,在关键时机更新它们
↓
Go 服务通过 /metrics 端点把指标暴露出来
↓
Prometheus 每 5 秒来 /metrics 拉一次,存成时间序列
↓
PromQL 查询这些时间序列,回答你的问题
↓
Grafana 把查询结果渲染成可视化面板
整个监控栈的角色分工
三个角色分工很清晰:你的服务 负责埋点并把指标通过 /metrics 暴露出来;Prometheus 是唯一的「主动方」,定期来拉取数据并按时间序列存储,同时提供查询接口;Grafana 自己不存数据,它只是一个窗口------通过 PromQL 向 Prometheus 要数据,再渲染成图表。
这种「Prometheus 主动拉取、服务被动暴露」的设计叫做拉取模型(Pull Model) ,和你可能见过的「日志上报」不一样------服务不需要知道 Prometheus 在哪里,只需要把自己的状态挂在 /metrics 上等着被取。这个设计有一个重要好处:如果某个服务挂了,Prometheus 来拉取、没有响应,立刻就能检测到。第六章配置 Prometheus 时会再回到这个话题。
左边的代码是起点。接下来每一章在它的基础上加一样东西,直到能回答开头那五个问题。
跟着做之前
demo 代码在 github.com/minorcell/s...,clone 下来就能跟着操作。
第二章到第五章 只需要在本地用 go run 跑 Go 服务,然后用 curl 验证。环境要求:Go 1.21+。
第六章之后 会把服务、Prometheus、Grafana 全部用 Docker Compose 启动,需要安装 Docker Desktop。代码不需要再改,直接 docker compose up --build 跑完整的监控栈。
go
package main

import (
	"fmt"
	"log"
	"net/http"

	"github.com/prometheus/client_golang/prometheus"
	"github.com/prometheus/client_golang/prometheus/promauto"
	"github.com/prometheus/client_golang/prometheus/promhttp"
)

var httpRequestsTotal = promauto.NewCounterVec(
	prometheus.CounterOpts{
		Name: "http_requests_total",
		Help: "HTTP 请求总数,按 method / endpoint / status 分组",
	},
	[]string{"method", "endpoint", "status"},
)

func handleHealth(w http.ResponseWriter, r *http.Request) {
	w.WriteHeader(http.StatusOK)
	fmt.Fprintf(w, `{"status":"ok"}`)
	httpRequestsTotal.WithLabelValues(r.Method, "/health", "200").Inc()
}

func main() {
	mux := http.NewServeMux()
	mux.HandleFunc("/health", handleHealth)
	mux.Handle("/metrics", promhttp.Handler())

	log.Printf("Server starting on :8080")
	if err := http.ListenAndServe(":8080", mux); err != nil {
		log.Fatalf("Server failed: %v", err)
	}
}
第二章 · Counter:记住「发生了多少次」
给服务装上第一双眼睛
要回答「接口被请求了多少次」,最直接的方式就是在代码里放一个计数器,每来一个请求就 +1。这就是 Prometheus 里的 Counter。
左边做了三件事:
引入了 Prometheus 客户端库 (第 8-10 行)。Go 生态里对应的包是 github.com/prometheus/client_golang,包含三个子包------prometheus 提供 Counter / Gauge / Histogram 等类型,promauto 帮我们自动完成注册,promhttp 提供把指标输出为文本的 HTTP Handler。
定义了一个 CounterVec(第 13-19 行)。「Vec」是 Vector 的缩写,意思是这个 Counter 支持按标签维度切分------同一个指标名,配上不同的标签值,就是不同的时间序列:
ini
http_requests_total{method="GET",  endpoint="/health", status="200"}  →  一条序列
http_requests_total{method="POST", endpoint="/api/order", status="201"}  →  另一条
这样一个指标就能同时统计所有接口、所有状态码,不需要为每种组合单独定义。
在请求完成后调用 .Inc() (第 24 行),并挂了 /metrics 路由(第 30 行)。
验证一下
安装依赖,启动服务:
bash
go get github.com/prometheus/client_golang/prometheus
go get github.com/prometheus/client_golang/prometheus/promauto
go get github.com/prometheus/client_golang/prometheus/promhttp
go run main.go
另开一个终端,打三次 /health,然后看 /metrics 的输出:
bash
curl http://localhost:8080/health
curl http://localhost:8080/health
curl http://localhost:8080/health
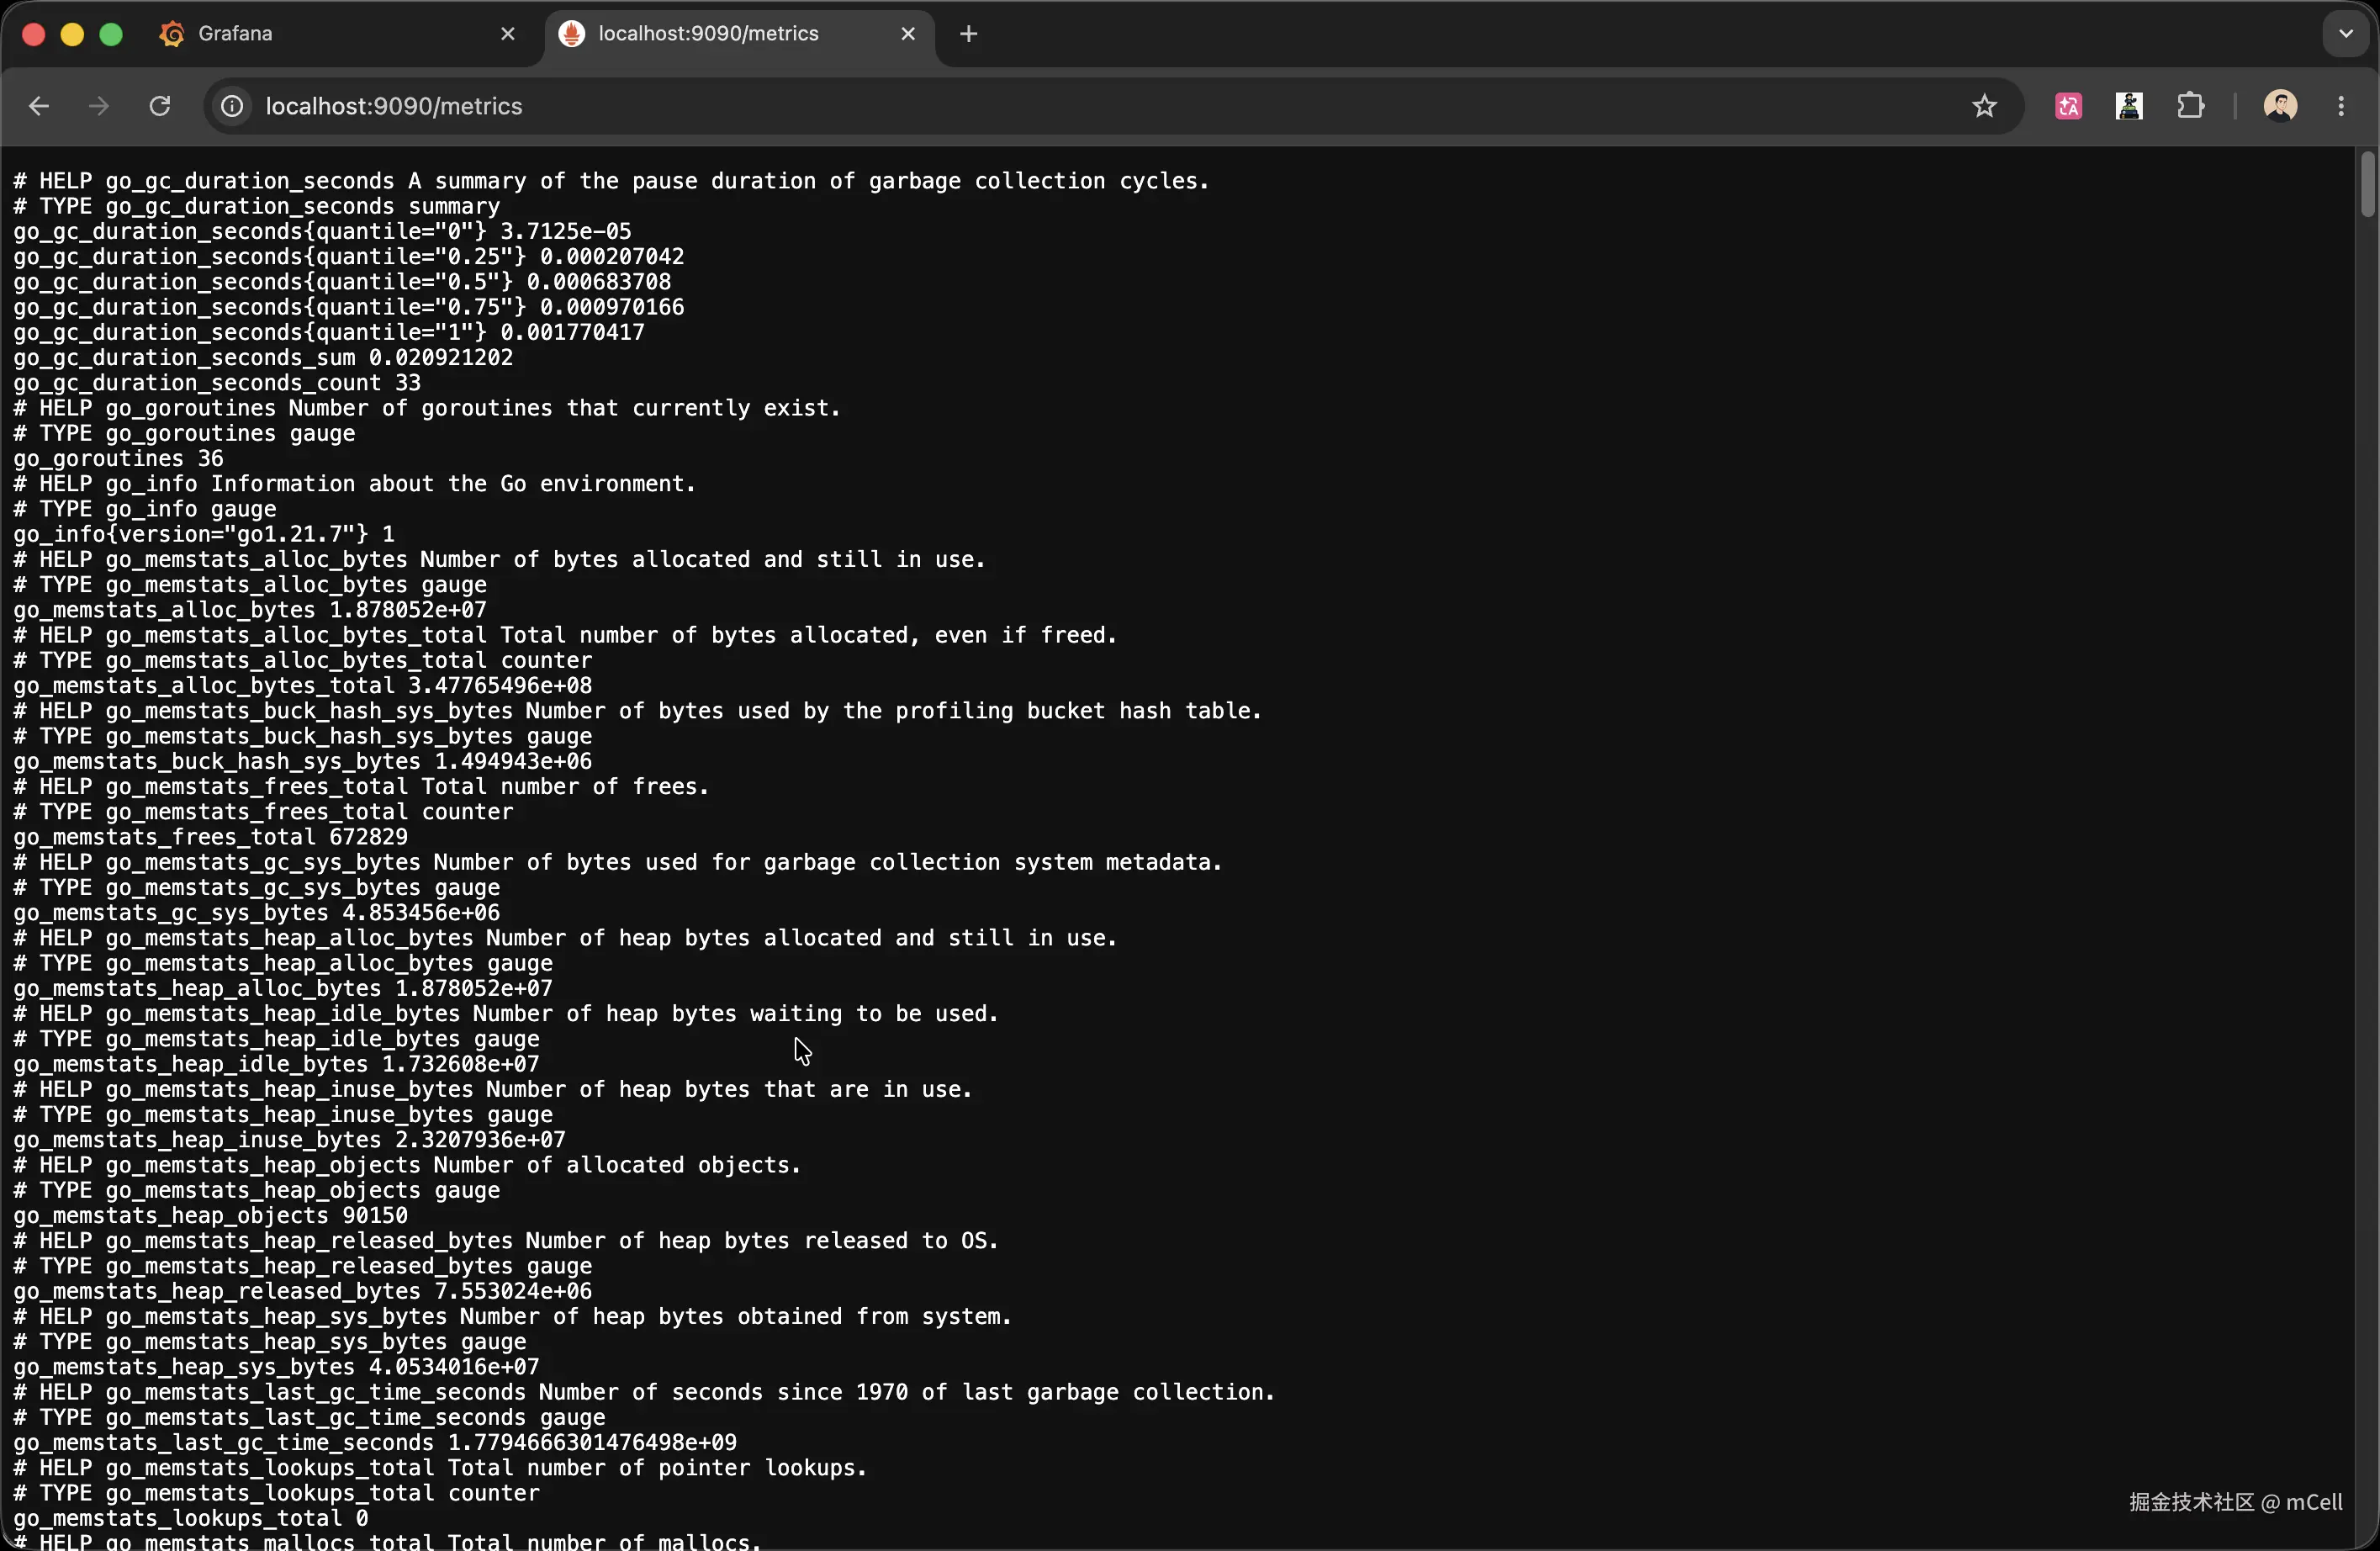
curl http://localhost:8080/metrics | grep http_requests_total你应该看到:
ini
# HELP http_requests_total HTTP 请求总数,按 method / endpoint / status 分组
# TYPE http_requests_total counter
http_requests_total{endpoint="/health",method="GET",status="200"} 3
指标名{标签集合} 值------这就是整个 Prometheus 生态共用的文本格式,极其简单。
Counter 的三条约束
1. 只增不减。 进程重启会归零,这是正常的;正常运行中计数只会增长。如果你想表示一个会上下波动的量,需要的是下一章的 Gauge。
2. 不要直接分析原始值。 http_requests_total = 5000 说明不了任何问题------你不知道这 5000 是一分钟内产生的还是一个月。Counter 有意义的分析方式是看「变化速率」:PromQL 的 rate(http_requests_total[1m]) 才能告诉你每秒处理了多少请求。
3. 命名带 _total 后缀。 这是 Prometheus 社区约定,http_requests_total 而不是 http_requests。
经验法则:能「数数」、只会越来越大的量,用 Counter。
go
package main

import (
	"fmt"
	"log"
	"net/http"

	"github.com/prometheus/client_golang/prometheus"
	"github.com/prometheus/client_golang/prometheus/promauto"
	"github.com/prometheus/client_golang/prometheus/promhttp"
)

var (
	httpRequestsTotal = promauto.NewCounterVec(
		prometheus.CounterOpts{
			Name: "http_requests_total",
			Help: "HTTP 请求总数,按 method / endpoint / status 分组",
		},
		[]string{"method", "endpoint", "status"},
	)

	httpRequestsInFlight = promauto.NewGauge(
		prometheus.GaugeOpts{
			Name: "http_requests_in_flight",
			Help: "当前正在处理中的 HTTP 请求数",
		},
	)
)

type statusRecorder struct {
	http.ResponseWriter
	statusCode int
}

func (r *statusRecorder) WriteHeader(code int) {
	r.statusCode = code
	r.ResponseWriter.WriteHeader(code)
}

func instrumentHandler(endpoint string, handler http.HandlerFunc) http.HandlerFunc {
	return func(w http.ResponseWriter, r *http.Request) {
		httpRequestsInFlight.Inc()
		defer httpRequestsInFlight.Dec()

		rec := &statusRecorder{ResponseWriter: w, statusCode: http.StatusOK}
		handler(rec, r)

		httpRequestsTotal.WithLabelValues(
			r.Method, endpoint, fmt.Sprintf("%d", rec.statusCode),
		).Inc()
	}
}

func handleHealth(w http.ResponseWriter, r *http.Request) {
	w.WriteHeader(http.StatusOK)
	fmt.Fprintf(w, `{"status":"ok"}`)
}

func main() {
	mux := http.NewServeMux()
	mux.HandleFunc("/health", instrumentHandler("/health", handleHealth))
	mux.Handle("/metrics", promhttp.Handler())

	log.Printf("Server starting on :8080")
	if err := http.ListenAndServe(":8080", mux); err != nil {
		log.Fatalf("Server failed: %v", err)
	}
}
第三章 · Gauge 与中间件:「现在有多少」
Counter 的盲区
上一步的 Counter 能告诉你「总共处理了多少请求」,但无法回答:现在、此刻,有多少个请求正在被处理?
这两件事本质上不一样。累计数是一个只增不减的历史记录;而「当前并发数」是一个随请求进出而涨落的瞬时状态。描述瞬时状态的指标类型叫 Gauge------可增可减,直接反映当前值。
左边新增了 httpRequestsInFlight(第 22-28 行):请求进来时 +1,请求结束后 -1,任意时刻查它,得到的就是当前同时在处理的请求数。
中间件:一次写,所有接口都受益
上一步在 handleHealth 里手动调用了 .Inc()。真实服务有几十上百个接口,如果每个都手写,不仅繁琐,一旦某个接口漏了,那个接口的数据就从监控里消失了。
更好的做法是 HTTP 中间件 (第 40-52 行):instrumentHandler 把原始 handler 包一层,在请求前后自动完成所有指标采集。业务代码不需要知道指标的存在------看第 54-57 行的 handleHealth,跟最开始完全一样,干干净净。
中间件里两个值得注意的设计:
defer httpRequestsInFlight.Dec():defer保证即使 handler 里发生了 panic,Gauge 也会被减回去,不会永远偏高。statusRecorder(第 30-38 行):Go 标准库的http.ResponseWriter有个问题------你没法在 handler 执行完之后知道它返回了什么状态码。statusRecorder包了一层,拦截了WriteHeader调用,把状态码存起来,这样中间件才能给 Counter 打上status="200"或status="500"这样的标签。
Gauge 长什么样
启动服务后直接查:
bash
curl -s http://localhost:8080/metrics | grep in_flight
# http_requests_in_flight 0
此时没有进行中的请求,所以值是 0。Gauge 的意义在全栈跑起来之后才看得清------第七章里 client 服务会持续向所有接口发请求,那时候你在 Prometheus UI 里查这个指标,会看到它随请求的到来和离开实时波动。
| Counter | Gauge | |
|---|---|---|
| 语义 | 累计值,只增不减 | 瞬时值,可增可减 |
| 回答的问题 | 「总共发生了多少次?」 | 「现在有多少?」 |
| PromQL | 必须配合 rate() 才有意义 |
可以直接查当前值 |
经验法则:会涨也会跌的量------并发数、内存占用、队列长度------用 Gauge。
go
package main

import (
	"fmt"
	"log"
	"math/rand"
	"net/http"
	"time"

	"github.com/prometheus/client_golang/prometheus"
	"github.com/prometheus/client_golang/prometheus/promauto"
	"github.com/prometheus/client_golang/prometheus/promhttp"
)

var (
	httpRequestsTotal = promauto.NewCounterVec(
		prometheus.CounterOpts{
			Name: "http_requests_total",
			Help: "HTTP 请求总数,按 method / endpoint / status 分组",
		},
		[]string{"method", "endpoint", "status"},
	)

	httpRequestDuration = promauto.NewHistogramVec(
		prometheus.HistogramOpts{
			Name:    "http_request_duration_seconds",
			Help:    "HTTP 请求耗时分布(秒)",
			Buckets: prometheus.DefBuckets,
		},
		[]string{"method", "endpoint"},
	)

	httpRequestsInFlight = promauto.NewGauge(
		prometheus.GaugeOpts{
			Name: "http_requests_in_flight",
			Help: "当前正在处理中的 HTTP 请求数",
		},
	)
)

type statusRecorder struct {
	http.ResponseWriter
	statusCode int
}

func (r *statusRecorder) WriteHeader(code int) {
	r.statusCode = code
	r.ResponseWriter.WriteHeader(code)
}

func instrumentHandler(endpoint string, handler http.HandlerFunc) http.HandlerFunc {
	return func(w http.ResponseWriter, r *http.Request) {
		httpRequestsInFlight.Inc()
		defer httpRequestsInFlight.Dec()

		start := time.Now()
		rec := &statusRecorder{ResponseWriter: w, statusCode: http.StatusOK}
		handler(rec, r)

		duration := time.Since(start).Seconds()
		httpRequestsTotal.WithLabelValues(
			r.Method, endpoint, fmt.Sprintf("%d", rec.statusCode),
		).Inc()
		httpRequestDuration.WithLabelValues(r.Method, endpoint).Observe(duration)
	}
}

func handleHealth(w http.ResponseWriter, r *http.Request) {
	w.WriteHeader(http.StatusOK)
	fmt.Fprintf(w, `{"status":"ok"}`)
}

func handleHello(w http.ResponseWriter, r *http.Request) {
	time.Sleep(time.Duration(rand.Intn(100)) * time.Millisecond)
	w.WriteHeader(http.StatusOK)
	fmt.Fprintf(w, `{"message":"hello, world!"}`)
}

func handleSlow(w http.ResponseWriter, r *http.Request) {
	time.Sleep(time.Duration(500+rand.Intn(2000)) * time.Millisecond)
	w.WriteHeader(http.StatusOK)
	fmt.Fprintf(w, `{"message":"slow response"}`)
}

func handleError(w http.ResponseWriter, r *http.Request) {
	time.Sleep(time.Duration(rand.Intn(50)) * time.Millisecond)
	if rand.Float64() < 0.3 {
		w.WriteHeader(http.StatusInternalServerError)
		fmt.Fprintf(w, `{"error":"internal server error"}`)
		return
	}
	if rand.Float64() < 0.2 {
		w.WriteHeader(http.StatusBadRequest)
		fmt.Fprintf(w, `{"error":"bad request"}`)
		return
	}
	w.WriteHeader(http.StatusOK)
	fmt.Fprintf(w, `{"message":"ok"}`)
}

func main() {
	mux := http.NewServeMux()
	mux.HandleFunc("/health", instrumentHandler("/health", handleHealth))
	mux.HandleFunc("/api/hello", instrumentHandler("/api/hello", handleHello))
	mux.HandleFunc("/api/slow", instrumentHandler("/api/slow", handleSlow))
	mux.HandleFunc("/api/error", instrumentHandler("/api/error", handleError))
	mux.Handle("/metrics", promhttp.Handler())

	log.Printf("Server starting on :8080")
	if err := http.ListenAndServe(":8080", mux); err != nil {
		log.Fatalf("Server failed: %v", err)
	}
}
第四章 · Histogram:平均值会骗人
一个让人放松警惕的数字
假设你的接口收到了 10 次请求:9 次在 10ms 内返回,1 次因为某种原因卡了 1100ms。把这 10 次耗时加起来除以 10,平均值约 109ms。
109ms 看起来有点慢,但也不至于报警。问题是,这个数字既没有告诉你「90% 的用户其实体验很好(10ms)」,也没有充分放大那 1 次卡顿(1100ms)------它把两种截然不同的体验抹平成了一个中间值,让你看不清全貌。
换一种描述方式:把 10 次耗时从小到大排列。P50 是排在第 5 位的那个值(10ms),P90 是第 9 位(10ms),P99 是在 100 次请求里排第 99 位的那个(1100ms)。P99 直接告诉你:有 1% 的用户在等超过 1 秒------这才是藏在平均值背后的真实问题。
「99% 的请求在 200ms 以内响应」,这种用分位数表达的指标才能真实刻画用户体验,也才是有意义的 SLO 指标。
Histogram 是怎么工作的
左边新增了 httpRequestDuration(第 24-31 行),这是一个 HistogramVec。
Histogram 的核心思路是分桶统计:预先定义一批时间边界(比如 0.1s、0.5s、1s、2.5s......),每来一次请求,就把耗时投入所有「边界 ≥ 耗时」的桶里。积累足够多的请求之后,PromQL 就能从这些桶的分布反推出 P50、P99。
prometheus.DefBuckets 是默认的桶边界集合,覆盖了 5ms 到 10s 的范围,足够大多数 HTTP 接口使用。对于金额、大小等业务场景,需要自定义桶------下一章会看到这个用法。
耗时记录的代码在中间件里:start := time.Now()(第 56 行)记录进入时间,handler 执行完之后算出 duration(第 60 行),再通过 .Observe(duration) 投入桶中(第 64 行)。
左边还新增了三个测试接口(第 73-99 行):/api/hello(0-100ms 随机延迟)、/api/slow(500-2500ms)、/api/error(随机返回 4xx/5xx)。有了这三个接口,监控数据才有东西可看。
验证延迟分布
重启服务,发一批请求,然后看原始桶数据:
bash
for i in $(seq 1 10); do curl -s http://localhost:8080/api/hello > /dev/null; done
for i in $(seq 1 3); do curl -s http://localhost:8080/api/slow > /dev/null; done
curl http://localhost:8080/metrics | grep 'http_request_duration.*bucket'
注意 le="0.5"、le="1" 这些桶的计数------/api/slow 的请求会落在大桶里,和 /api/hello 完全不同。这些就是第八章 histogram_quantile() 计算 P99 的原材料。
go
package main

import (
	"fmt"
	"log"
	"math/rand"
	"net/http"
	"time"

	"github.com/prometheus/client_golang/prometheus"
	"github.com/prometheus/client_golang/prometheus/promauto"
	"github.com/prometheus/client_golang/prometheus/promhttp"
)

var (
	httpRequestsTotal = promauto.NewCounterVec(
		prometheus.CounterOpts{
			Name: "http_requests_total",
			Help: "HTTP 请求总数,按 method / endpoint / status 分组",
		},
		[]string{"method", "endpoint", "status"},
	)

	httpRequestDuration = promauto.NewHistogramVec(
		prometheus.HistogramOpts{
			Name:    "http_request_duration_seconds",
			Help:    "HTTP 请求耗时分布(秒)",
			Buckets: prometheus.DefBuckets,
		},
		[]string{"method", "endpoint"},
	)

	httpRequestsInFlight = promauto.NewGauge(
		prometheus.GaugeOpts{
			Name: "http_requests_in_flight",
			Help: "当前正在处理中的 HTTP 请求数",
		},
	)

	ordersTotal = promauto.NewCounter(
		prometheus.CounterOpts{
			Name: "business_orders_total",
			Help: "创建的订单总数",
		},
	)

	orderAmount = promauto.NewHistogram(
		prometheus.HistogramOpts{
			Name:    "business_order_amount",
			Help:    "订单金额分布",
			Buckets: []float64{10, 50, 100, 500, 1000, 5000},
		},
	)
)

type statusRecorder struct {
	http.ResponseWriter
	statusCode int
}

func (r *statusRecorder) WriteHeader(code int) {
	r.statusCode = code
	r.ResponseWriter.WriteHeader(code)
}

func instrumentHandler(endpoint string, handler http.HandlerFunc) http.HandlerFunc {
	return func(w http.ResponseWriter, r *http.Request) {
		httpRequestsInFlight.Inc()
		defer httpRequestsInFlight.Dec()

		start := time.Now()
		rec := &statusRecorder{ResponseWriter: w, statusCode: http.StatusOK}
		handler(rec, r)

		duration := time.Since(start).Seconds()
		httpRequestsTotal.WithLabelValues(
			r.Method, endpoint, fmt.Sprintf("%d", rec.statusCode),
		).Inc()
		httpRequestDuration.WithLabelValues(r.Method, endpoint).Observe(duration)
	}
}

func handleHealth(w http.ResponseWriter, r *http.Request) {
	w.WriteHeader(http.StatusOK)
	fmt.Fprintf(w, `{"status":"ok"}`)
}

func handleHello(w http.ResponseWriter, r *http.Request) {
	time.Sleep(time.Duration(rand.Intn(100)) * time.Millisecond)
	w.WriteHeader(http.StatusOK)
	fmt.Fprintf(w, `{"message":"hello, world!"}`)
}

func handleSlow(w http.ResponseWriter, r *http.Request) {
	time.Sleep(time.Duration(500+rand.Intn(2000)) * time.Millisecond)
	w.WriteHeader(http.StatusOK)
	fmt.Fprintf(w, `{"message":"slow response"}`)
}

func handleError(w http.ResponseWriter, r *http.Request) {
	time.Sleep(time.Duration(rand.Intn(50)) * time.Millisecond)
	if rand.Float64() < 0.3 {
		w.WriteHeader(http.StatusInternalServerError)
		fmt.Fprintf(w, `{"error":"internal server error"}`)
		return
	}
	if rand.Float64() < 0.2 {
		w.WriteHeader(http.StatusBadRequest)
		fmt.Fprintf(w, `{"error":"bad request"}`)
		return
	}
	w.WriteHeader(http.StatusOK)
	fmt.Fprintf(w, `{"message":"ok"}`)
}

func handleOrder(w http.ResponseWriter, r *http.Request) {
	time.Sleep(time.Duration(100+rand.Intn(300)) * time.Millisecond)
	amount := rand.Float64() * 5000
	ordersTotal.Inc()
	orderAmount.Observe(amount)
	w.WriteHeader(http.StatusCreated)
	fmt.Fprintf(w, `{"order_id":"%d","amount":%.2f}`, rand.Intn(100000), amount)
}

func main() {
	mux := http.NewServeMux()
	mux.HandleFunc("/health", instrumentHandler("/health", handleHealth))
	mux.HandleFunc("/api/hello", instrumentHandler("/api/hello", handleHello))
	mux.HandleFunc("/api/slow", instrumentHandler("/api/slow", handleSlow))
	mux.HandleFunc("/api/error", instrumentHandler("/api/error", handleError))
	mux.HandleFunc("/api/order", instrumentHandler("/api/order", handleOrder))
	mux.Handle("/metrics", promhttp.Handler())

	log.Printf("Server starting on :8080")
	if err := http.ListenAndServe(":8080", mux); err != nil {
		log.Fatalf("Server failed: %v", err)
	}
}
第五章 · 业务指标:监控你真正关心的
技术指标的边界
前四章的指标都在描述「HTTP 这一层发生了什么」------多少次请求、多少并发、响应多快。这些是技术指标,非常重要,但它们无法回答另一类问题:今天下了多少订单?大额订单(>1000 元)占几成?
这类数字跟 HTTP 状态码无关,它们是业务本身的语言。Prometheus 的埋点不限于技术指标------任何对业务有意义的数字,都可以用同样的方式暴露出来。
左边新增了两个业务指标(第 40-53 行):
ordersTotal:一个普通的 Counter,每创建一笔订单 +1orderAmount:一个 Histogram,但桶是自定义的------[10, 50, 100, 500, 1000, 5000]对应订单金额的分布区间,跟延迟的桶完全不同
handleOrder 里的两行埋点(第 119-120 行)必须写在业务逻辑里------因为 amount 是业务数据,只有这个 handler 自己知道。通用中间件能自动采集所有接口的 HTTP 层指标,但没办法代你记录订单金额。这是业务指标和技术指标的根本区别:技术指标可以在入口统一采集,业务指标必须在逻辑发生的地方埋点。
验证
bash
curl -X POST http://localhost:8080/api/order
curl http://localhost:8080/metrics | grep business_
你会看到 business_orders_total 1 和 business_order_amount_bucket 系列。多打几次,观察金额分布在各桶之间的变化。
yaml
global:
  scrape_interval: 5s
  evaluation_interval: 5s

scrape_configs:
  - job_name: "prometheus"
    static_configs:
      - targets: ["localhost:9090"]

  - job_name: "go-server"
    static_configs:
      - targets: ["server:8080"]
    metrics_path: /metrics
第六章 · Prometheus:告诉它去哪里抓
服务在说话,但没人在听
到目前为止,服务的 /metrics 端点已经能输出所有指标了。但这只是一个普通的 HTTP 端点------没有人主动来拿这些数据,它们就只是在虚空中刷新。
Prometheus 的职责就是来拿。左边就是告诉 Prometheus「去哪里拿、多久拿一次」的配置文件(prometheus/prometheus.yml)。
两个关键字段
scrape_interval: 5s (第 1-2 行):每 5 秒主动拉取一次目标服务的 /metrics。这就是第一章架构图里那个「每 5 秒拉取」的箭头------由 Prometheus 发起 GET 请求,而不是服务主动上报。
targets: ["server:8080"] (第 10-13 行):这里写的是 server 而不是 localhost,因为后面会用 Docker Compose 启动整个监控栈,在 Docker 网络里容器之间通过服务名互相访问。server 就是 docker-compose 里定义的 Go 服务的名字。
如果你在本地不用 Docker Compose 直接跑 Prometheus,把这里改成 localhost:8080。
yaml
services:
  server:
    build: ./server
    ports:
      - "8080:8080"
    restart: unless-stopped

  client:
    build: ./client
    depends_on:
      - server
    restart: unless-stopped

  prometheus:
    image: prom/prometheus:v2.50.1
    ports:
      - "9090:9090"
    volumes:
      - ./prometheus/prometheus.yml:/etc/prometheus/prometheus.yml
      - prometheus_data:/prometheus
    command:
      - "--config.file=/etc/prometheus/prometheus.yml"
      - "--storage.tsdb.retention.time=7d"
    depends_on:
      - server
    restart: unless-stopped

  grafana:
    image: grafana/grafana:10.3.3
    ports:
      - "3000:3000"
    environment:
      - GF_SECURITY_ADMIN_USER=admin
      - GF_SECURITY_ADMIN_PASSWORD=admin
    volumes:
      - ./grafana/provisioning:/etc/grafana/provisioning
      - ./grafana/dashboards:/var/lib/grafana/dashboards
      - grafana_data:/var/lib/grafana
    depends_on:
      - prometheus
    restart: unless-stopped

volumes:
  prometheus_data:
  grafana_data:
第七章 · Docker Compose:一键跑通全套
四个服务,一条命令
现在需要同时运行的东西越来越多。用 Docker Compose 把它们全部编排在一起,一条命令启动。
左边的 docker-compose.yml 定义了四个服务(高亮部分):
| 服务 | 端口 | 作用 |
|---|---|---|
server |
8080 | Go 服务,业务接口 + /metrics |
client |
--- | 压测客户端,自动持续向所有接口发请求 |
prometheus |
9090 | 时序数据库 + PromQL 查询界面 |
grafana |
3000 | 可视化面板,账号 admin / admin |
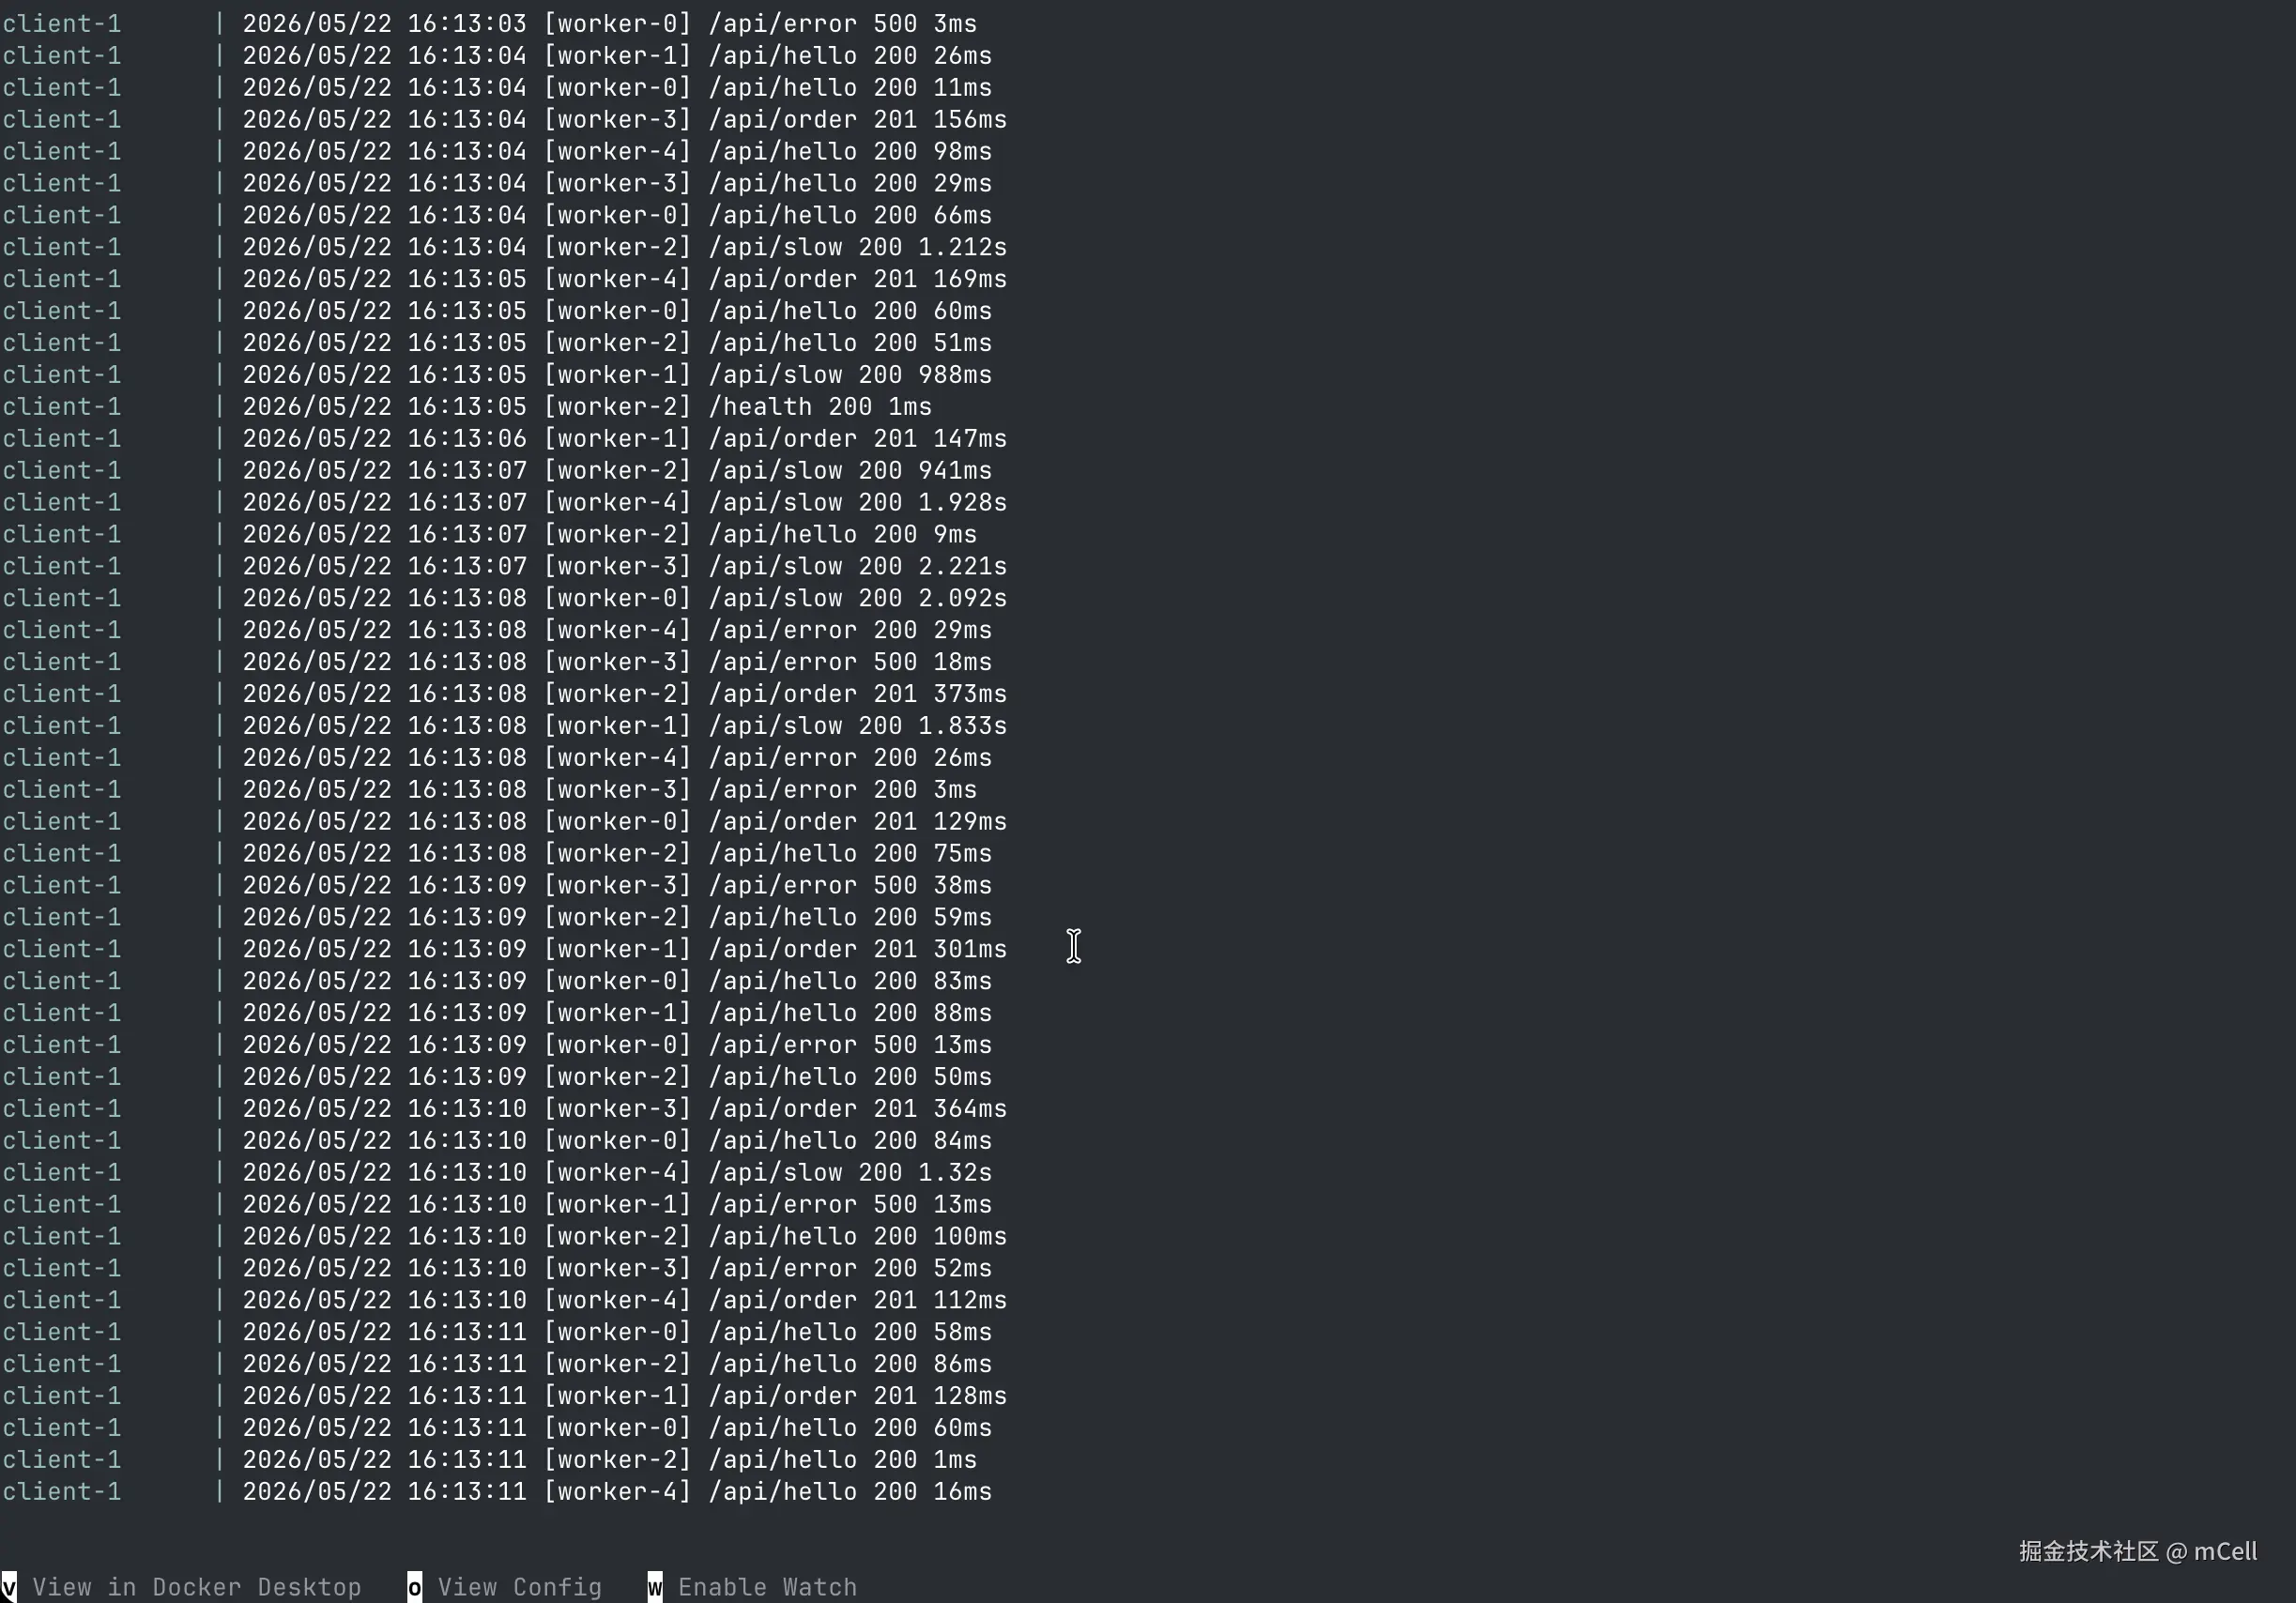
client 是 demo 仓库附带的压测服务------它会按权重随机向各接口发请求(/api/hello 40%、/api/error 20%、/api/order 20%、/api/slow 10%、/health 10%),持续产生真实的流量分布。你不需要手动发任何 curl 请求 ,从 docker compose up 那一刻起,数据就会源源不断进来。
Prometheus 挂载了上一章写的配置文件(第 19 行)。Grafana 挂载了两个目录(第 36-37 行):一个用来自动注册 Prometheus 数据源,一个用来自动导入预置的 Dashboard。
启动并确认数据在流动
在 demo 仓库根目录执行:
bash
docker compose up --build等容器全部启动(大约 30 秒),打开 http://localhost:9090/targets。你应该看到 go-server 的 State 是 UP,Last Scrape 在持续刷新。这个页面是 Prometheus 的「数据源健康视图」------它告诉你哪些目标正在被正常抓取。
再等 1-2 分钟让 client 积累一些流量,然后在 Prometheus UI(http://localhost:9090 → Graph)里输入:
http_requests_total如果看到多条带不同标签的序列,说明整个链路已经打通了。
promql
rate(http_requests_total[1m])

sum(rate(http_requests_total[1m])) by (endpoint)

sum(rate(http_requests_total{status=~"5.."}[1m])) / sum(rate(http_requests_total[1m]))

http_requests_in_flight

histogram_quantile(0.99, sum(rate(http_request_duration_seconds_bucket[5m])) by (le, endpoint))

histogram_quantile(0.50, sum(rate(http_request_duration_seconds_bucket[5m])) by (le, endpoint))

rate(business_orders_total[1m]) * 60
第八章 · PromQL:用问题驱动查询
Prometheus 存的是时间序列
在写查询之前,先理解 Prometheus 里数据的形状。
它存储的不是「最新值」,而是一条条随时间变化的序列:每隔 5 秒抓一次,每次的值都记下来。http_requests_total 这个名字背后,实际上有多条序列------每种标签组合各一条,每条都是一列时间点与值:
sql
http_requests_total{endpoint="/api/hello", method="GET", status="200"}
  @14:00:00  42
  @14:00:05  43
  @14:00:10  45
  ...
这意味着你在查询时,不是在查「一个数」,而是在查「某条(或某些)时间线上的数据」。
最重要的一条原则:Counter 必须配 rate()
左边第 1 行是你会用得最多的查询形式:rate(http_requests_total[1m])。
rate() 的作用:把 Counter 的单调递增曲线,转换成「每秒变化了多少」的速率曲线。[1m] 是计算窗口,用最近 1 分钟的数据点来平均。窗口越大,曲线越平滑;窗口越小,对突发越敏感。
如果直接查原始的 http_requests_total,你只会看到一条斜率为正的直线,完全看不出 QPS 的波动。对 Counter 来说,有意义的永远是变化速率,而不是累计值本身。
在 Prometheus UI 里试一试
打开 http://localhost:9090,切到 Graph 标签页,把左边这 7 条查询逐一粘贴进去执行,观察图形的变化。
每条查询的结构都应用了前面讲过的某个概念:rate() 处理 Counter、by (endpoint) 按维度聚合、histogram_quantile() 计算分位数、Gauge 直接查。把查询和概念对应起来,是理解 PromQL 最直接的方式。
yaml
apiVersion: 1

datasources:
  - name: Prometheus
    type: prometheus
    access: proxy
    url: http://prometheus:9090
    isDefault: true
    editable: true
第九章 · Grafana:把数字变成图表
先看预置的 Dashboard
好消息是,demo 仓库已经预置了一份完整的 Dashboard,Grafana 启动时会自动加载它。
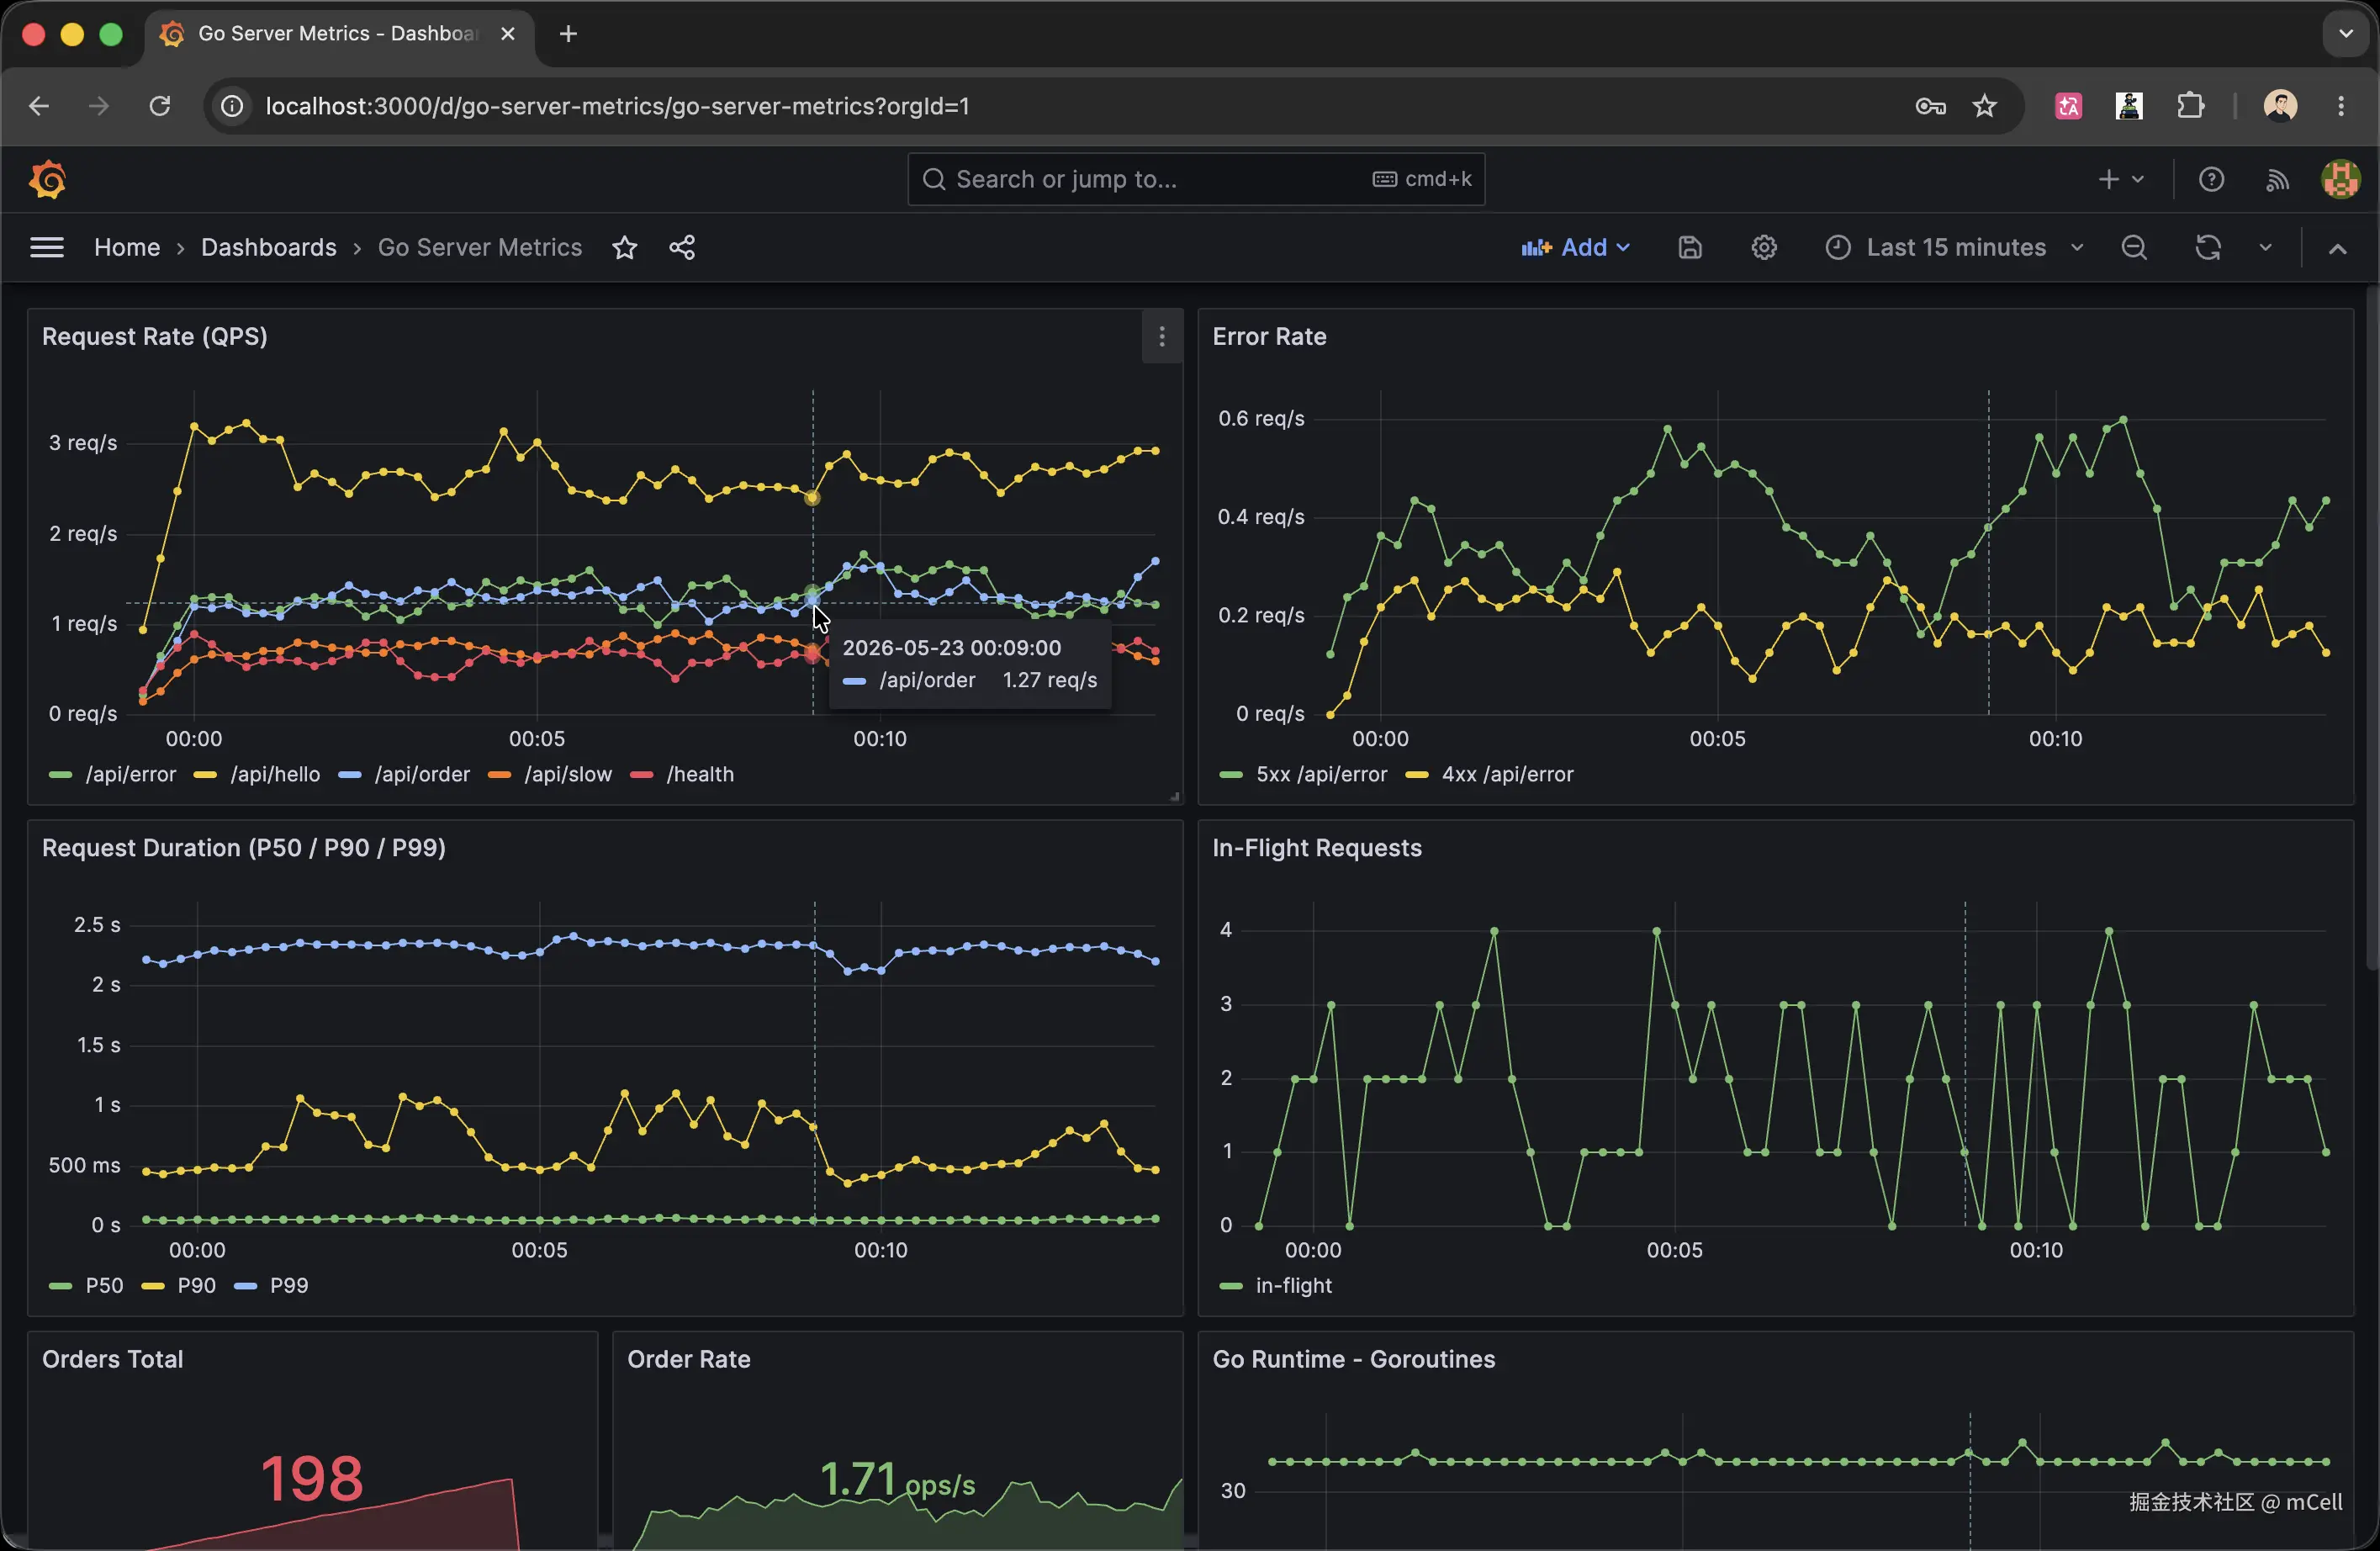
打开 http://localhost:3000(admin / admin),进入 Dashboards 页面,你应该已经看到一个名为 Go Server Metrics 的 Dashboard。点进去,就是覆盖 QPS、错误率、P99 延迟、当前并发、订单速率的全套面板。
这个 Dashboard 是通过左边的 grafana/provisioning/datasources/datasource.yml 配置自动加载的------Grafana 启动时读取 provisioning 目录下的文件,自动注册 Prometheus 数据源,再加载 grafana/dashboards/ 下的 JSON 文件生成面板。
这种「配置即代码」的方式叫 provisioning------把 Dashboard 的 JSON 提交到 Git,每次部署自动恢复,不需要手动点界面配置。
自己创建一个 Panel
预置 Dashboard 看完了,动手创建一个 Panel 来理解它是怎么工作的:
- Dashboards → New → New Dashboard → Add visualization
- 右侧 Data source 选 Prometheus
- Query 框输入:
sum(rate(http_requests_total[1m])) by (endpoint) - 面板类型选 Time series
- 右侧 Panel options → Title 填
QPS by Endpoint - Save dashboard
你会看到各接口 QPS 的折线图实时更新。每个 Panel 背后就是一条 PromQL 查询------Grafana 本身不存数据,它只是定时向 Prometheus 发查询,把返回的时间序列渲染成图形。
Panel Description:监控即沟通
Grafana 每个 Panel 右上角有个 Edit 入口,里面有一个 Description 字段。建议养成习惯:每个 Panel 都写清楚「这个图在回答什么问题、异常时意味着什么」。
凌晨被告警叫醒的同事,打开 Dashboard 时脑子还没转起来。清晰的 Description 能让他在 10 秒内理解这个图的含义,而不是先猜 5 分钟。
监控不只是给自己看的,是给未来某个凌晨被叫醒的人看的。
第十章 · 回头看,往前走
开头的五个问题,现在都有了工具去回答:
- 接口被请求了多少次? →
rate(http_requests_total[1m])by endpoint,画成折线图 - 有多少请求正在处理中? → 直接查
http_requests_in_flight,加一个 Stat Panel - 响应时间分布是什么样? →
histogram_quantile(0.99, ...)看 P99,对比 P50 看尾部 - 错误率从什么时间升高? → 错误率折线图,时间轴上找到拐点
- 凌晨三点那次飙升是什么原因? → 在 Prometheus Graph 里把时间范围拉到那段,逐接口、逐标签看哪条序列异常