Prometheus(由go语言开发)是一套开源的监控&报警&时间序列 (按照时间排序)数据库的组合。因为kubernetes(俗称k8s)的流行带动了prometheus的发展。它可以监控主机,服务,容器,支持多种exporter采集数据,还支持pushgateway进行数据上报,Prometheus性能足够支撑上万台规模的集群。
https://prometheus.io/docs/introduction/overview/
时间序列数据(TimeSeries Data) : 按照时间顺序记录系统、设备状态变化的数据被称为时序数据。这种时序数据,会应用到很多场景, 如:
-
最常见的就是我们系统中的日志
-
无人驾驶车辆运行中要记录的经度,纬度,速度,方向,旁边物体的距离等等。每时每刻都要将数据记录下来做分析。
-
某一个地区的各车辆的行驶轨迹数据、车流量
-
传统证券行业实时交易数据
-
实时运维监控数据,网卡流量图,服务的当前状态,资源的使用情况,比如说,你所监控的内容出现了直线飙升、断崖式下跌、断线,一般都意味着出现了问题,不管是什么时候发生的,都要赶紧查一下出了什么问题
下载prometheus压缩包
yum install -y lrzsz
解压到home目录中: tar xf prometheus-3.3.0.linux-amd64.tar.gz -C /home
进入目录:cd prometheus-3.3.0.linux-amd64/
执行命令: nohup ./prometheus --config.file=prometheus.yml &
验证是否运行:ss -unlpt | grep 9090

现在就能访问网页了:192.168.11.160:9090
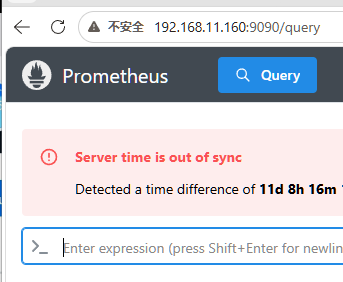
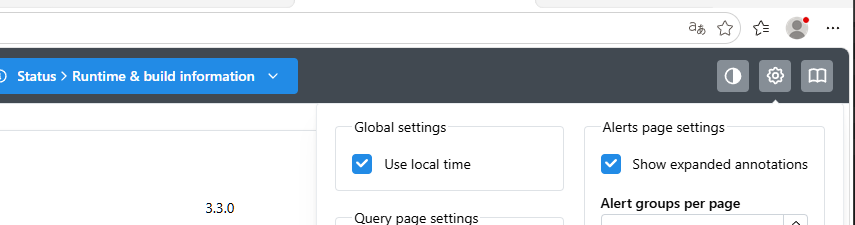
时间要勾选
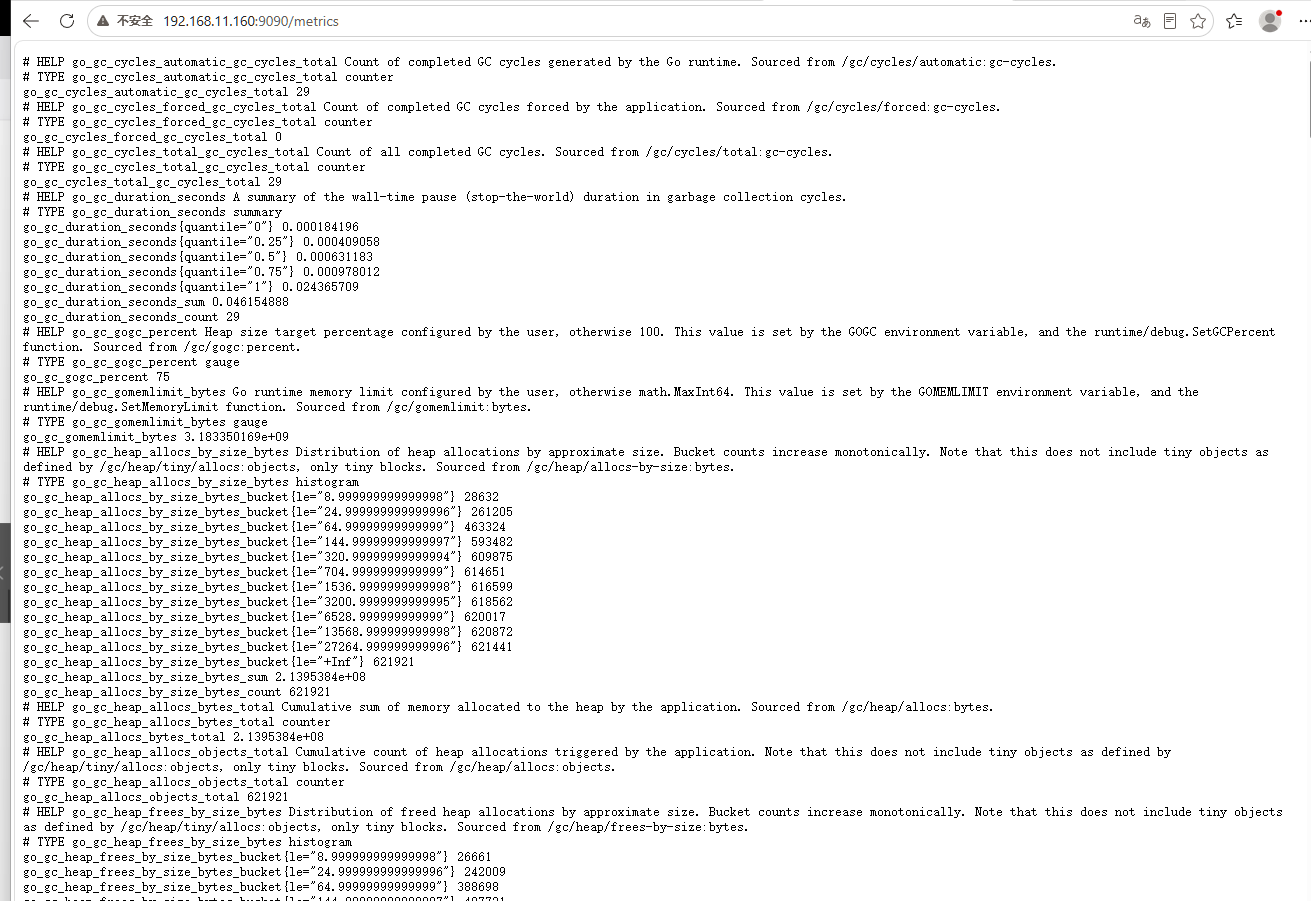
查看所有指标:192.168.11.160:9090/metrics
被监控节点
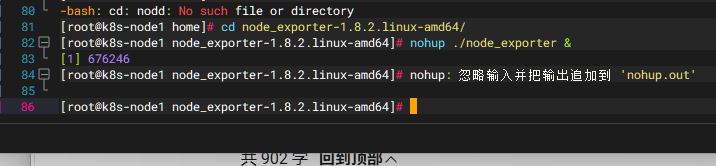
想要监控哪个节点,需要下载node_exporter
tar xf node_exporter-1.8.2.linux-amd64.tar.gz -C /home/
进入目录:cd node_exporter-1.8.2.linux-amd64/
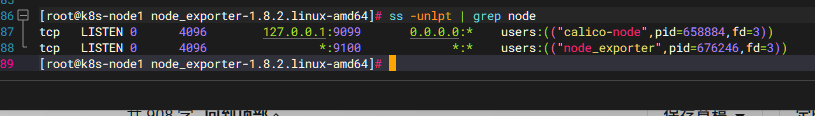
执行启动: nohup ./node_exporter &
ss -unlpt | grep node
在Prometheus监控端
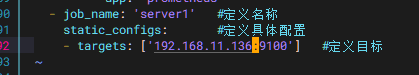
添加监控信息:vim prometheus.yml(在文件末尾编写)
重启服务:先关服务:fg 1 ,启动服务: nohup ./prometheus --config.file=prometheus.yml &
登陆网页
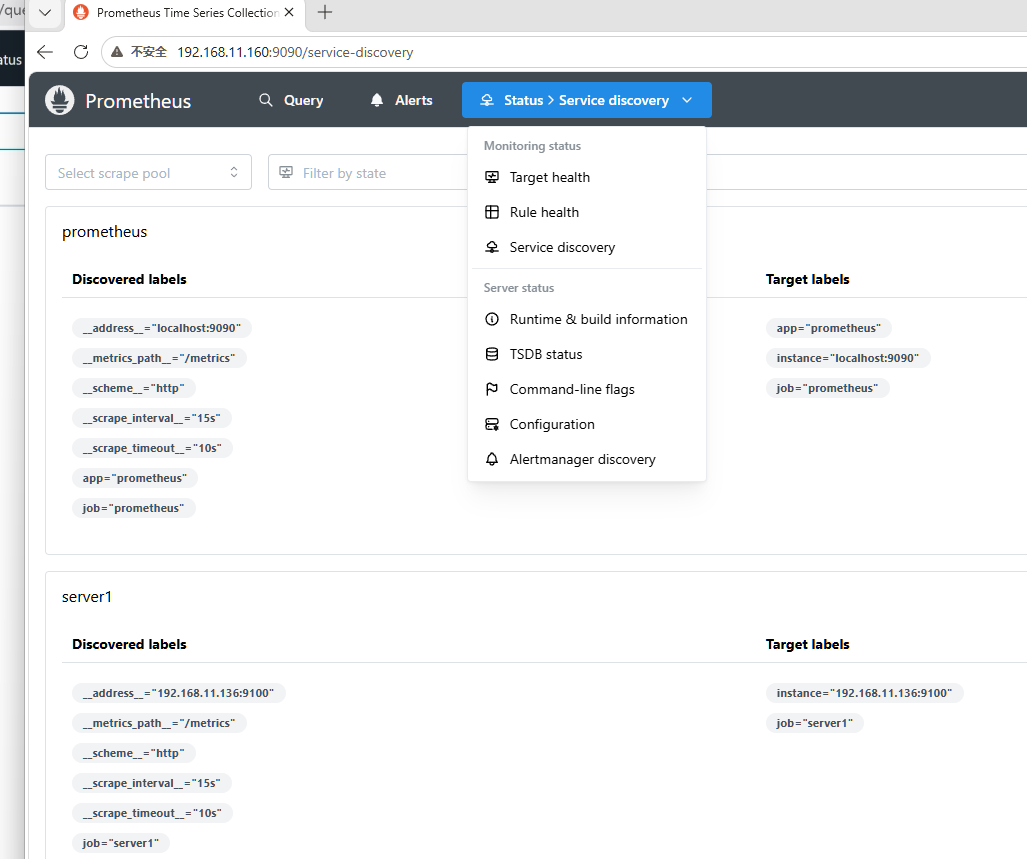
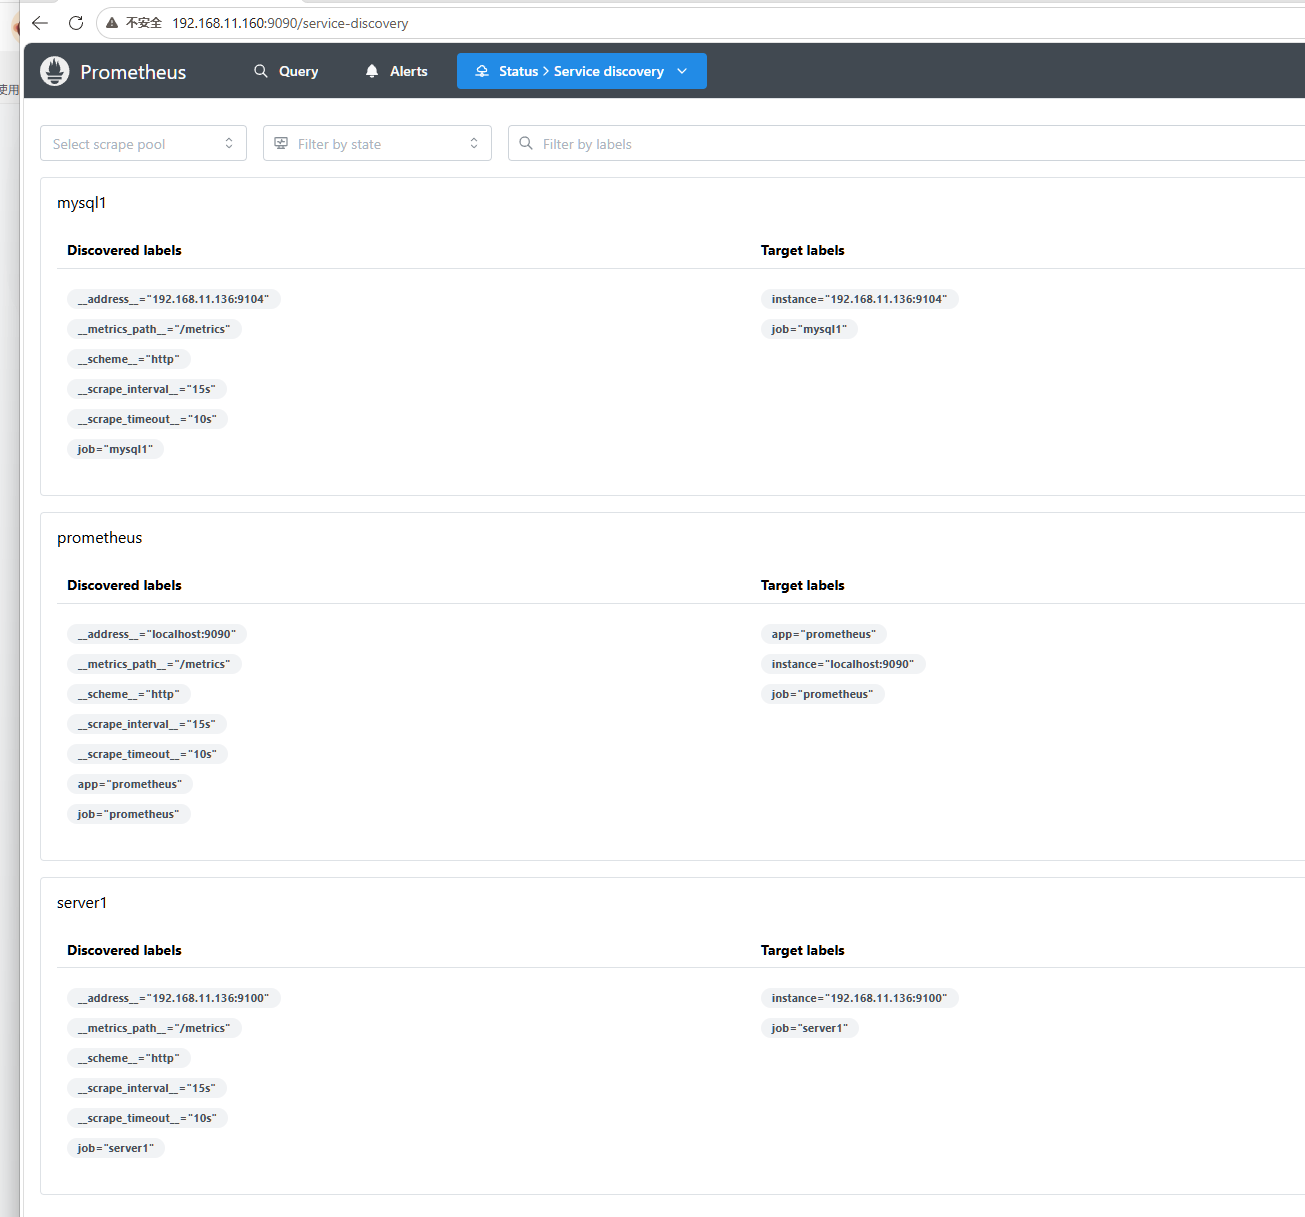
192.168.11.160:9090 点击status > Service discovery
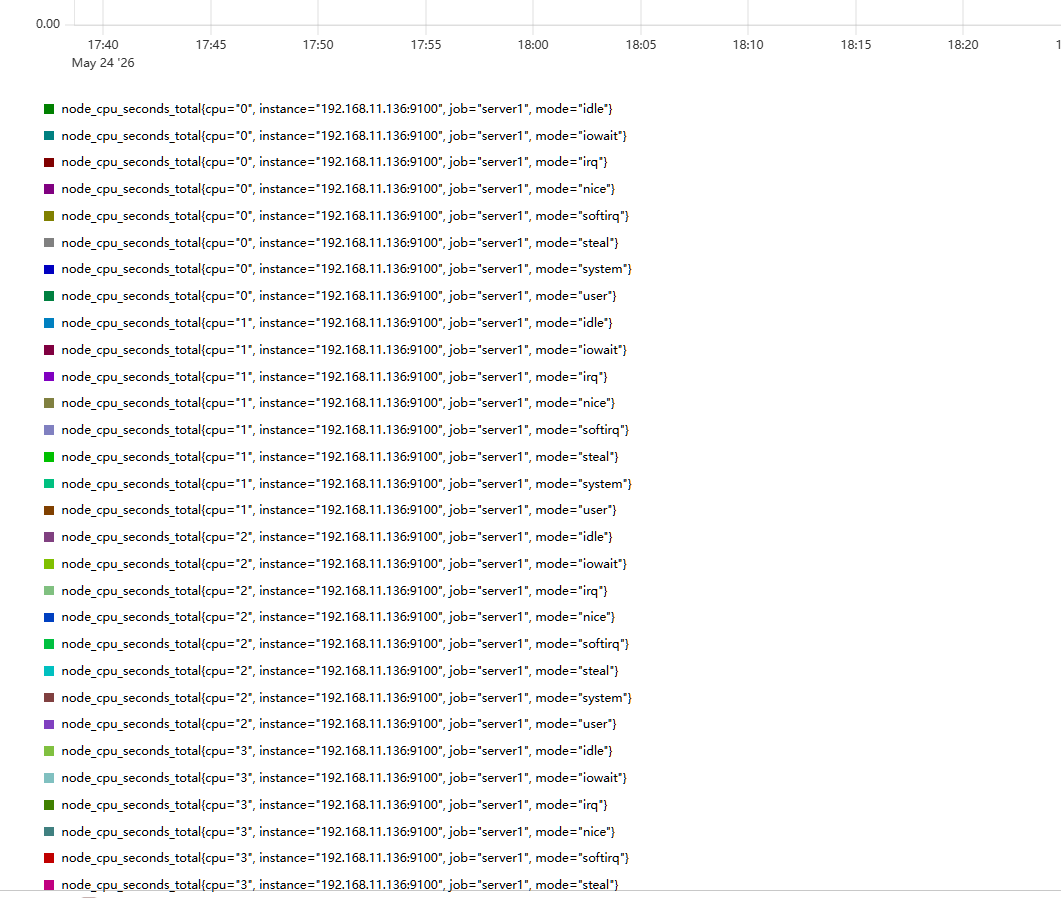
搜索 Query > node_cpu_seconds_total > Execute
做MySQL监控
下载mysql服务:yum install -y mysql-server
拉取并解压MySQL压缩包: tar xf mysqld_exporter-0.16.0.linux-amd64.tar.gz -C /home/
启动MySQL服务:systemctl status mysqld ,systemctl status mysql
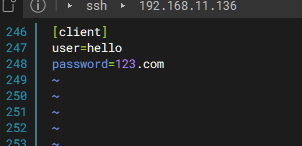
创建用户:mysqladmin -u root password "123.com"
编译文件:vim .my.cnf
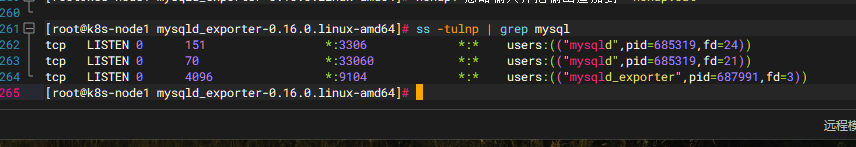
执行启动命令: nohup ./mysqld_exporter --config.my-cnf=.my.cnf &
在Prometheus监控服务节点
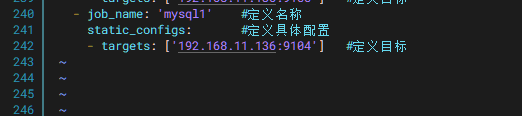
编译文件vim prometheus.yml (在文件最后加入)
关闭工作 :fg 1 , 启动工作:nohup ./prometheus --config.file=prometheus.yml &
在网页端
刷新网页 MySQL添加成功
监控nginx设置
在nginx节点
下载nginx:yum install -y nginx
创建目录: mkdir /home/nginx
拉取并解压文件: tar xf nginx-prometheus-exporter_1.5.1_linux_amd64.tar.gz -C /home/nginx/
启动服务: nohup ./nginx-prometheus-exporter &

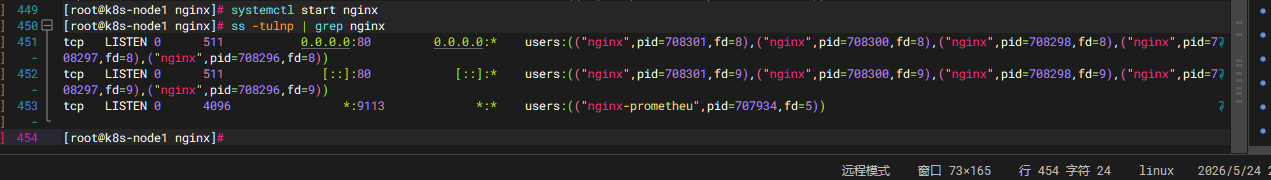
启动nginx服务:systemctl start nginx
在Prometheus节点
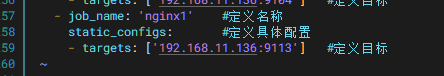
vim prometheus.yml
fg 1 , nohup ./prometheus --config.file=prometheus.yml &
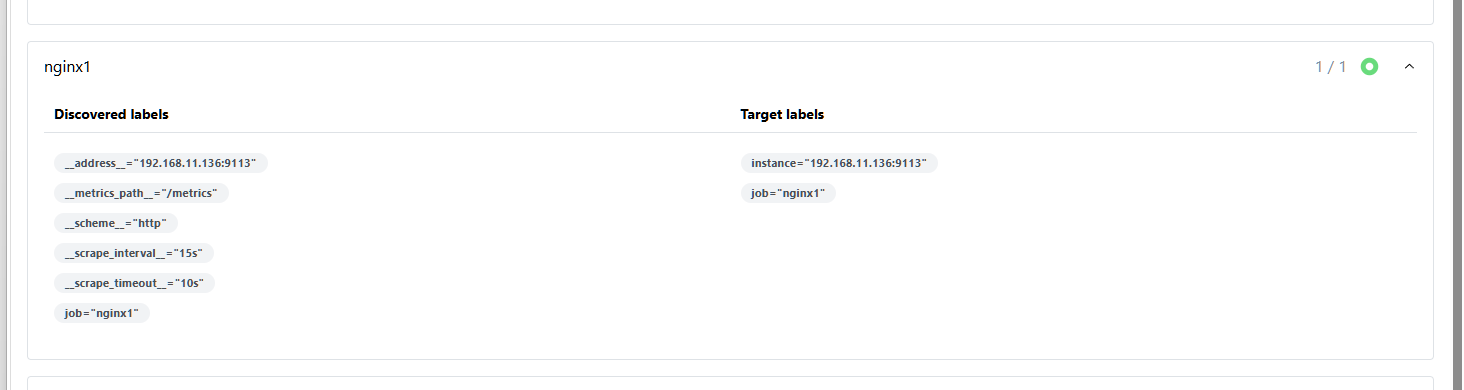
在网页端刷新
编译安装nginx
拉取并解压nginx压缩包:tar xf nginx-1.27.3.tar.gz
下载环境依赖:yum install -y pcre-devel zlib-devel
进入目录:cd nginx-1.27.3/
编译安装: ./configure --with-http_stub_status_module --prefix=/usr/local/nginx
make && make install
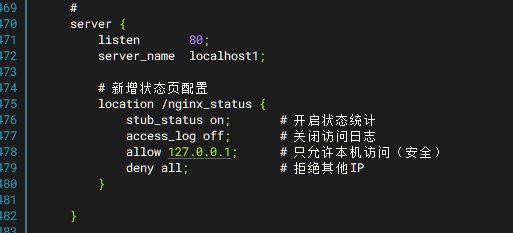
编译文件:vim /usr/local/nginx/conf/nginx.conf
server {
listen 80;
server_name localhost1;
新增状态页配置
location /nginx_status {
stub_status on; # 开启状态统计
access_log off; # 关闭访问日志
allow 127.0.0.1; # 只允许本机访问(安全)
deny all; # 拒绝其他IP
}
}
cd /home
启动nginx服务: /usr/local/nginx/sbin/nginx
cd /home/nginx 执行命令: nohup ./nginx-prometheus-exporter --nginx.scrape-uri=http://127.0.0.1:8080/stub_status &
部署grafana可视化仪表盘
在Prometheus节点
安装:yum install -y https://dl.grafana.com/enterprise/release/grafana-enterprise-11.3.1-1.x86_64.rpm
启动服务:systemctl start grafana-server.service

在网页上访问192.168.11.160:3000
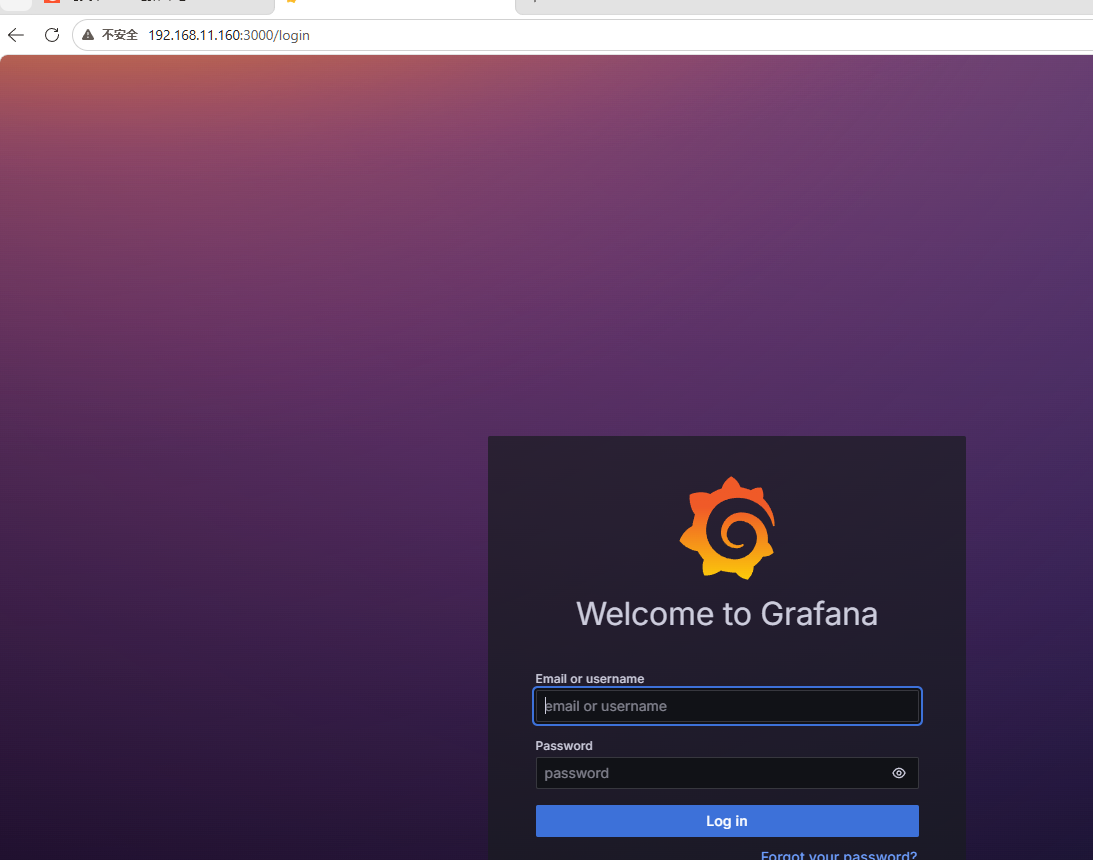
账号密码默认:admin
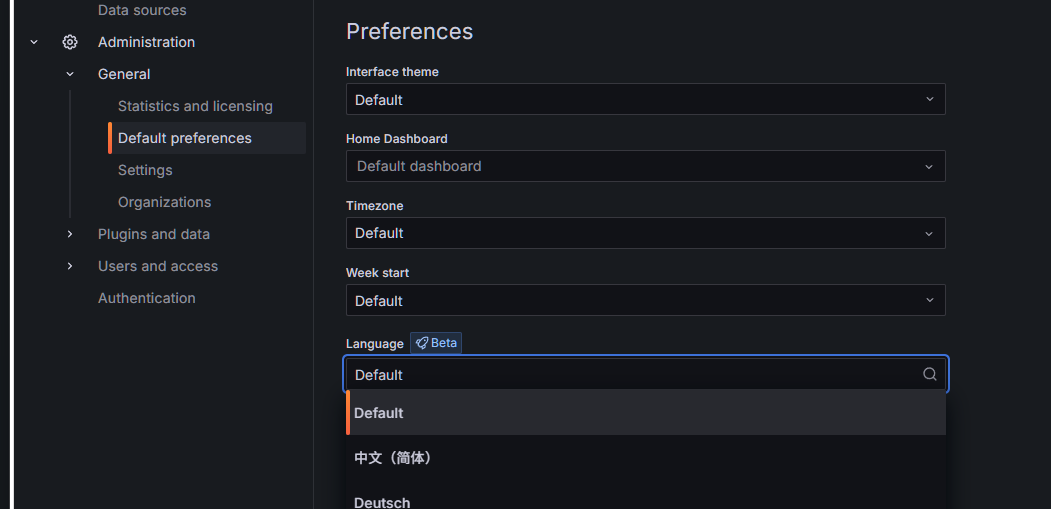
可修改语言
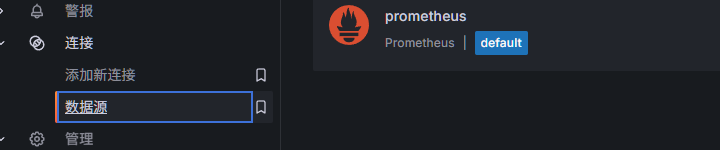
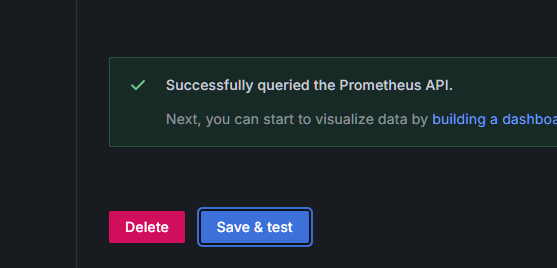
添加Prometheus
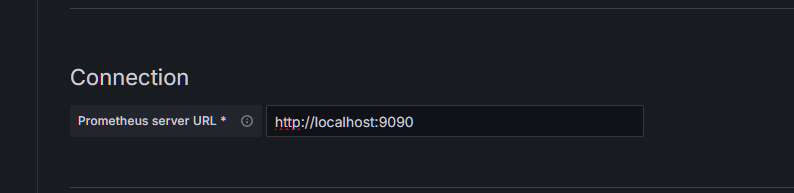
点击测试
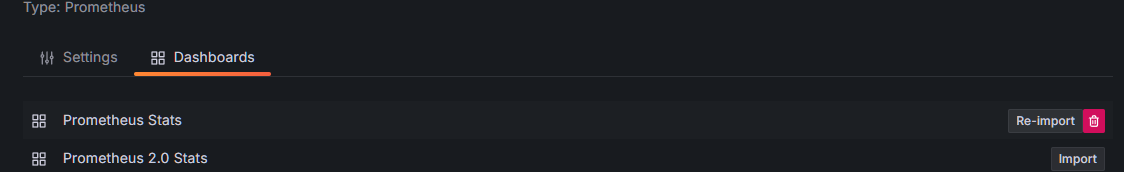
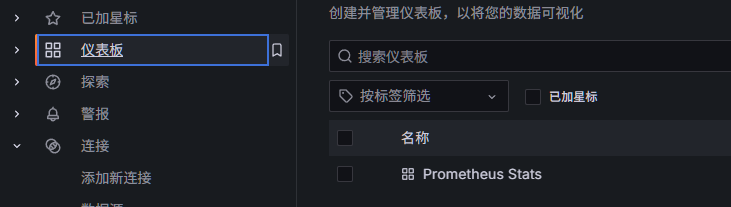
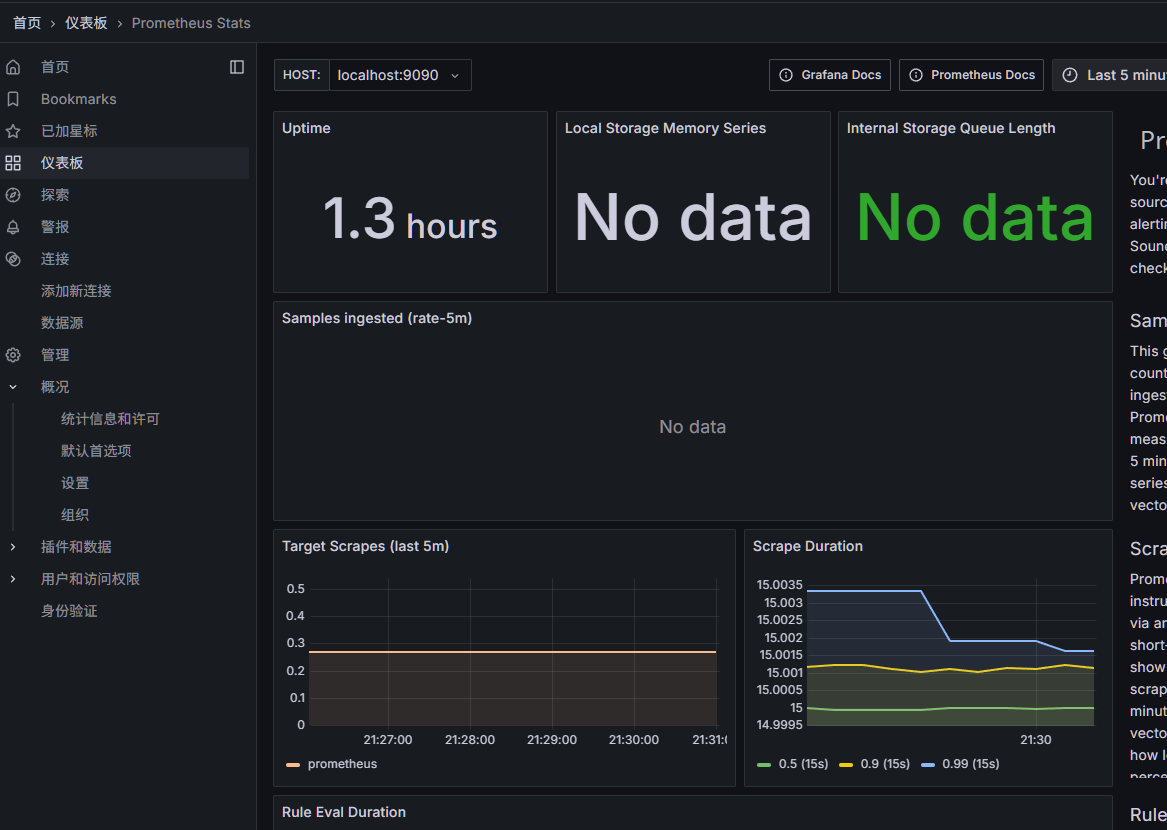
数据展示
grafana仪表模板下载网页:https://grafana.com/grafana/dashboards/