📌 学习目标
- 掌握添加Canvas源的实现方法
- 理解相关API的使用
- 能够独立完成类似功能开发
🎯 核心概念
向地图添加Canvas数据源。
💻 完 整 代 码
代码示例
js
//Animation from https://javascript.tutorials24x7.com/blog/how-to-draw-animated-circles-in-html5-canvas
const canvas = document.getElementById('canvasID');
const ctx = canvas.getContext('2d');
canvas.style.display = 'none';
const circles = [];
const radius = 20;

function Circle(x, y, dx, dy, radius, color) {
    this.x = x;
    this.y = y;
    this.dx = dx;
    this.dy = dy;

    this.radius = radius;

    this.draw = function () {
        ctx.beginPath();
        ctx.arc(this.x, this.y, this.radius, 0, Math.PI * 2, false);
        ctx.strokeStyle = color;
        ctx.stroke();
    };

    this.update = function () {
        if (this.x + this.radius > 400 || this.x - this.radius < 0) {
            this.dx = -this.dx;
        }

        if (this.y + this.radius > 400 || this.y - this.radius < 0) {
            this.dy = -this.dy;
        }

        this.x += this.dx;
        this.y += this.dy;

        this.draw();
    };
}

for (let i = 0; i < 5; i++) {
    const color = `#${(0x1000000 + Math.random() * 0xffffff).toString(16).substr(1, 6)}`;
    const x = Math.random() * (400 - radius * 2) + radius;
    const y = Math.random() * (400 - radius * 2) + radius;

    const dx = (Math.random() - 0.5) * 2;
    const dy = (Math.random() - 0.5) * 2;

    circles.push(new Circle(x, y, dx, dy, radius, color));
}

function animate() {
    requestAnimationFrame(animate);
    ctx.clearRect(0, 0, 400, 400);

    for (let r = 0; r < 5; r++) {
        circles[r].update();
    }
}

animate();

const map = new maplibregl.Map({
    container: 'map',
    zoom: 5,
    minZoom: 4,
    center: [95.899147, 18.088694],
    style: 'https://demotiles.maplibre.org/style.json'
});

map.on('load', () => {
    map.addSource('canvas-source', {
        type: 'canvas',
        canvas: 'canvasID',
        coordinates: [
            [91.4461, 21.5006],
            [100.3541, 21.5006],
            [100.3541, 13.9706],
            [91.4461, 13.9706]
        ],
        // 如果Canvas源是动画的,设置为true。如果Canvas是静态的,设置为false以提高性能。
        animate: true
    });

    map.addLayer({
        id: 'canvas-layer',
        type: 'raster',
        source: 'canvas-source'
    });
});
代码示例
html
<!DOCTYPE html>
<html lang="en">
<head>
    <title>Add a canvas source</title>
    <meta property="og:description" content="向地图添加画布源。" />
    <meta property="og:created" content="2025-06-25" />
    <meta charset='utf-8'>
    <meta name="viewport" content="width=device-width, initial-scale=1">
    <link rel='stylesheet' href='https://unpkg.com/maplibre-gl@5.24.0/dist/maplibre-gl.css' />
    <script src='https://unpkg.com/maplibre-gl@5.24.0/dist/maplibre-gl.js'></script>
    <style>
        body { margin: 0; padding: 0; }
        html, body, #map { height: 100%; }
    </style>
</head>
<body>
<canvas id="canvasID" width="400" height="400">Canvas not supported</canvas>
<div id="map"></div>
<script>
    //Animation from https://javascript.tutorials24x7.com/blog/how-to-draw-animated-circles-in-html5-canvas
    const canvas = document.getElementById('canvasID');
    const ctx = canvas.getContext('2d');
    canvas.style.display = 'none';
    const circles = [];
    const radius = 20;

    function Circle(x, y, dx, dy, radius, color) {
        this.x = x;
        this.y = y;
        this.dx = dx;
        this.dy = dy;

        this.radius = radius;

        this.draw = function () {
            ctx.beginPath();
            ctx.arc(this.x, this.y, this.radius, 0, Math.PI * 2, false);
            ctx.strokeStyle = color;
            ctx.stroke();
        };

        this.update = function () {
            if (this.x + this.radius > 400 || this.x - this.radius < 0) {
                this.dx = -this.dx;
            }

            if (this.y + this.radius > 400 || this.y - this.radius < 0) {
                this.dy = -this.dy;
            }

            this.x += this.dx;
            this.y += this.dy;

            this.draw();
        };
    }

    for (let i = 0; i < 5; i++) {
        const color = `#${(0x1000000 + Math.random() * 0xffffff).toString(16).substr(1, 6)}`;
        const x = Math.random() * (400 - radius * 2) + radius;
        const y = Math.random() * (400 - radius * 2) + radius;

        const dx = (Math.random() - 0.5) * 2;
        const dy = (Math.random() - 0.5) * 2;

        circles.push(new Circle(x, y, dx, dy, radius, color));
    }

    function animate() {
        requestAnimationFrame(animate);
        ctx.clearRect(0, 0, 400, 400);

        for (let r = 0; r < 5; r++) {
            circles[r].update();
        }
    }

    animate();

    const map = new maplibregl.Map({
        container: 'map',
        zoom: 5,
        minZoom: 4,
        center: [95.899147, 18.088694],
        style: 'https://demotiles.maplibre.org/style.json'
    });

    map.on('load', () => {
        map.addSource('canvas-source', {
            type: 'canvas',
            canvas: 'canvasID',
            coordinates: [
                [91.4461, 21.5006],
                [100.3541, 21.5006],
                [100.3541, 13.9706],
                [91.4461, 13.9706]
            ],
            // 如果画布源是动画的则设置为true。如果画布是静态的,应将animate设置为false以提高性能。
            animate: true
        });

        map.addLayer({
            id: 'canvas-layer',
            type: 'raster',
            source: 'canvas-source'
        });
    });
</script>
</body>
</html>
🔍 代码解析
1. 创建Canvas动画
创建隐藏的Canvas元素,实现5个彩色圆形的动画效果:
- Circle类定义圆形的位置、速度、半径和颜色
- animate函数使用requestAnimationFrame实现平滑动画
- 圆形到达边界时反弹
2. 初始化地图
使用 new maplibregl.Map() 创建地图实例,配置基本参数。本示例中心点设置在缅甸附近。
3. 添加Canvas数据源
在 map.load 事件中添加 canvas 类型数据源:
type: 'canvas': 指定为Canvas源canvas: Canvas元素IDcoordinates: 地理坐标数组,定义Canvas在地图上的位置animate: true: 启用动画同步
4. 添加栅格图层
创建 raster 类型图层引用Canvas数据源。
⚙️ 参数说明
| 参数 | 类型 | 必填 | 说明 |
|---|---|---|---|
| container | string | 是 | 地图容器ID |
| style | string | 是 | 地图样式URL |
| center | number, number | 否 | 初始中心点,默认0, 0 |
| zoom | number | 否 | 初始缩放级别,默认0 |
Canvas源配置
| 属性 | 类型 | 说明 |
|---|---|---|
| type | string | 必须为 'canvas' |
| canvas | string/HTMLCanvasElement | Canvas元素ID或对象 |
| coordinates | array | 四角地理坐标数组 左下, 右下, 右上, 左上 |
| animate | boolean | 是否同步动画(默认false) |
🎨 效果说明
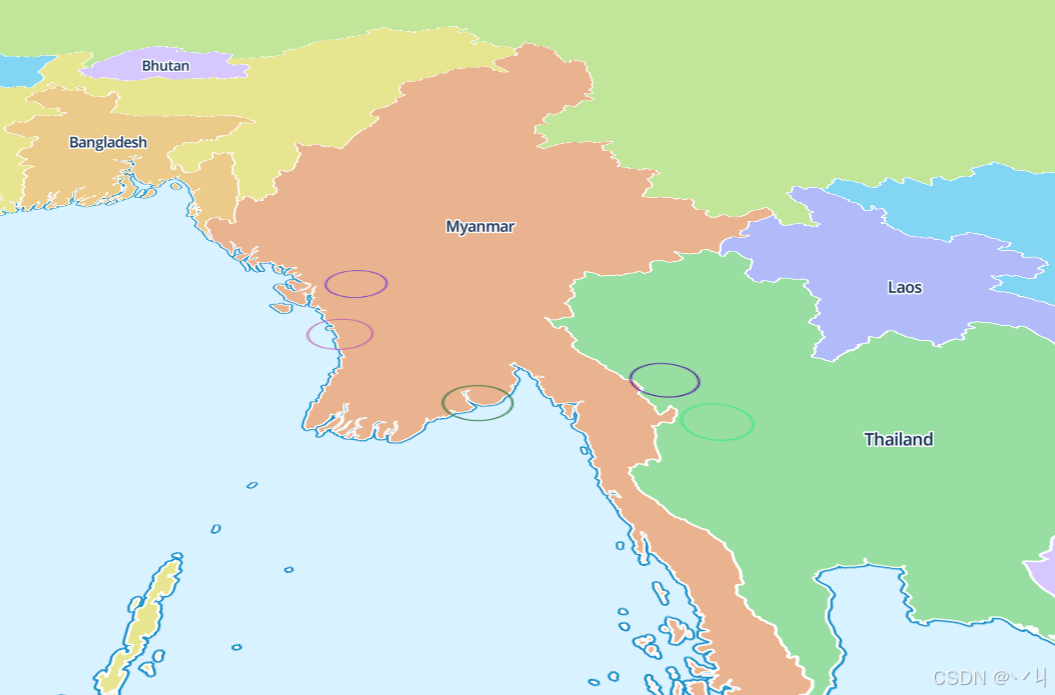
运行代码后:
- 地图显示缅甸区域(中心点 95.90°E, 18.09°N)
- Canvas动画(5个彩色圆形)叠加在指定地理区域
- 圆形在Canvas边界内反弹移动
- 用户可正常交互(拖拽、缩放、旋转)
💡 常 见 问 题
Q1: Canvas坐标和地理坐标如何对应?
A: coordinates 数组定义Canvas四角对应的地理坐标,按顺序:左下、右下、右上、左上。
Q2: animate属性有什么作用?
A: 设置为true时,地图会自动监听Canvas的变化并更新显示。
Q3: 如何更新Canvas内容?
A: 直接操作Canvas上下文即可,地图会自动同步(需设置animate: true)。
📝 练习任务
- 基础练习:修改圆形数量和颜色
- 进阶挑战:添加交互功能,点击地图添加新圆形
- 拓展思考:如何实现Canvas内容的动态更新?
🌟 最佳实践
- 性能优化: 静态Canvas设置animate: false,动态Canvas设置animate: true
- 坐标配置: 确保coordinates顺序正确(左下、右下、右上、左上)
- 隐藏Canvas: 使用CSS隐藏原始Canvas元素
- 动画优化: 使用requestAnimationFrame确保流畅动画
🔗 延伸阅读
-
下一课预告:将继续学习地图图层的基础知识
本文是MapLibre GL JS实践课程系列的一部分,欢迎关注收藏