Fuzzy C-Mean Clustering (FCM)
matlab R2026a 官网对FCM解释 ,非常清晰。
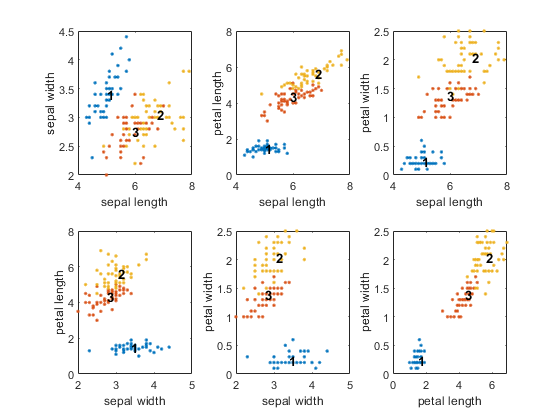
Fuzzy C-Means Clustering for Iris Data
matlab
clc; clear; close all;
% 加载水仙花
iris = load("iris.mat");

% 特征
features = iris.data;
% 标签
label = iris.label;
% 对应的逻辑索引
setosaIndex = label == 1;
versicolorIndex = label == 2;
virginicaIndex = label == 3;
% 根据逻辑索引获取对应的特征数据
setosa = features(setosaIndex,:);
versicolor = features(versicolorIndex,:);
virginica = features(virginicaIndex,:);

characteristics = ["sepal length","sepal width",...
    "petal length","petal width"];

pairs = [1 2; 1 3; 1 4; 2 3; 2 4; 3 4];
% 绘制每两个维度组合的数据点
for i = 1:6
    x = pairs(i,1);
    y = pairs(i,2);
    subplot(2,3,i)
    plot([setosa(:,x) versicolor(:,x) virginica(:,x)],...
         [setosa(:,y) versicolor(:,y) virginica(:,y)],".")
    xlabel(characteristics(x))
    ylabel(characteristics(y))
end
% fcm的options
options = fcmOptions(...
    NumClusters=3,...
    Exponent=2.0, ...
    MaxNumIteration=100, ...
    MinImprovement=1e-6);
% 禁用每次 FCM 迭代的目标函数值在命令窗口中的输出
options.Verbose = false;
% fcm聚类
[centers,U] = fcm(features,options);

%绘制结果
for i = 1:6
    subplot(2,3,i)
    for j = 1:options.NumClusters
        x = pairs(i,1);
        y = pairs(i,2);
        text(centers(j,x),centers(j,y),int2str(j),...
            FontWeight="bold");
    end
end
对应的聚类结果
对于 fcmOptions 描述
R2023a版本
matlab
opt = fcmOptions()

% 返回默认结果
opt =
  FCMOptions - 属性:
        NumClusters: 'auto'
           Exponent: 2
    MaxNumIteration: 100
     MinImprovement: 1.0000e-05
     DistanceMetric: 'euclidean'
            Verbose: 1
matlab
opt = fcmOptions(Name=Value)
eg:
% 聚类个数3,模糊因子2,最大迭代次数100,终止阈值1e-6
options = fcmOptions(...
    NumClusters=3,...
    Exponent=2.0, ...
    MaxNumIteration=100, ...
    MinImprovement=1e-6);
Properties
NumClusters:聚类个数,默认为"auto",即2个类别;Exponent:模糊因子,默认为2;MaxNumIteration:最大迭代次数,默认为100;MinImprovement:两次连续迭代之间目标函数的最小改进值,默认为1.0000e-05;Verbose:信息显示标志,指示是否在每次迭代后显示目标函数值;true- 显示目标函数false- 不显示目标函数
DistanceMetric:计算数据点与聚类中心之间距离的方法。euclidean- 欧氏距离mahalanobis- 马氏距离
myfcm
根据matlab源码,我们自己来写一个fcm算法
matlab
function varargout = myfcm(data, options)
    %   MYFCM
    %   数据
    %   选项 options
        %   可选参数

    % return
    % center: 聚类中心
    % fuzzyPartMat: 模糊隶属度
    % objFcn: 目标函数
    dataSize = size(data, 1);
    objFcn = zeros(options.MaxNumIteration, 1);                  % 目标函数数组
    fuzzyMatrix = fuzzy.clustering.initfcm(options, dataSize);   % 初始模糊隶属度
    numClusters = options.NumClusters;
    expo = options.Exponent;
    % clusterVolume = options.ClusterVolume;                      % 马氏距离中体积/缩放系数
    options.ClusterVolume = options.ClusterVolume(1,ones(1,options.NumClusters));
    brkCond = struct('isTrue',false,'description','');


    % Main Loop
    for iterId = 1 : options.MaxNumIteration
        memFcnMat = fuzzyMatrix.^expo;
        center = memFcnMat * data ./ (sum(memFcnMat, 2) * ones(1, size(data, 2)));
        % 是使用马氏距离还是欧氏距离
        if strcmp(options.DistanceMetric, getString(message('fuzzy:general:lblFcm_mahalanobis')))
            % dist 距离;covMat 协方差矩阵;brkCond 终止条件
            [dist, covMat, brkCond] = fuzzy.clustering.mahalanobisdist(center, data, memFcnMat, options.ClusterVolume);
        else
            dist = fuzzy.clustering.euclideandist(center, data);
            covMat = [];
        end

        tmp = (max(dist, eps)) .^ (-2 / (expo - 1));     % Calculate new Fuzzy Partition Matrix, suppose expo != 1
        fuzzyMatrix = tmp ./ (ones(numClusters, 1) * sum(tmp));
        objFcn(iterId) = sum(sum((dist .^ 2) .* memFcnMat));

        % 判断终止条件,返回true/false
        brkCond = checkBreakCondition(options, objFcn(iterId : -1 : max(1, iterId-1)), iterId, brkCond);

        % Check verbose condition
        % if options.Verbose
        %     fprintf(iterationProgressFormat, iterId, objFcn(iterId));
        %     if ~isempty(brkCond.description)
        %         fprintf('%s\n',brkCond.description);
        %     end
        % end

        % Break if early termination condition is true.
        if brkCond.isTrue
            objFcn(iterId+1:end) = [];
            break
        end
    end

    [varargout{1:nargout}] = assignOutputs(center,fuzzyMatrix,objFcn);

end

%% Local functions
function brkCond = checkBreakCondition(options, objFcn, iterId, stepBrkCond)
%%
    if stepBrkCond.isTrue
        brkCond = stepBrkCond;
        return
    end
    brkCond = struct('isTrue',false,'description','');
    improvement = diff(objFcn);

    if ~isempty(improvement) && abs(improvement)<=options.MinImprovement
        % 达到阈值终止
        brkCond.isTrue = true;
        brkCond.description = getString(message('fuzzy:general:msgFcm_minImprovementReached'));
        return
    end

    if iterId==options.MaxNumIteration
        % 达到最大迭代次数终止
        brkCond.isTrue = true;
        brkCond.description = getString(message('fuzzy:general:msgFcm_maxIterationReached'));
    end
end

function varargout = assignOutputs(center,fuzzyPartMat,objFcn)
%% 返回参数
    if nargout>2
        varargout{3} = objFcn;
    end
    if nargout>1
        varargout{2} = fuzzyPartMat;
    end
    if nargout>0
        varargout{1} = center;
    end
end
测试
使用前面的水仙花数据测试
matlab
clc; clear; close all;
iris = load("iris.mat");

features = iris.data;
label = iris.label;

setosaIndex = label==1;
versicolorIndex = label==2;
virginicaIndex = label==3;

setosa = features(setosaIndex,:);
versicolor = features(versicolorIndex,:);
virginica = features(virginicaIndex,:);

characteristics = ["sepal length","sepal width",...
    "petal length","petal width"];

pairs = [1 2; 1 3; 1 4; 2 3; 2 4; 3 4];

for i = 1:6
    x = pairs(i,1);
    y = pairs(i,2);
    subplot(2,3,i)
    plot([setosa(:,x) versicolor(:,x) virginica(:,x)],...
         [setosa(:,y) versicolor(:,y) virginica(:,y)],".")
    xlabel(characteristics(x))
    ylabel(characteristics(y))
end

options = fcmOptions(...
    NumClusters=3,...
    Exponent=2.0, ...
    MaxNumIteration=100, ...
    MinImprovement=1e-6, Verbose=0);

% % options.Verbose = false;

[centers,U] = myfcm(features, options);


for i = 1:6
    subplot(2,3,i)
    for j = 1:options.NumClusters
        x = pairs(i,1);
        y = pairs(i,2);
        text(centers(j,x),centers(j,y),int2str(j),...
            FontWeight="bold");
    end
end