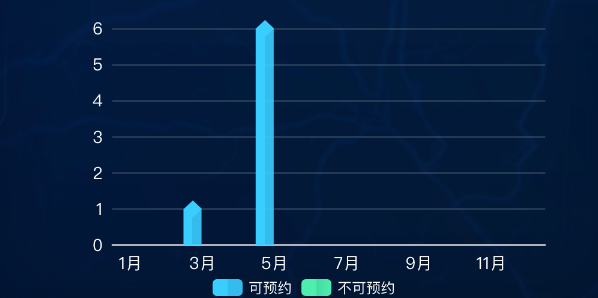
其实就是柱子加个横向渐变并且上下底加个菱形,挪个角度就好,但是不咋好看,不过底下加菱形会压线,所以下面实例只在顶部加的菱形
bash
// 左中柱状图(立体效果:渐变柱 + 顶部菱形)
const initlineChart = () => {
  if (!lineChart.value) return
  if (chartInstance2) {
    chartInstance2.dispose()
    chartInstance2 = null
  }
  chartInstance2 = echarts.init(lineChart.value)

  const xAxisData = lineChartData.value.map((item) => item.name)
  const yesData = lineChartData.value.map((item) => item.value) // 可预约
  const noData = lineChartData.value.map((item) => item.value2) // 不可预约

  // 计算每个柱子的实际像素宽度(用于菱形大小和偏移,此处固定大小即可)
  // 为了让菱形正好骑在柱顶,使用 symbolPosition: 'end' + symbolOffset 根据菱形高度微调
  const diamondHeight = 14 // 菱形高度(px)
  const offsetY = -diamondHeight / 2 // 向上偏移一半高度

  const option = {
    tooltip: {
      trigger: 'axis',

      axisPointer: {
        type: 'shadow',
        shadowStyle: {
          width: 30,
        },
      },
      formatter: (params) => {
        // 只显示 bar 系列(可预约、不可预约)的值
        let result = ''
        params.forEach((p) => {
          if (p.seriesName === '可预约' || p.seriesName === '不可预约') {
            result += `${p.seriesName}: ${p.value}<br/>`
          }
        })
        return result
      },
    },
    legend: {
      textStyle: { color: '#fff' },
      data: ['可预约', '不可预约'],
    },
    grid: {
      top: '10%',
      bottom: '15%',
      containLabel: true,
    },
    xAxis: {
      type: 'category',
      data: xAxisData,
      axisLabel: { color: '#fff', fontSize: 14 },
      axisLine: { lineStyle: { color: '#fff' } },
    },
    yAxis: {
      type: 'value',
      axisLabel: { color: '#fff', fontSize: 14 },
      splitLine: { lineStyle: { color: 'rgba(255,255,255,0.2)' } },
    },
    series: [
      // 可预约柱状图
      {
        name: '可预约',
        type: 'bar',
        barWidth: '50%',
        itemStyle: {
          color: {
            type: 'linear',
            x: 0,
            y: 0,
            x2: 1,
            y2: 0,
            colorStops: [
              { offset: 0, color: 'rgba(57, 206, 255, 1)' },
              { offset: 0.49, color: 'rgba(57, 206, 255, 1)' },
              { offset: 0.5, color: 'rgba(57, 206, 255, 0.9)' }, //降低透明度模拟棱线
              { offset: 0, color: 'rgba(57, 206, 255, 1)' },
            ],
          },
        },
        data: yesData,
        // z: 1
      },
      // 可预约顶部菱形
      {
        type: 'pictorialBar',
        name: '可预约', // 与柱状图同名,图例合并
        symbol: 'diamond',
        symbolSize: [15, diamondHeight],
        symbolOffset: [-8, offsetY],
        symbolPosition: 'end',
        z: 12,
        showInLegend: false,
        tooltip: { show: false },
        itemStyle: { color: 'rgba(57, 206, 255, 1)' },
        data: yesData.map((v) => (v > 0 ? v : null)),
      },
      // 不可预约柱状图(绿色渐变)
      {
        name: '不可预约',
        type: 'bar',
        barWidth: '50%',
        itemStyle: {
          color: {
            type: 'linear',
            x: 0,
            y: 0,
            x2: 1,
            y2: 0,
            colorStops: [
              { offset: 0, color: 'rgba(78, 238, 173, 1)' },
              { offset: 0.49, color: 'rgba(78, 238, 173, 1)' },
              { offset: 0.5, color: 'rgba(78, 238, 173, 0.9)' }, //降低透明度模拟棱线
              { offset: 1, color: 'rgba(78, 238, 173, 1)' },
            ],
          },
        },
        data: noData,
        z: 1,
      },
      // 不可预约顶部菱形
      {
        type: 'pictorialBar',
        name: '不可预约',
        symbol: 'diamond',
        symbolSize: [18, diamondHeight],
        symbolOffset: [0, offsetY],
        symbolPosition: 'end',
        z: 12,
        showInLegend: false,
        tooltip: { show: false },
        itemStyle: { color: '#2D700E' },
        data: noData.map((v) => (v > 0 ? v : null)), // 值为0时设为null,不显示菱形
      },
    ],
  }
  chartInstance2.setOption(option, true)
}有点丑但是需求说可以那就可以,这个我是参考https://blog.csdn.net/sd1sd2/article/details/147634042这个人的,他讲的好,还有另一种方式https://www.isqqw.com/?t=bar&s=3d这里面一堆炫彩3d图,好看但我有点没看懂,但很规范的好看,可参考