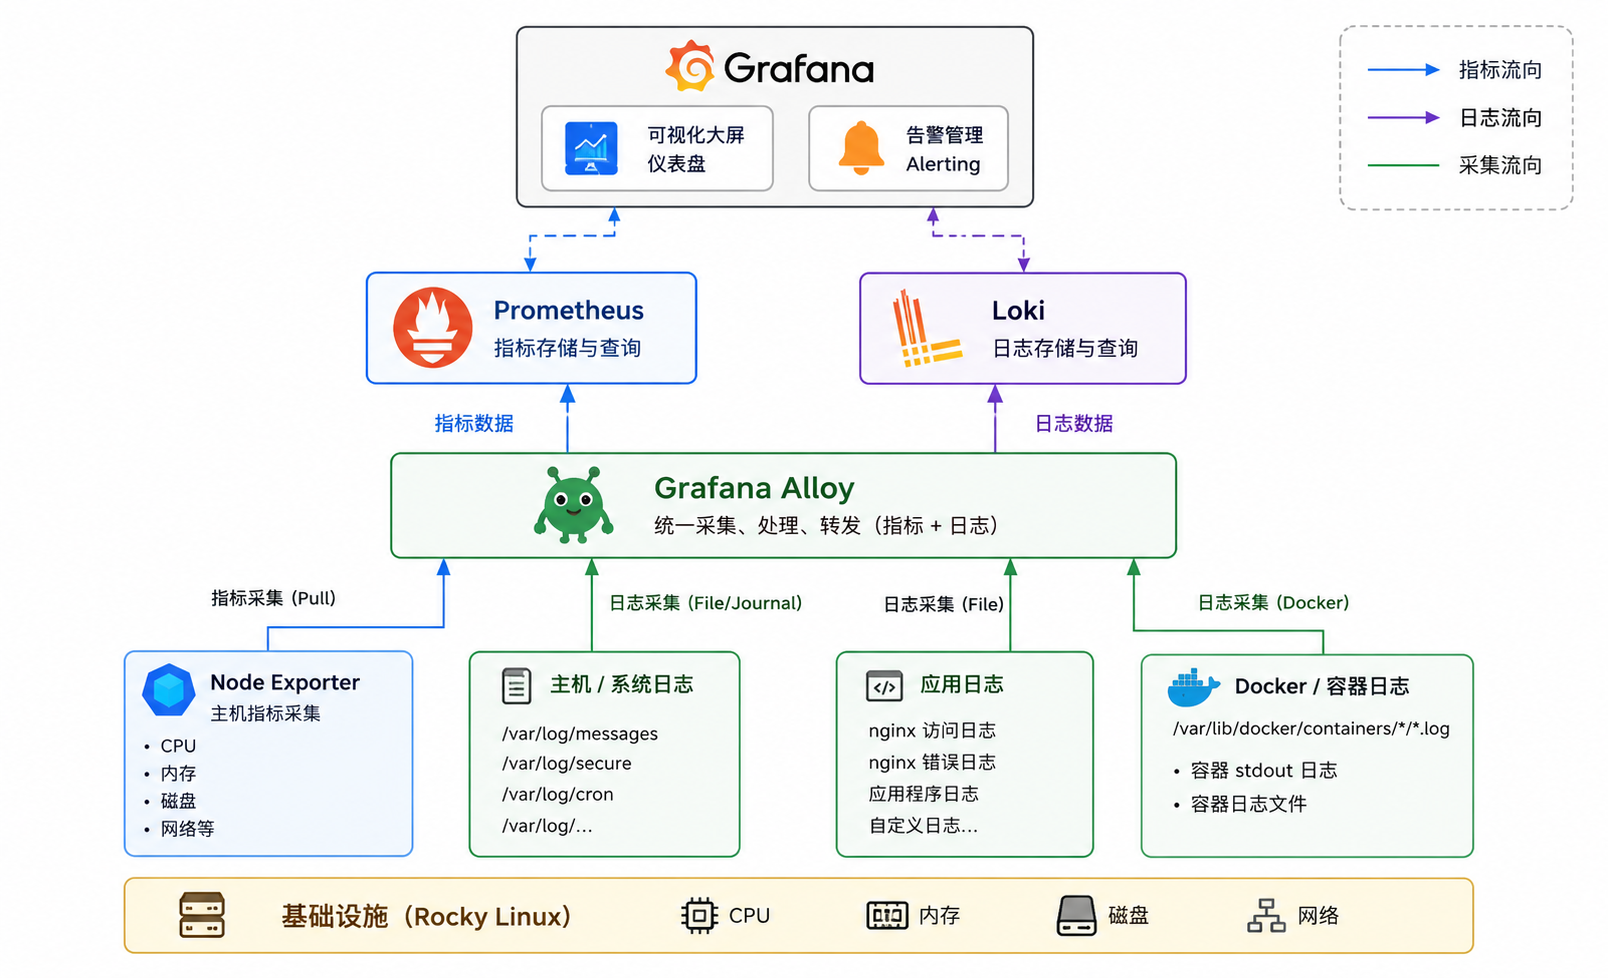
一、架构介绍
1.软件版本
| 系统/软件名 | 版本号 |
|---|---|
| grafana | 13.0.1 |
| loki | 3.7.2 |
| alloy | 1.16.1 |
| prometheus | 3.12.0 |
| node_exporter | 1.11.1 |
| rocky | 9.7 (Blue Onyx) |
| 地址 | 角色 | 系统类型 |
|---|---|---|
| 192.168.140.8 | grafana+loki+premetheus+alloy | rocky9.7 |
| 192.168.140.9 | node_exporter | rocky9.7 |
二、日志接入与监控
1.安装grafana
bash
  sudo rpm --import https://rpm.grafana.com/gpg.key
  sudo tee /etc/yum.repos.d/grafana.repo > /dev/null <<EOF
   [grafana]
  name=Grafana OSS
  baseurl=https://rpm.grafana.com
  repo_gpgcheck=1
  enabled=1
  gpgcheck=1
  gpgkey=https://rpm.grafana.com/gpg.key
  sslverify=1
  sslcacert=/etc/pki/tls/certs/ca-bundle.crt
  EOF
bash
  sudo dnf clean all
  sudo dnf makecache
  sudo dnf install -y grafana
  sudo systemctl enable --now grafana-server
  sudo systemctl status grafana-server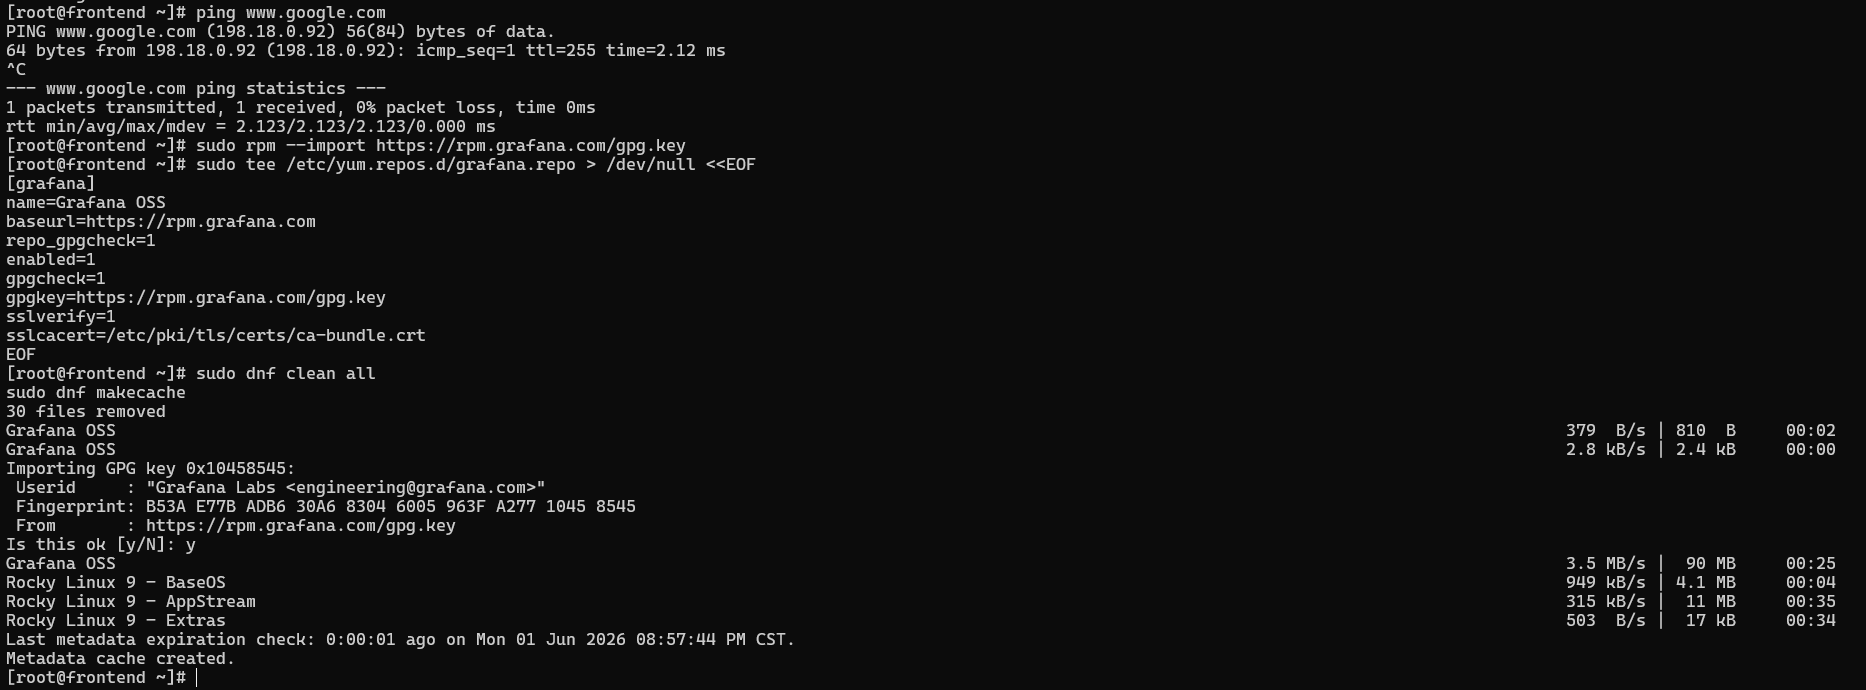
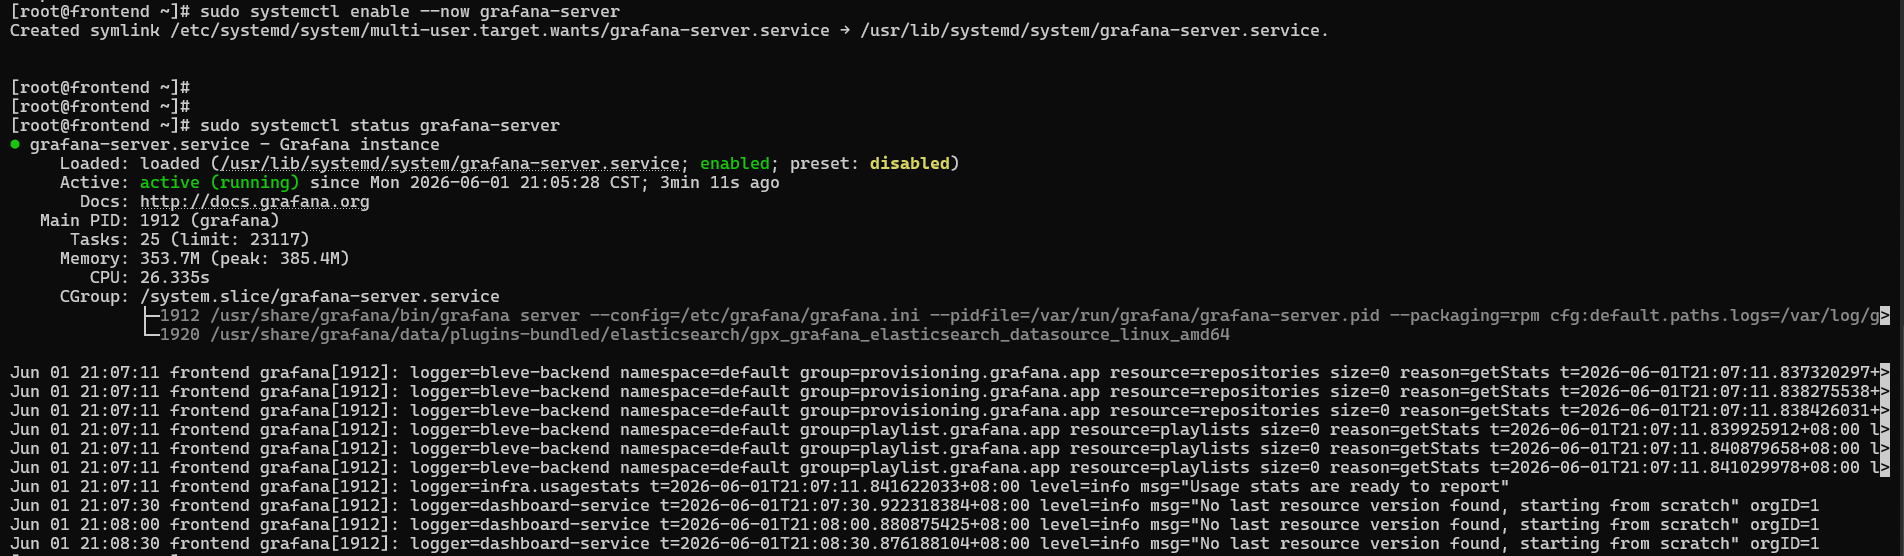
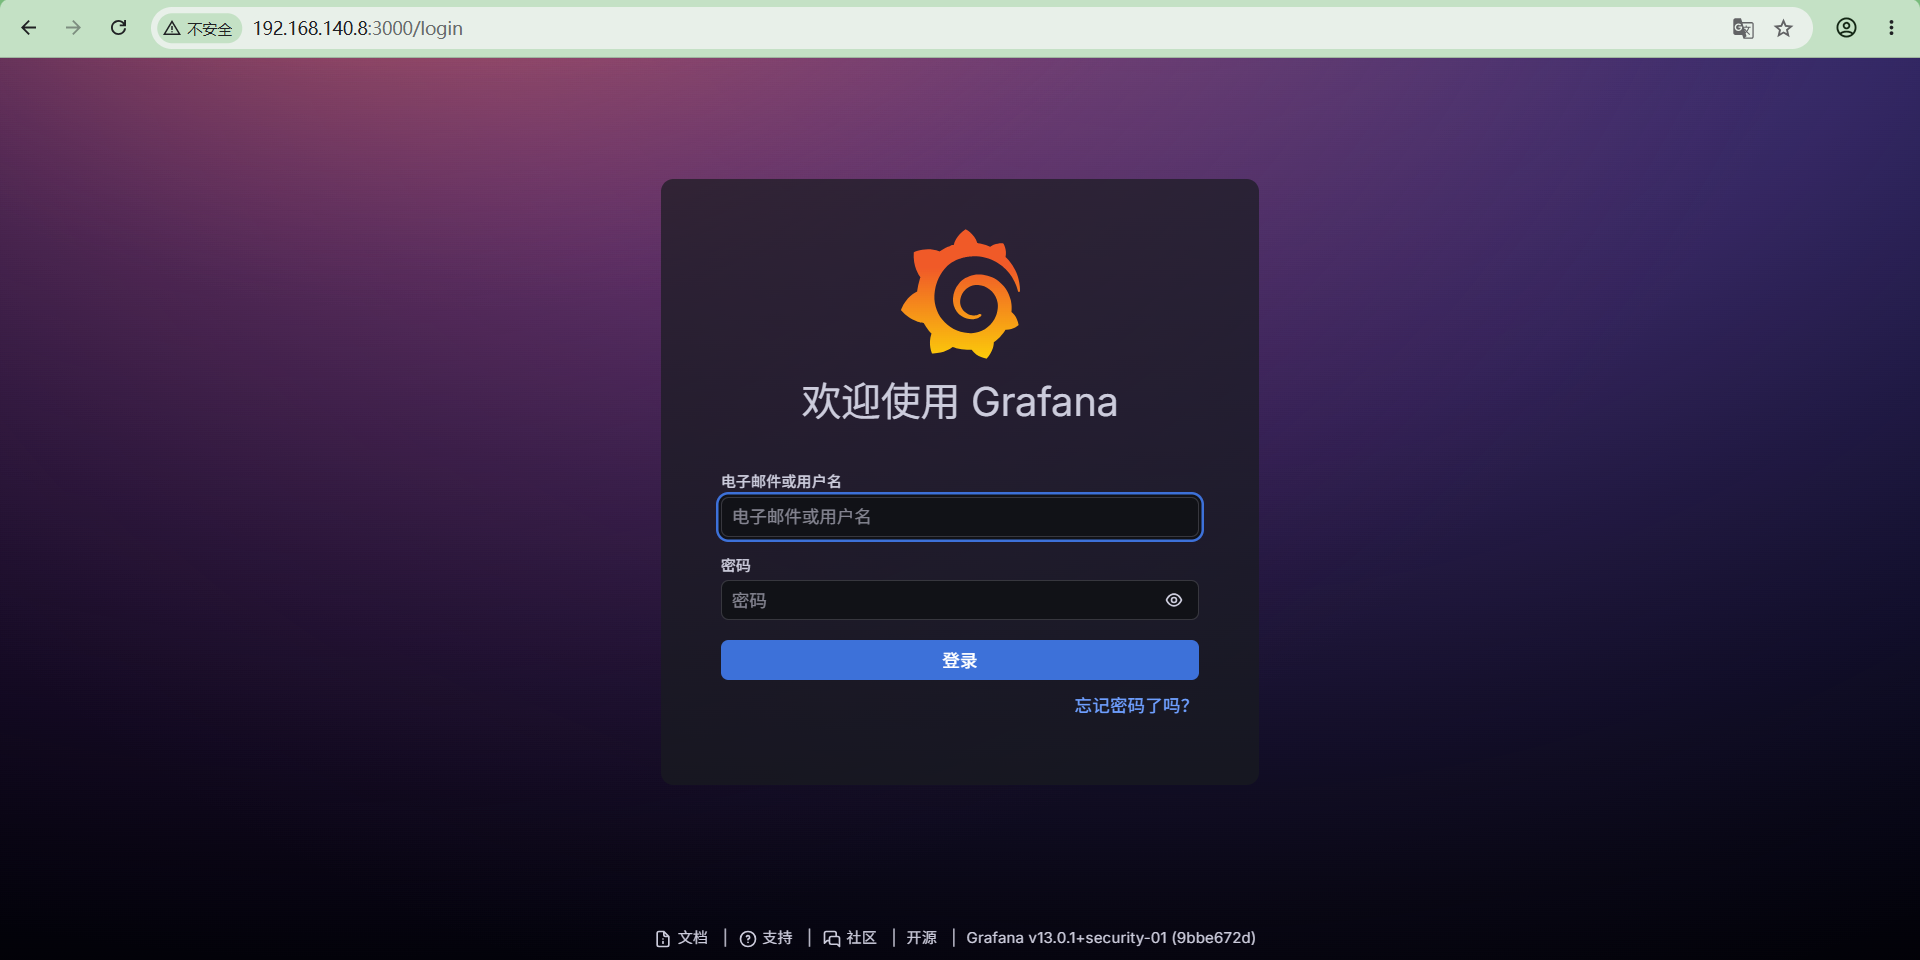
http://192.168.140.8:3000,默认账号和密码:admin/admin。第一次登录需要改密码。
2.安装并接入loki
bash
sudo dnf install -y loki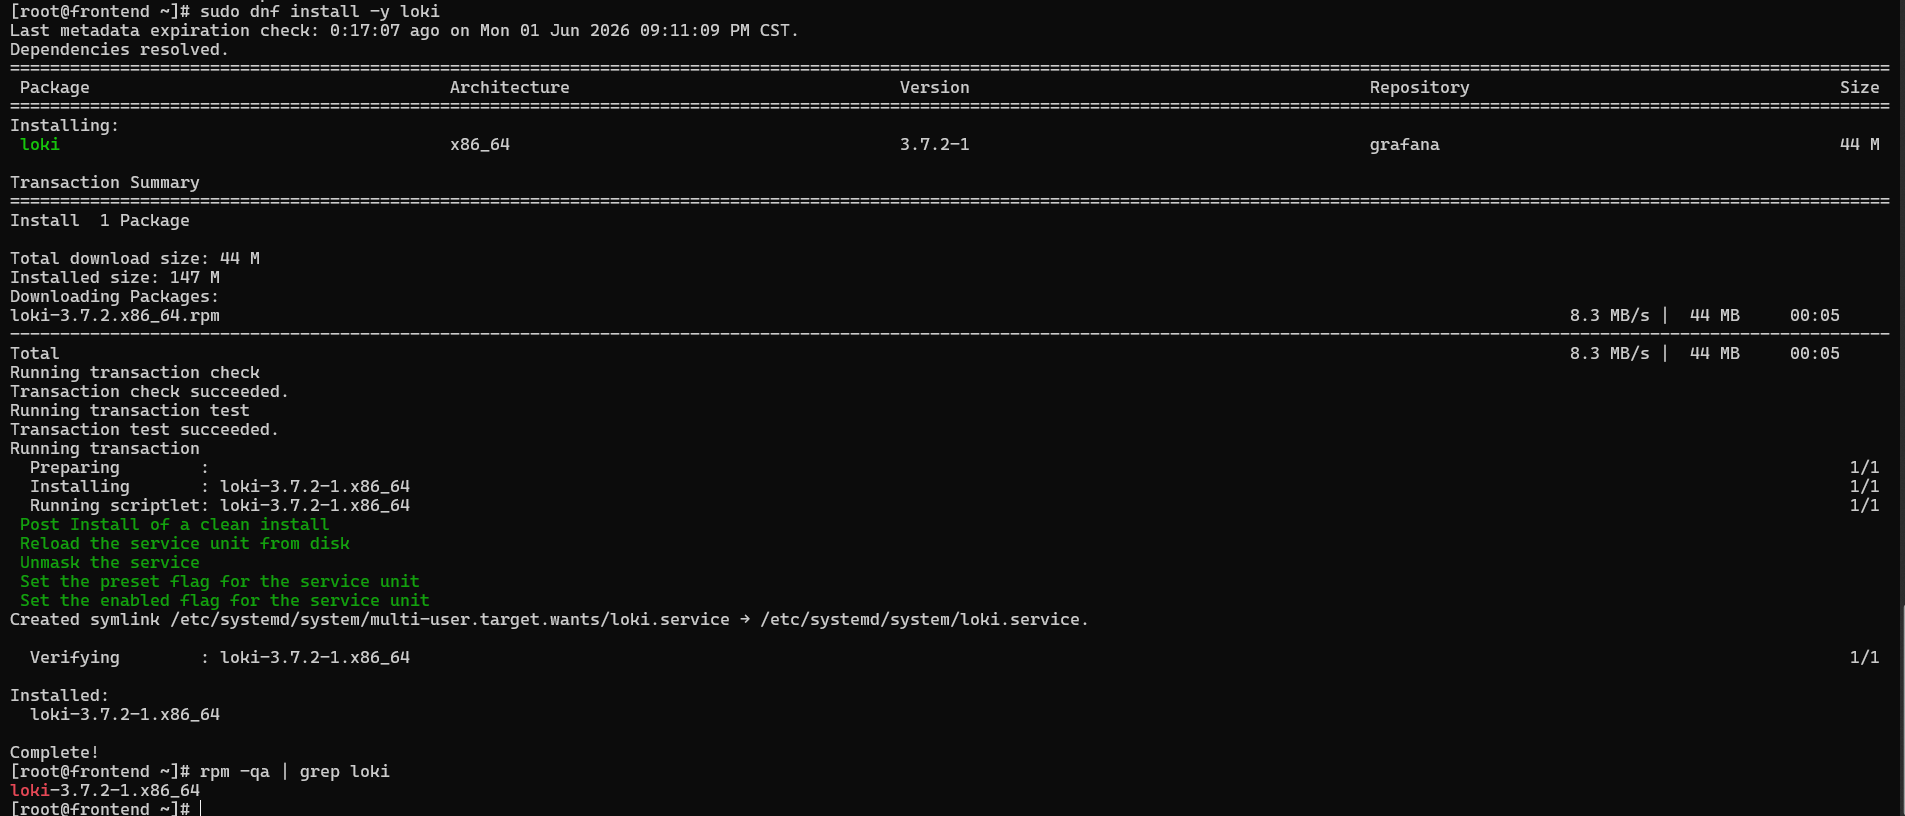
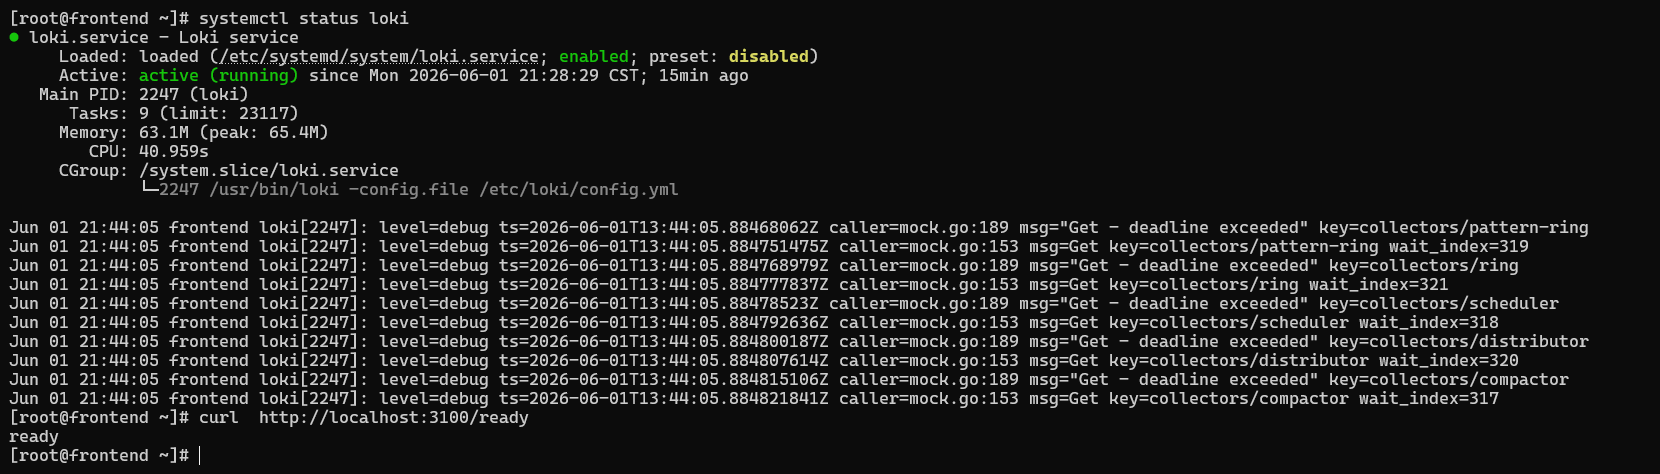
修改loki的配置文件
bash
[root@frontend ~]# cat /etc/loki/config.yml
auth_enabled: false
server:
http_listen_port: 3100
grpc_listen_port: 9096
log_level: debug
grpc_server_max_concurrent_streams: 1000
common:
instance_addr: 127.0.0.1
path_prefix: /tmp/loki
storage:
filesystem:
chunks_directory: /tmp/loki/chunks
rules_directory: /tmp/loki/rules
replication_factor: 1
ring:
kvstore:
store: inmemory
query_range:
results_cache:
cache:
embedded_cache:
enabled: true
max_size_mb: 100
limits_config:
metric_aggregation_enabled: true
enable_multi_variant_queries: true
schema_config:
configs:
- from: 2020-10-24
store: tsdb
object_store: filesystem
schema: v13
index:
prefix: index_
period: 24h
pattern_ingester:
enabled: true
metric_aggregation:
loki_address: localhost:3100
ruler:
alertmanager_url: http://localhost:9093
frontend:
encoding: protobuf
# By default, Loki will send anonymous, but uniquely-identifiable usage and configuration
# analytics to Grafana Labs. These statistics are sent to https://stats.grafana.org/
#
# Statistics help us better understand how Loki is used, and they show us performance
# levels for most users. This helps us prioritize features and documentation.
# For more information on what's sent, look at
# https://github.com/grafana/loki/blob/main/pkg/analytics/stats.go
# Refer to the buildReport method to see what goes into a report.
#
# If you would like to disable reporting, uncomment the following lines:
#analytics:
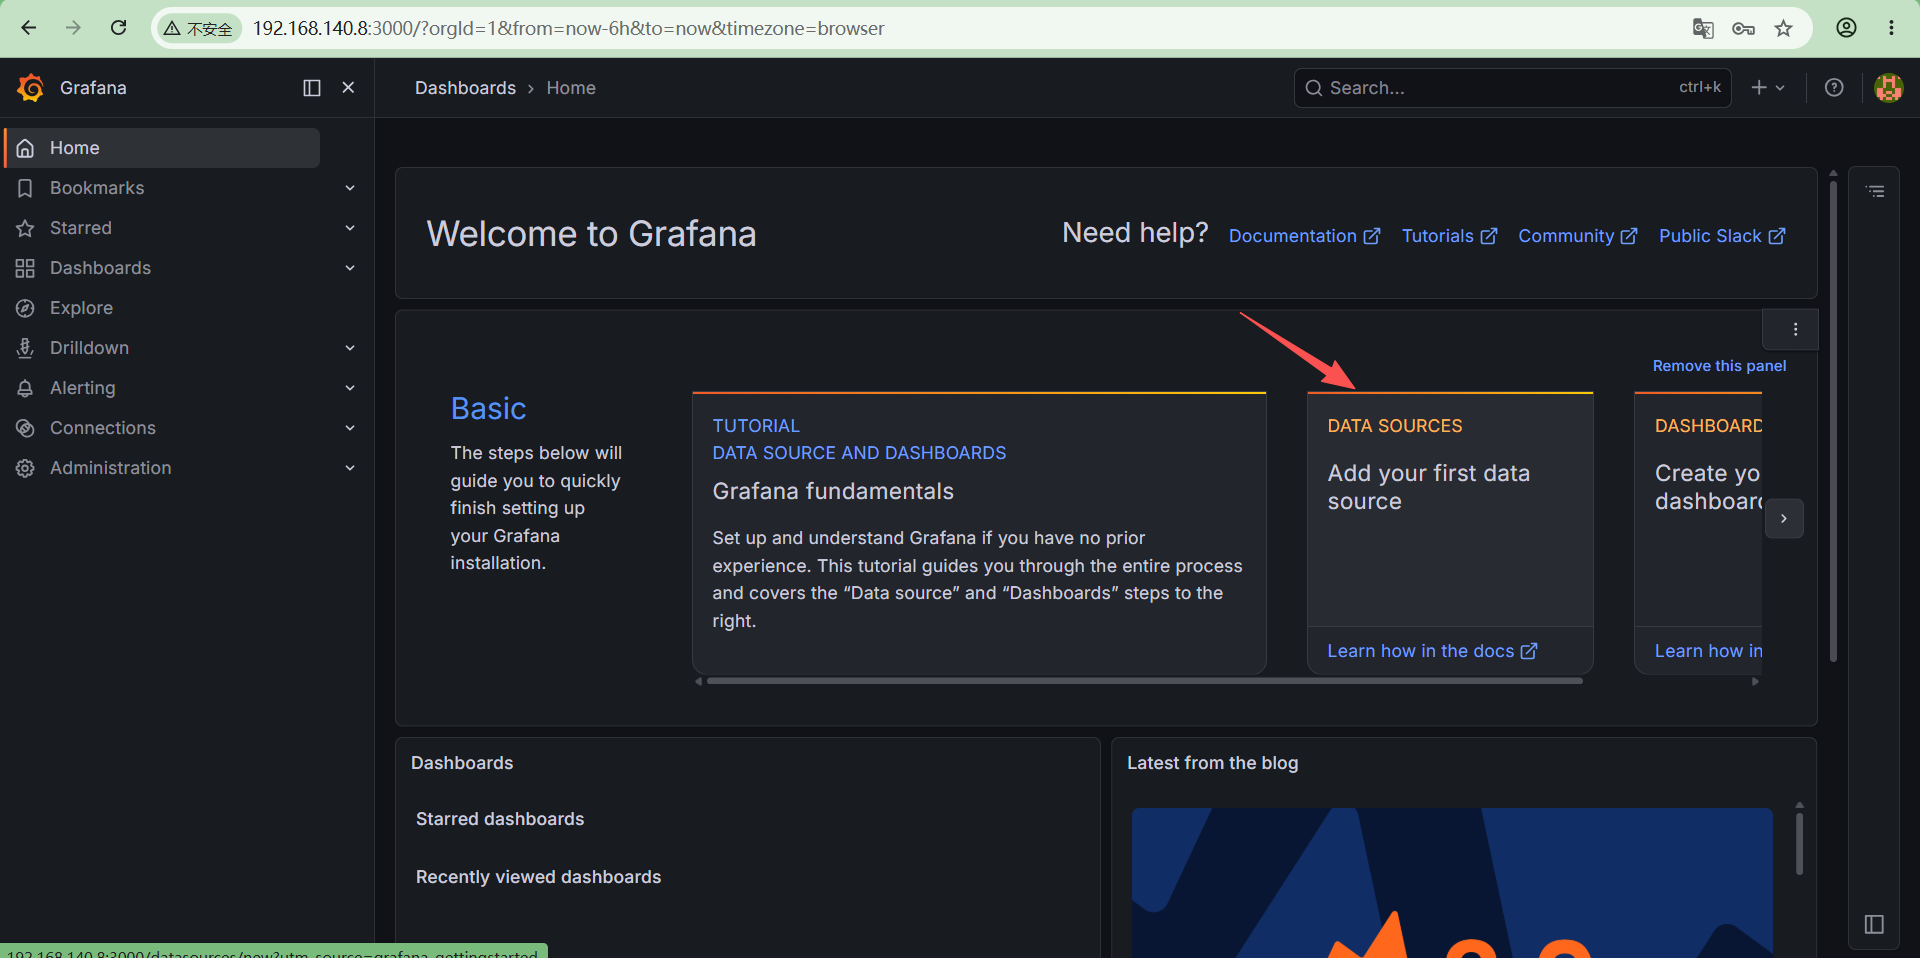
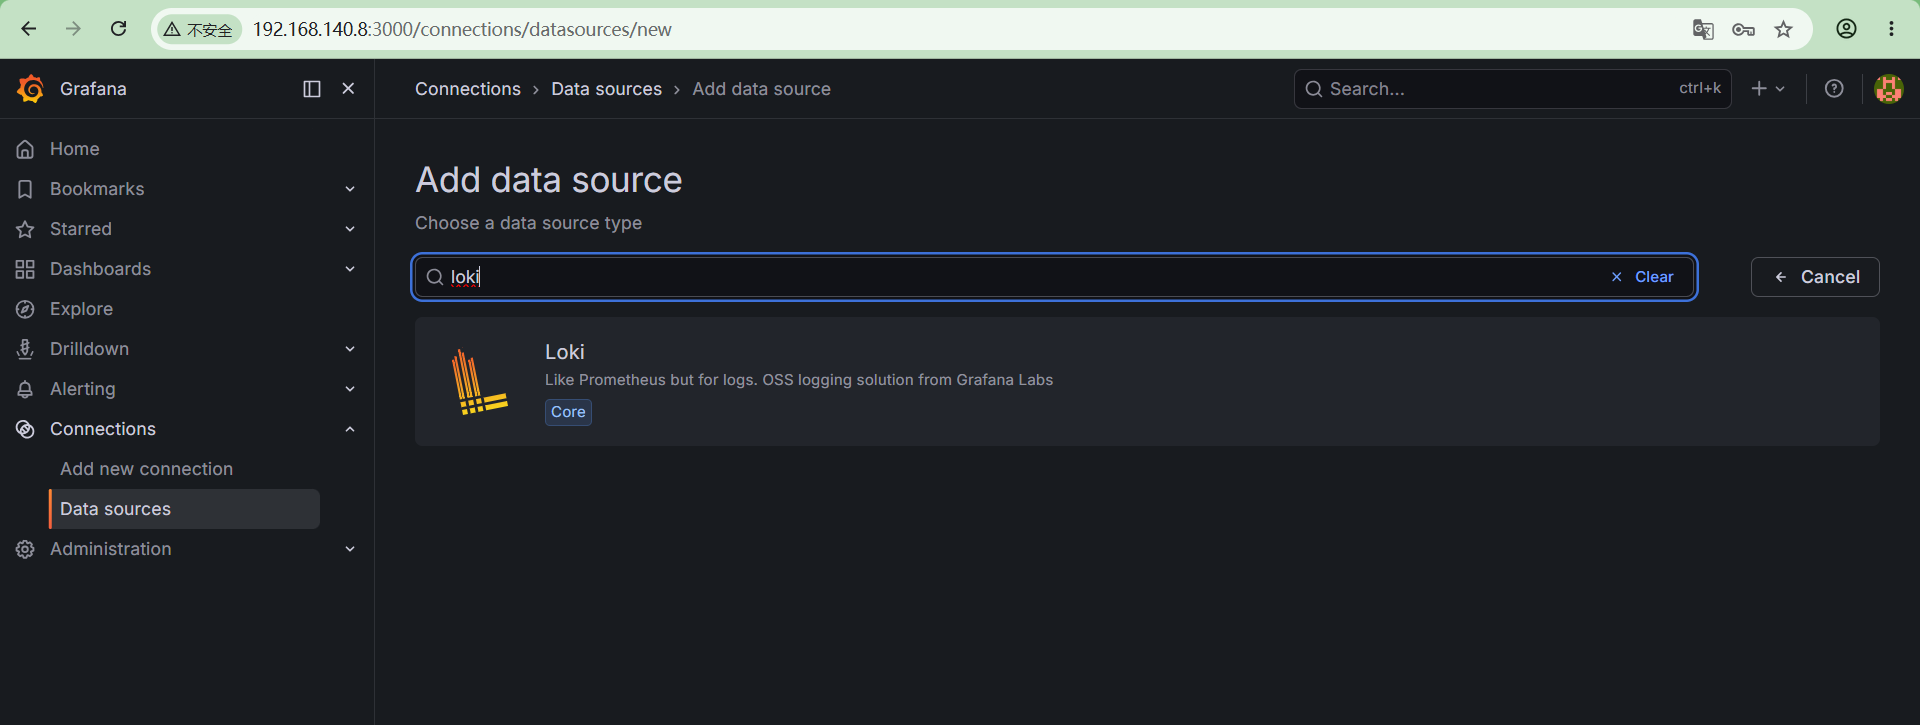
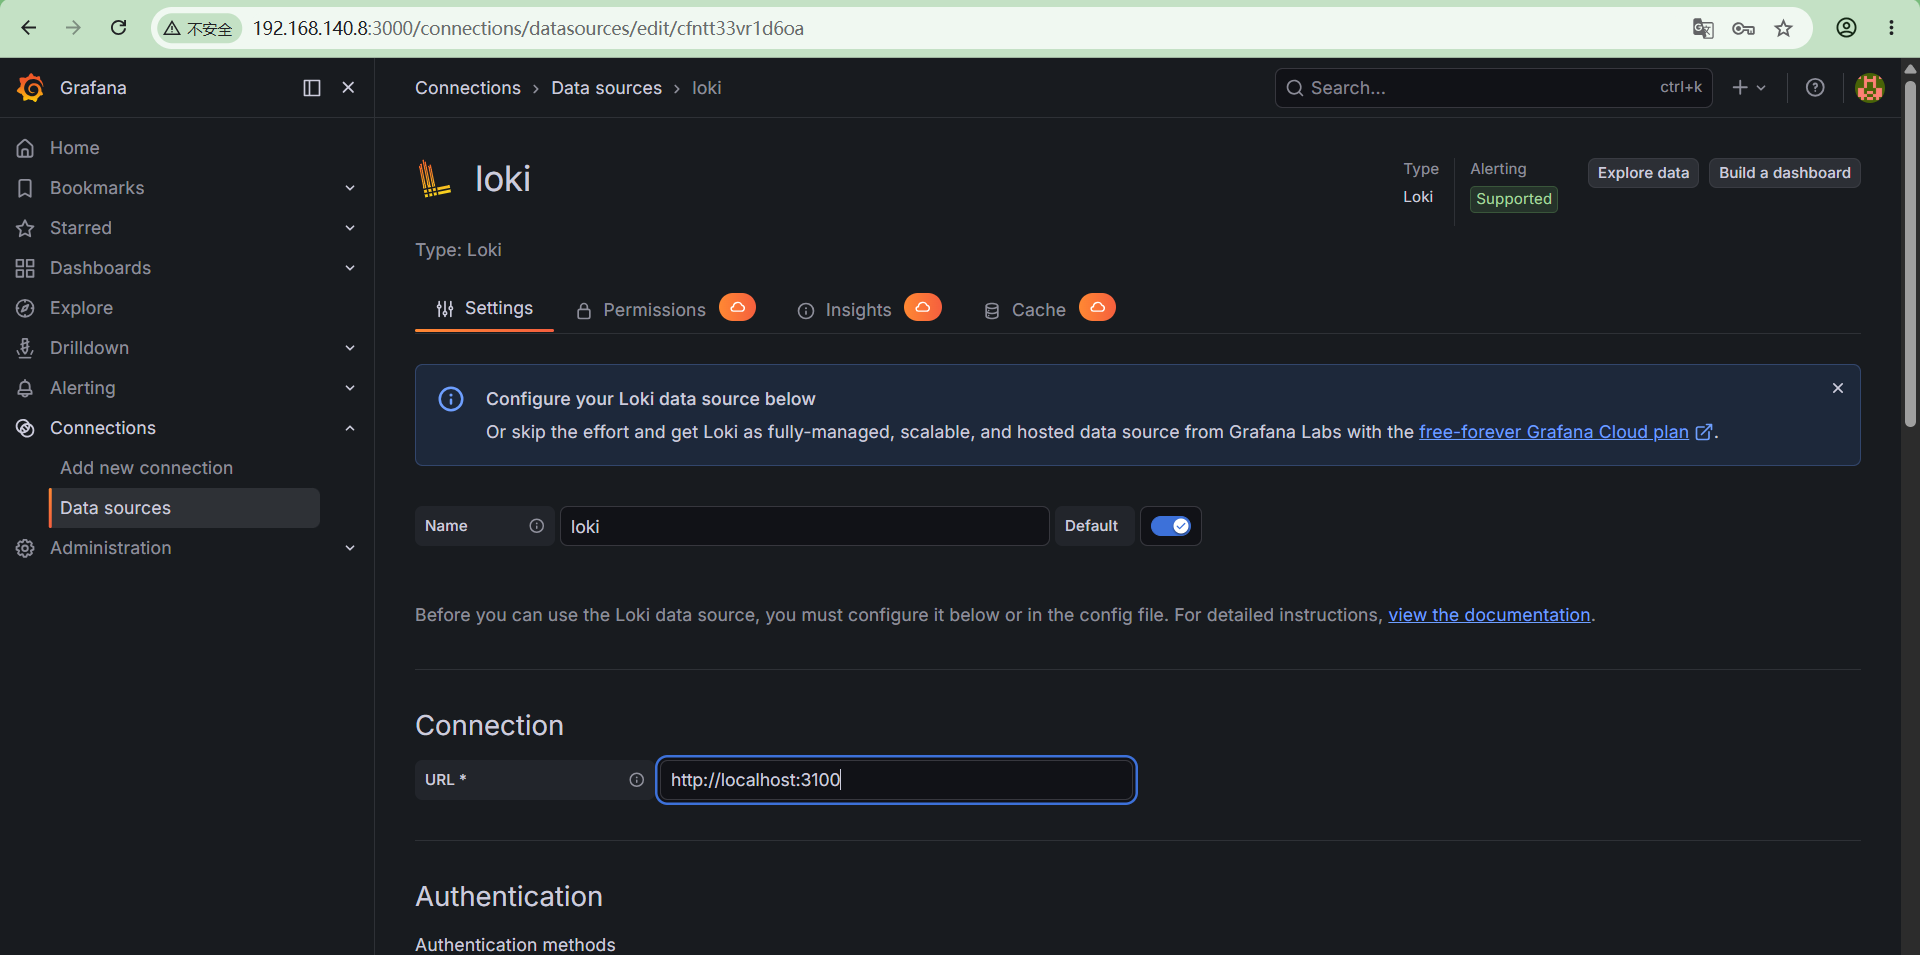
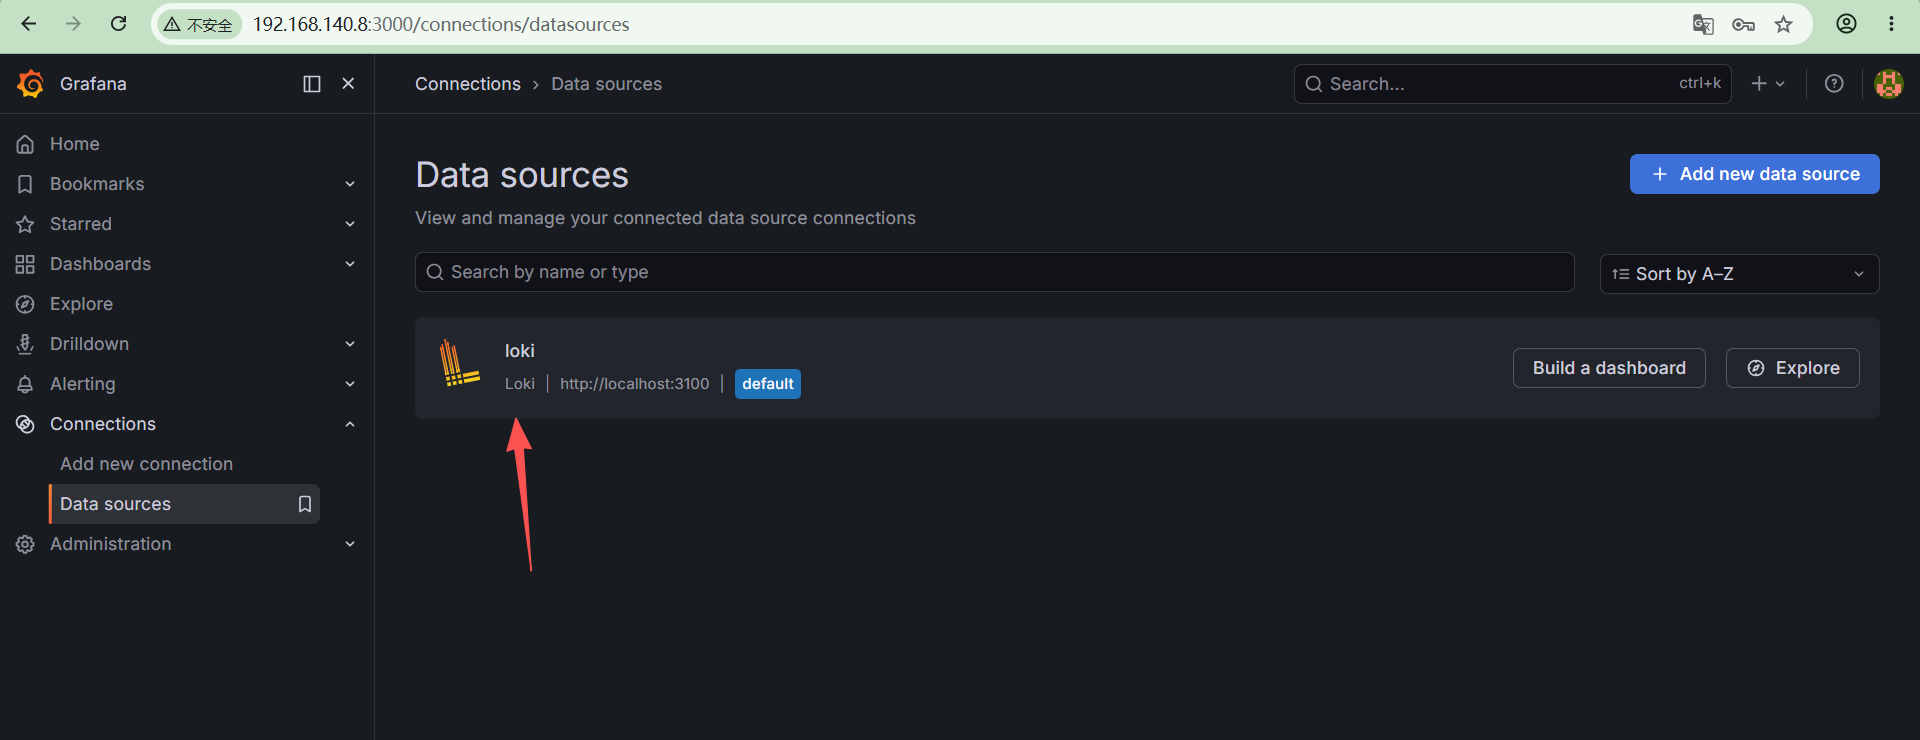
# reporting_enabled: false在grafana配置data sources,配置为loki。
3.安装alloy
bash
  sudo dnf install -y alloy
  sudo systemctl enable --now alloy
  sudo systemctl status alloy
修改alloy配置文件
vim /etc/alloy/config.alloy
bash
  logging {
  level = "info"
}

loki.source.journal "iptables" {
  matches = "_TRANSPORT=kernel"   // 只采集内核日志
  forward_to = [ loki.process.iptables.receiver, ]
  labels = { job = "iptables" }
}

loki.process "iptables" {
  stage.match {
    selector = "{job=\"iptables\"}"
    stage.regex {
      expression = ".*(IPTABLES_DROP).*"
    }
  }

  stage.labels {
    values = { logtype = "iptables", host = constants.hostname }
  }

  forward_to = [ loki.write.default.receiver, ]
}

loki.write "default" {
  endpoint {
    url = "http://192.168.140.8:3100/loki/api/v1/push"
  }
}
4.测试iptables日志接入
(1)配置iptables,记录访问日志
bash
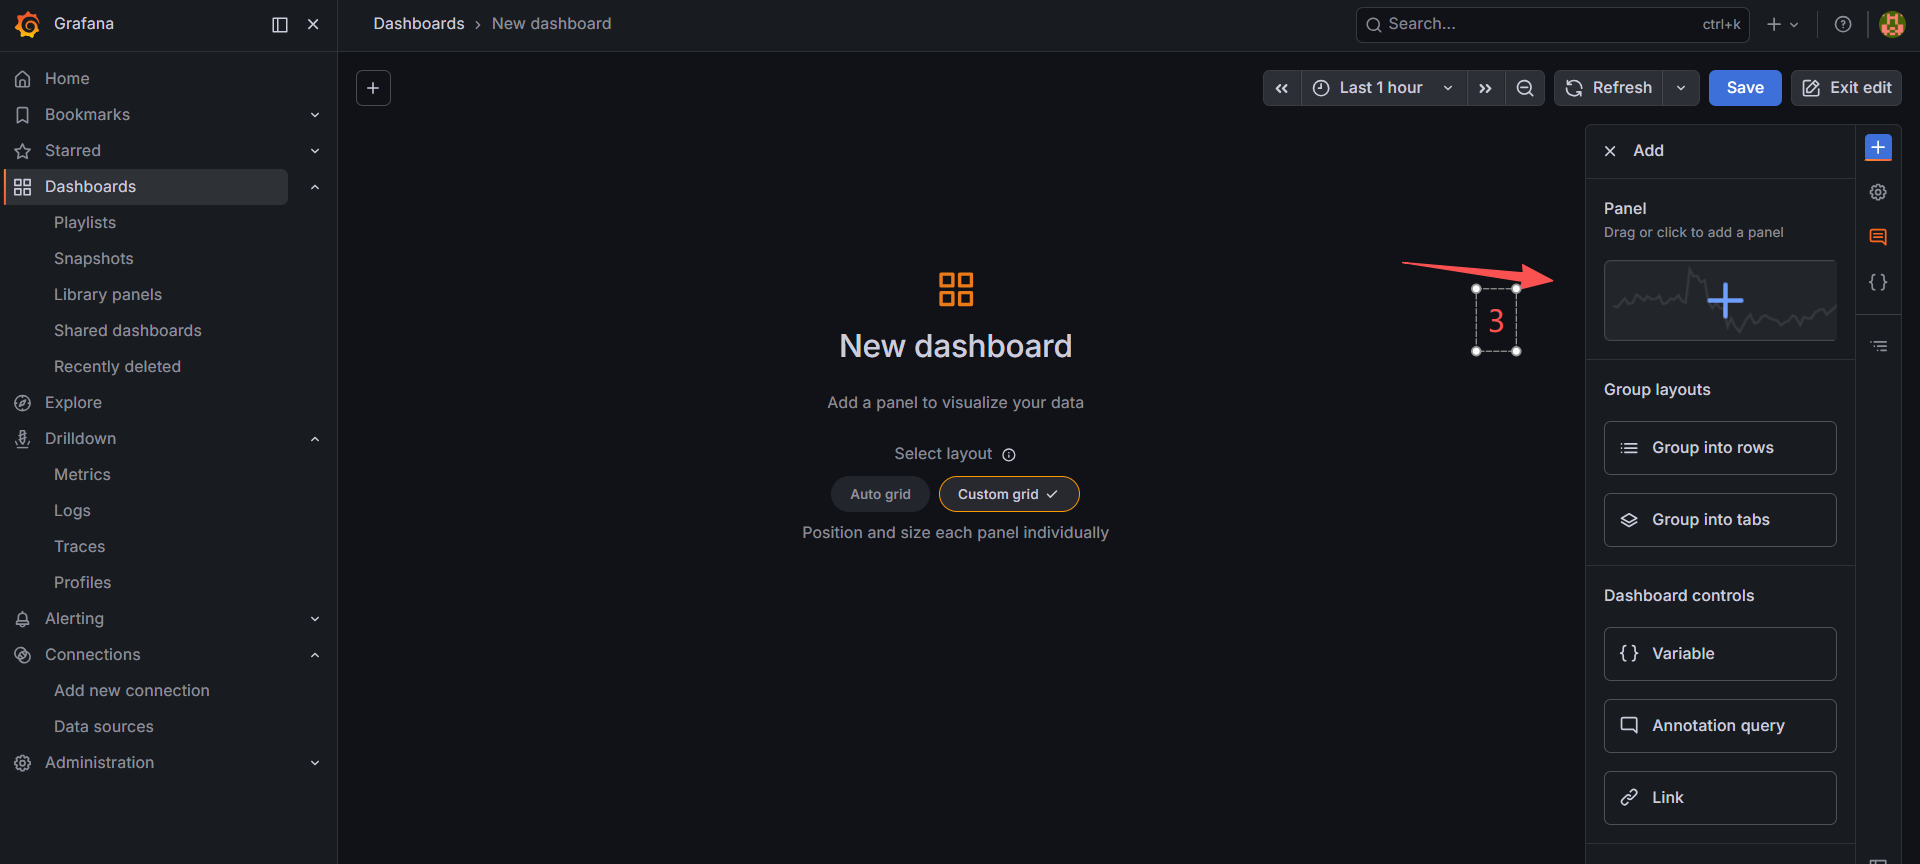
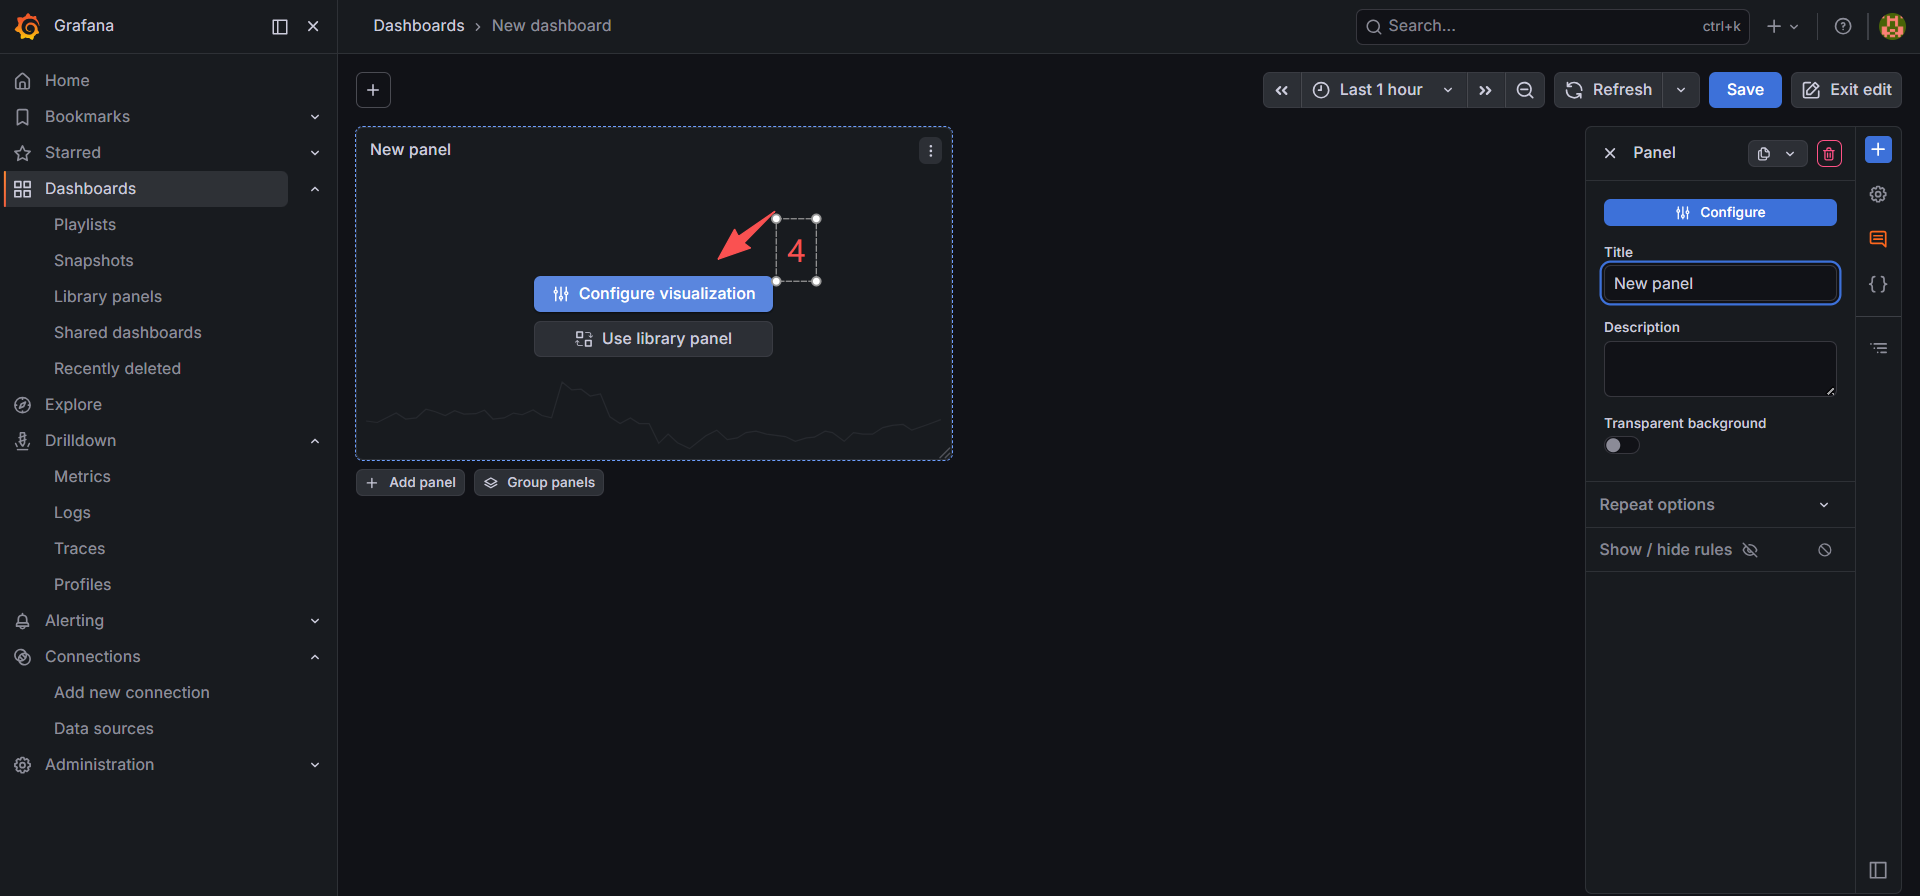
iptables -I INPUT 1 -p tcp --dport 22 -j LOG --log-prefix "IPTABLES_DROP: " --log-level 4(2)grafana配置dashboard
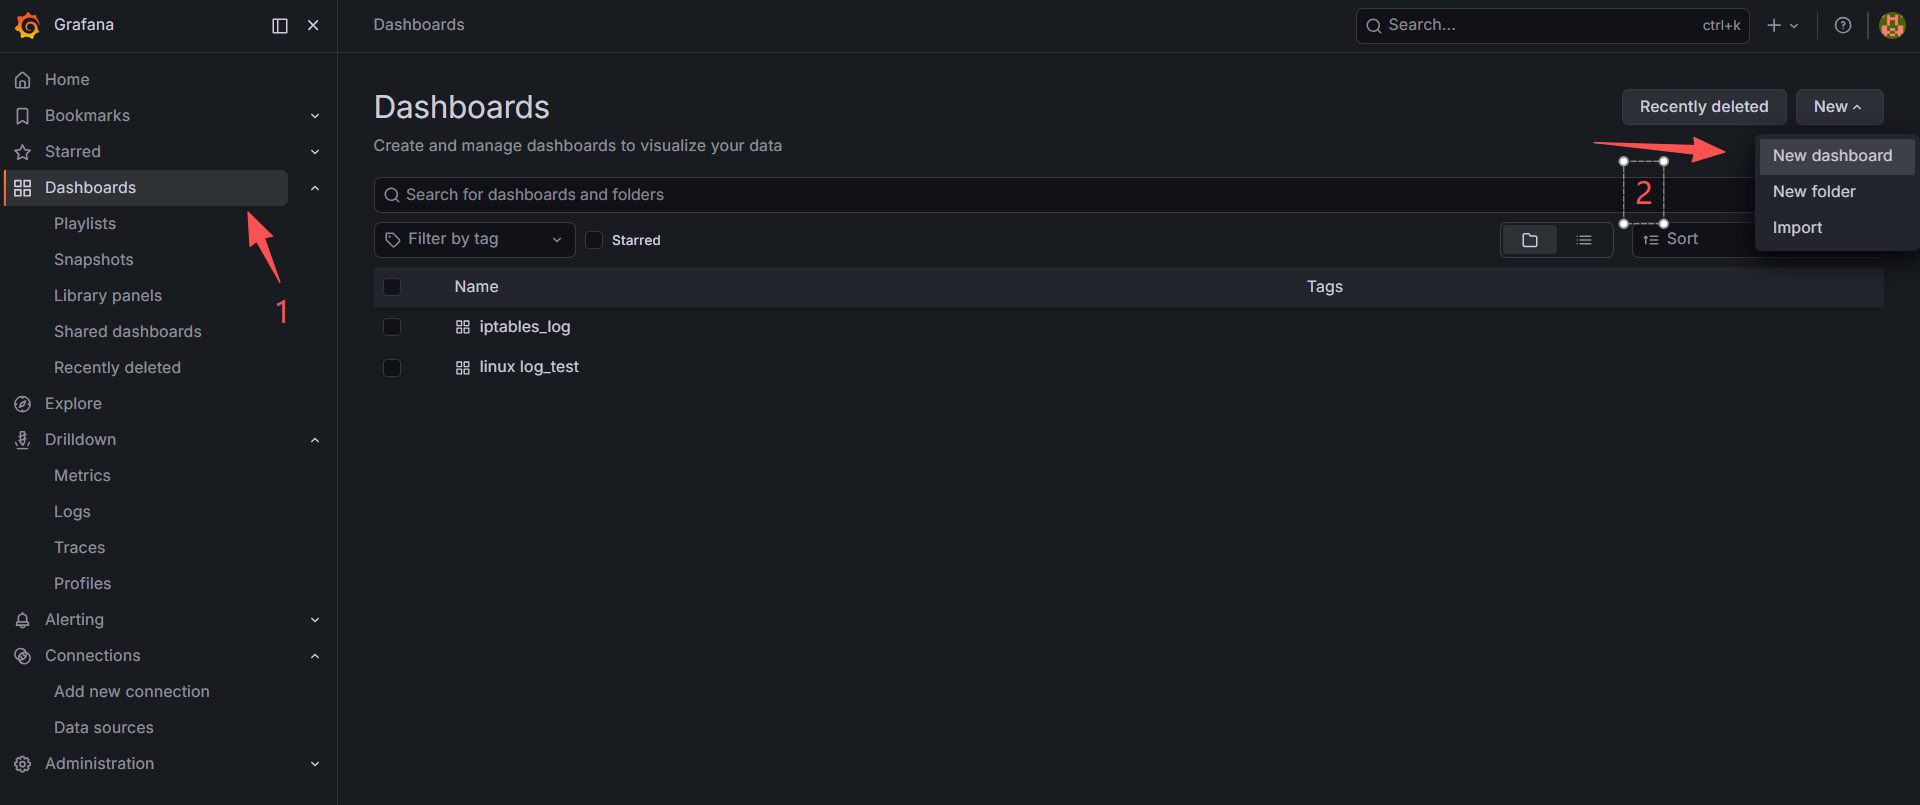
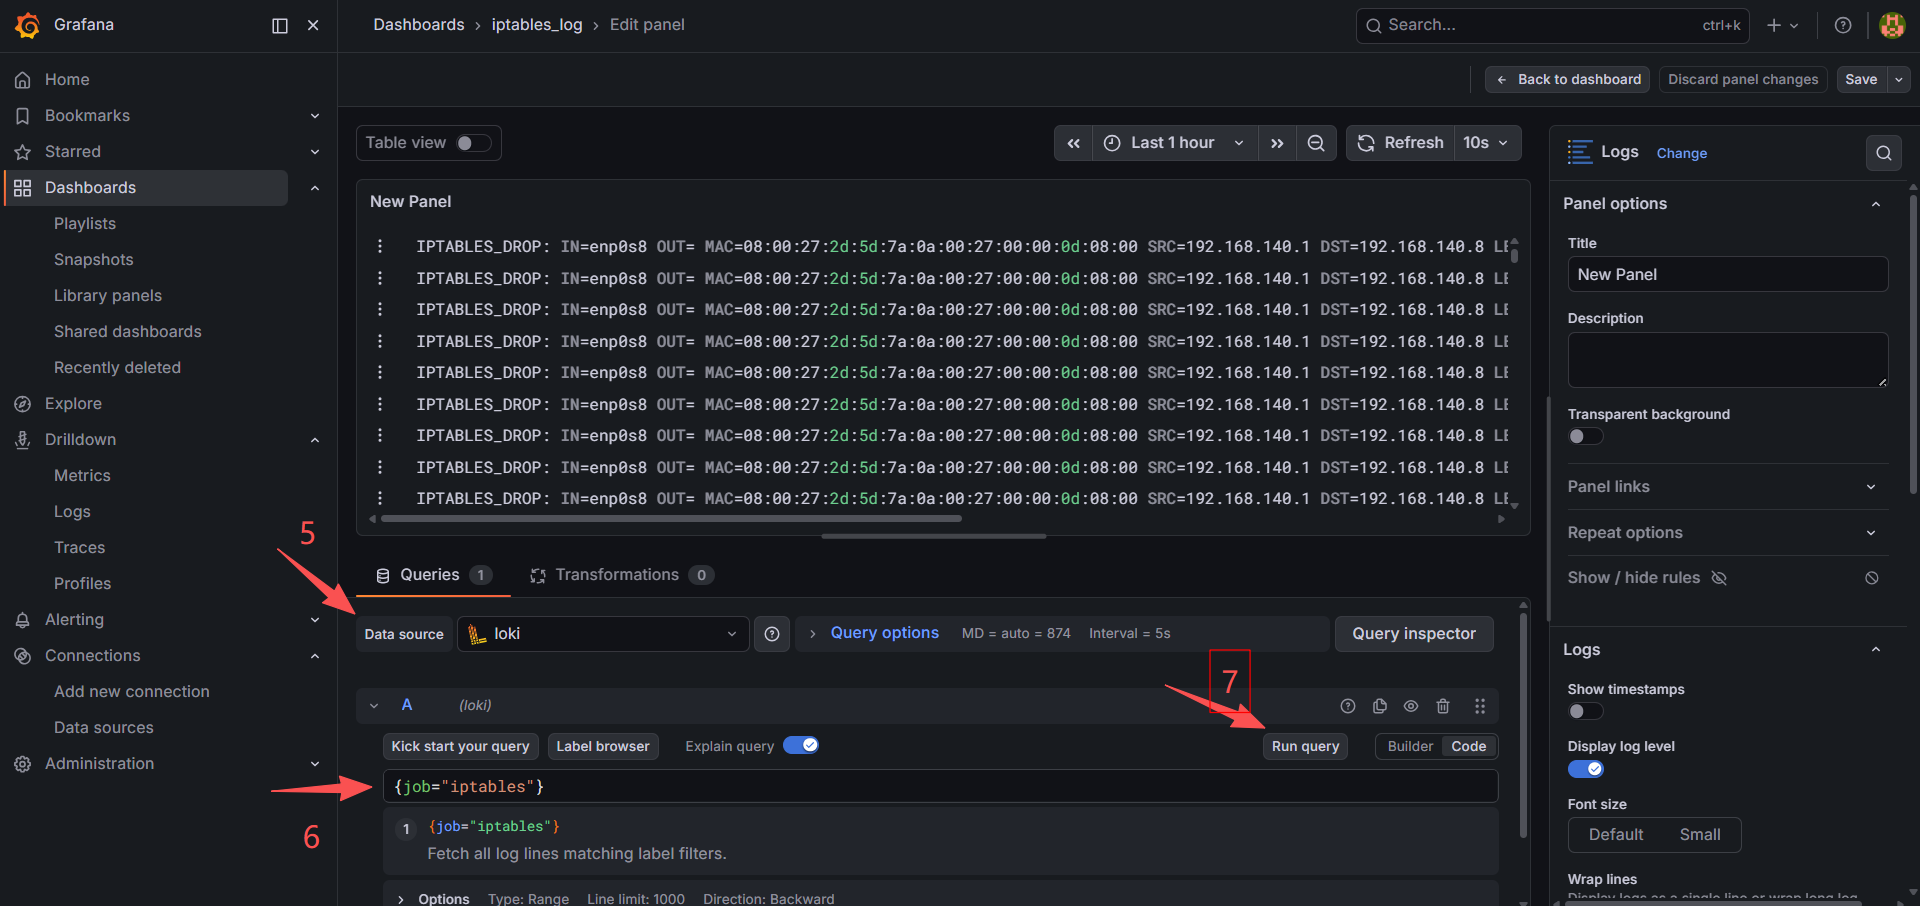
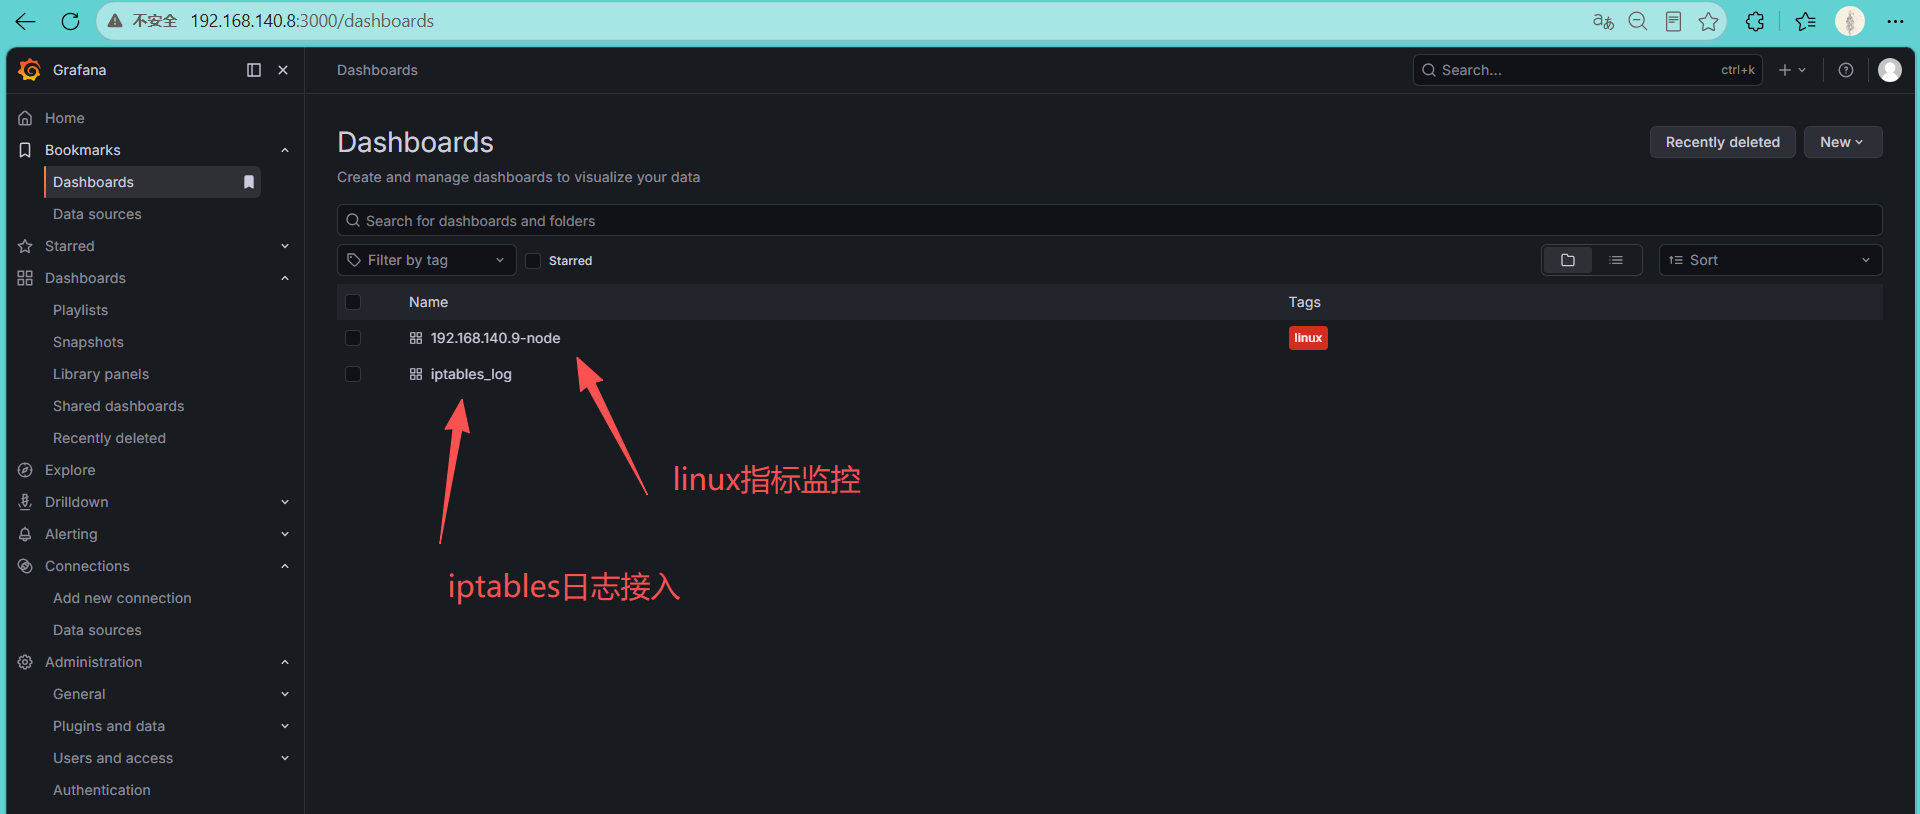
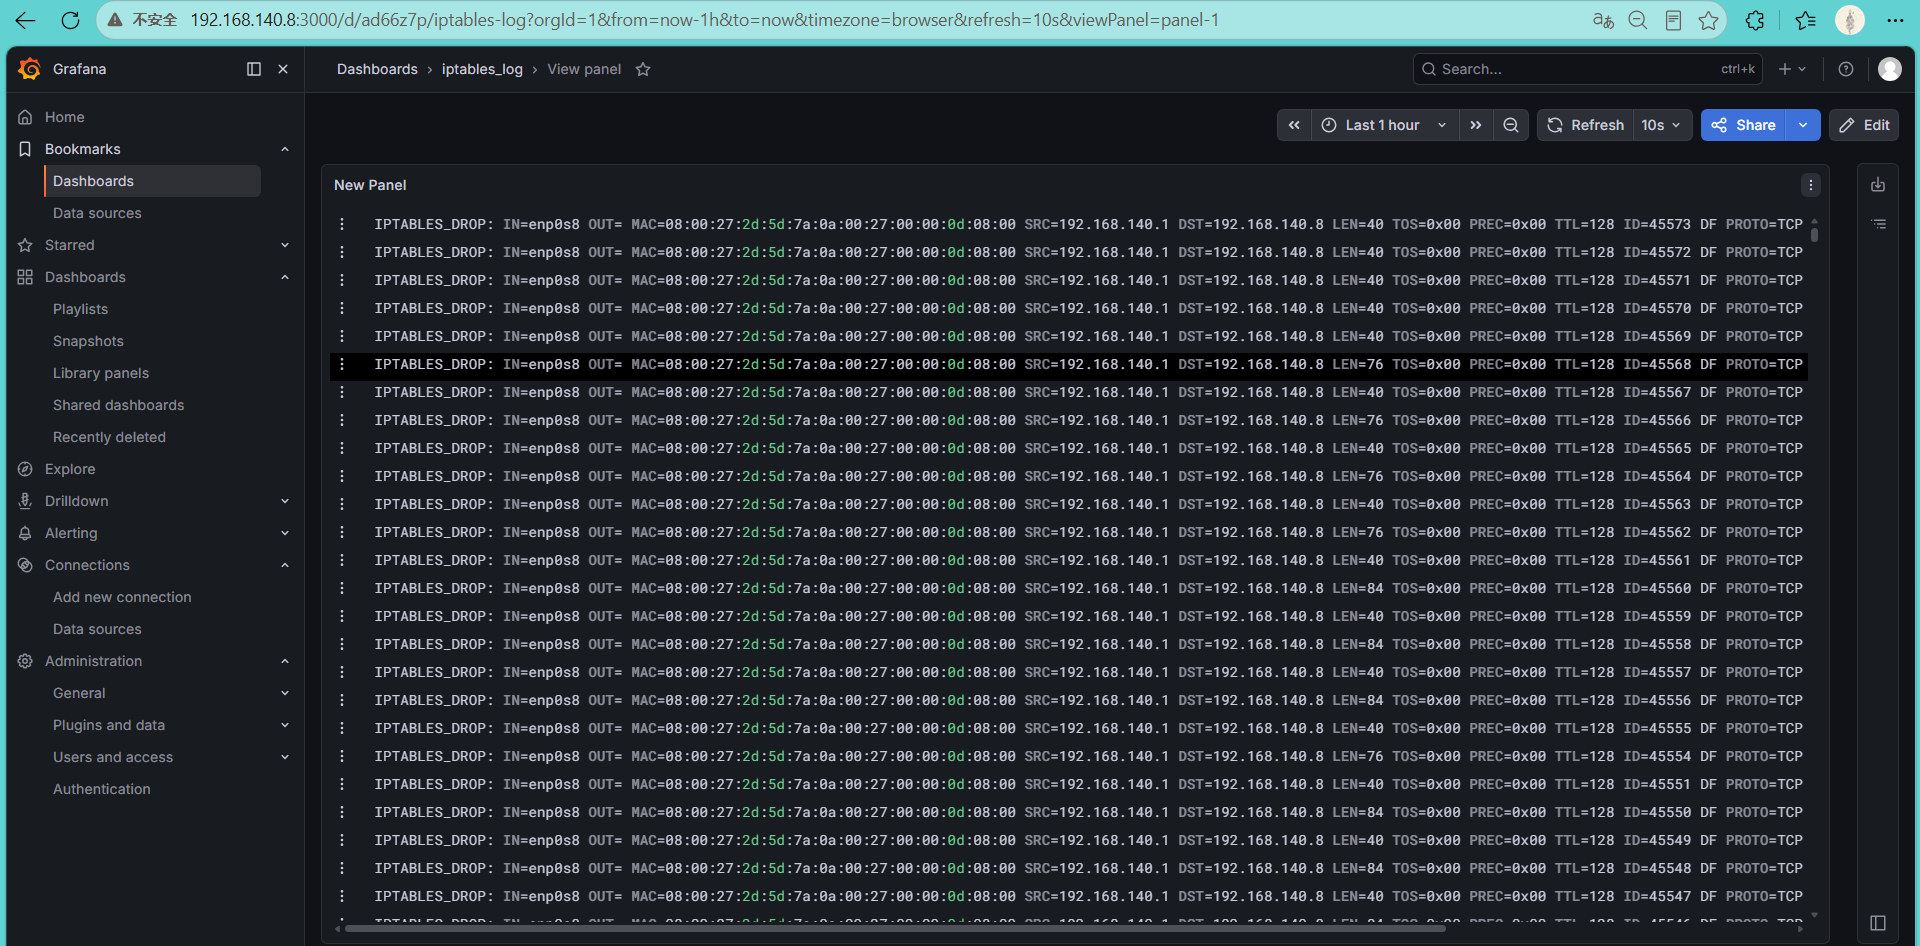
(3)iptables的日志已经成功接入并展示。
三、搭建指标监控
1.搭建Prometheus
https://prometheus.io/download/,从官网下载。离线安装prometheus-3.12.0.linux-amd64.tar.gz版本。
安装步骤
(1)解压安装包
bash
tar -xzf prometheus-3.12.0.linux-amd64.tar.gz
cd prometheus-3.12.0.linux-amd64
(2)创建prometheus用户
bash
sudo useradd --no-create-home --shell /sbin/nologin prometheus(3)创建相关目录
bash
sudo mkdir -p /etc/prometheus
sudo mkdir -p /var/lib/prometheus
(4)复制程序
bash
sudo cp prometheus promtool /usr/local/bin/
sudo chown prometheus:prometheus /usr/local/bin/prometheus
sudo chown prometheus:prometheus /usr/local/bin/promtool
(5)复制配置文件
bash
sudo cp prometheus.yml /etc/prometheus/(6)设置权限
bash
sudo chown -R prometheus:prometheus /etc/prometheus(7)创建服务
bash
sudo vi /etc/systemd/system/prometheus.service
[Unit]
Description=Prometheus
After=network.target

[Service]
User=prometheus
Group=prometheus

Type=simple

ExecStart=/usr/local/bin/prometheus \
  --config.file=/etc/prometheus/prometheus.yml \
  --storage.tsdb.path=/var/lib/prometheus \
  --web.console.templates=/etc/prometheus/consoles \
  --web.console.libraries=/etc/prometheus/console_libraries

Restart=on-failure

[Install]
WantedBy=multi-user.target
bash
sudo systemctl daemon-reload  #加载配置
sudo systemctl enable prometheus	#设置开机自启
sudo systemctl start prometheus	#启动服务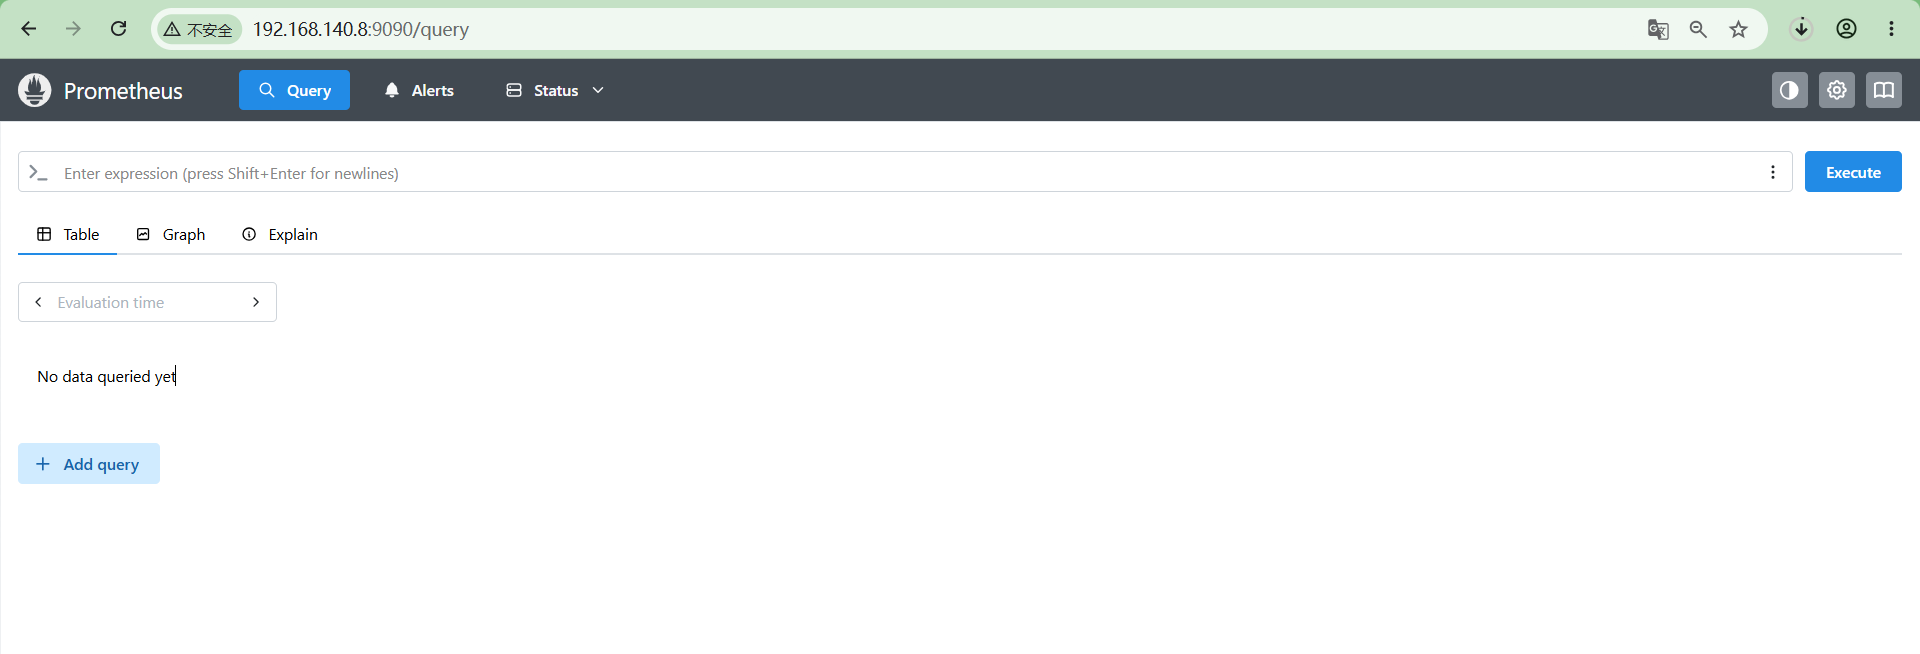
systemctl status prometheus #查看状态登录prometheus验证一下,http://192.168.140.8:9090,可访问,正常。
(8)修改prometheus.yml
添加如下内容到/etc/prometheus/prometheus.yml【注意格式】。
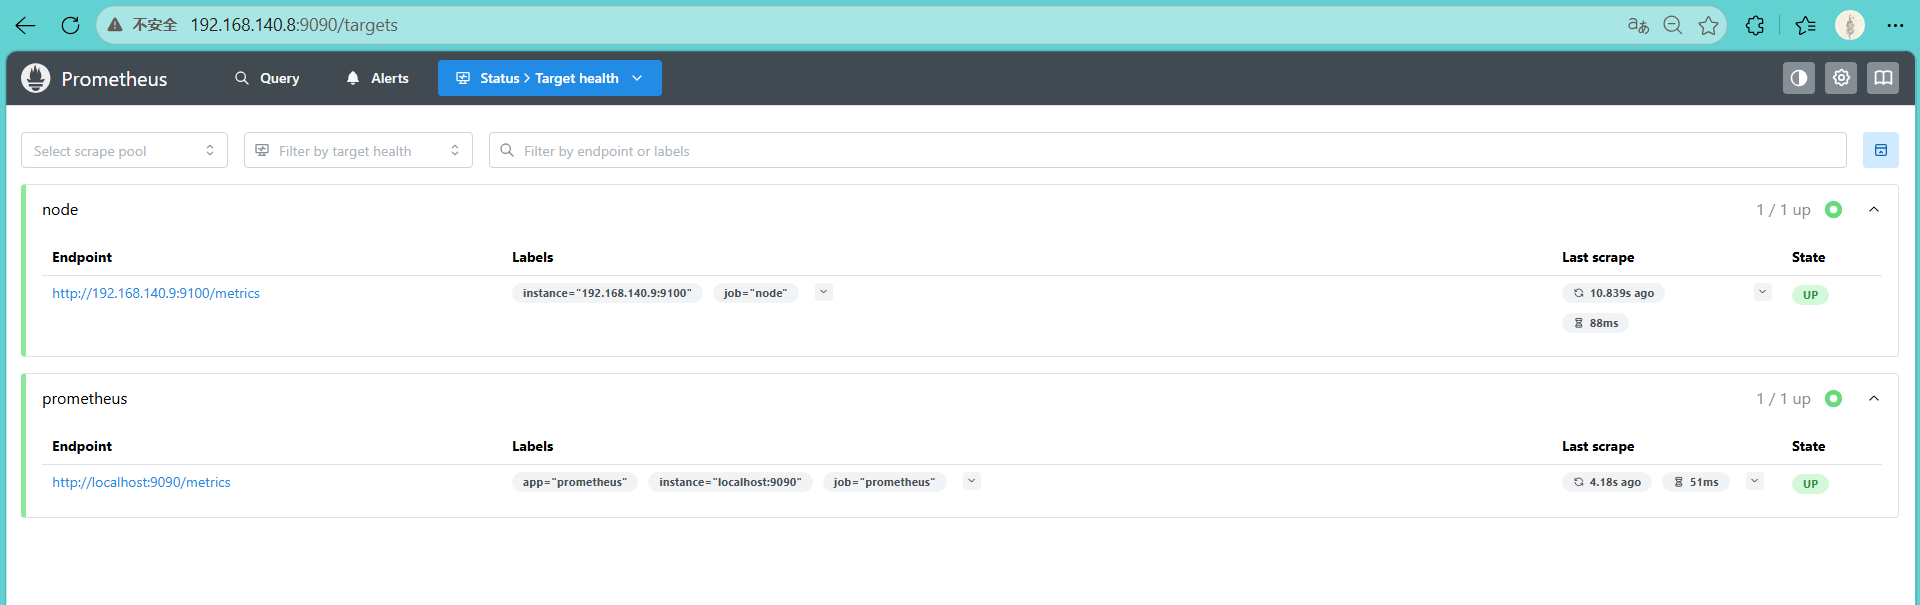
将已安装node_exporter的192.168.140.9接入prometheus。
bash
  - job_name: 'node'
    static_configs:
     - targets:
        - 192.168.140.9:9100
完整配置文件参考
bash
[root@frontend ~]# cat /etc/prometheus/prometheus.yml
# my global config
global:
  scrape_interval: 15s # Set the scrape interval to every 15 seconds. Default is every 1 minute.
  evaluation_interval: 15s # Evaluate rules every 15 seconds. The default is every 1 minute.
  # scrape_timeout is set to the global default (10s).

# Alertmanager configuration
alerting:
  alertmanagers:
    - static_configs:
        - targets:
          # - alertmanager:9093

# Load rules once and periodically evaluate them according to the global 'evaluation_interval'.
rule_files:
  # - "first_rules.yml"
  # - "second_rules.yml"

# A scrape configuration containing exactly one endpoint to scrape:
# Here it's Prometheus itself.
scrape_configs:
  # The job name is added as a label `job=<job_name>` to any timeseries scraped from this config.
  - job_name: "prometheus"

    # metrics_path defaults to '/metrics'
    # scheme defaults to 'http'.

    static_configs:
      - targets: ["localhost:9090"]
       # The label name is added as a label `label_name=<label_value>` to any timeseries scraped from this config.
        labels:
          app: "prometheus"

  - job_name: 'node'
    static_configs:
     - targets:
        - 192.168.140.9:9100  //node_exporter地址
2.安装Node Exporter
离线安装node_exporter-1.11.1.linux-amd64.tar.gz
安装步骤
(1)解压安装包
bash
tar -xzf node_exporter-1.7.2.linux-amd64.tar.gz
cd node_exporter-1.7.2.linux-amd64
(2)创建运行用户
bash
sudo useradd --no-create-home --shell /sbin/nologin node_exporter(3)安装文件
bash
sudo cp node_exporter /usr/local/bin/
sudo chown node_exporter:node_exporter /usr/local/bin/node_exporter
(4)创建服务
bash
/etc/systemd/system/node_exporter.service
[Unit]
Description=Node Exporter
After=network.target

[Service]
User=node_exporter
Group=node_exporter
Type=simple
ExecStart=/usr/local/bin/node_exporter

Restart=on-failure

[Install]
WantedBy=multi-user.target
bash
sudo systemctl daemon-reload #加载配置
sudo systemctl enable --now node_exporter #设置开机自启并启动
sudo systemctl status node_exporter	#查看服务状态
(5)验证
bash
curl http://localhost:9100/metrics能看到一大堆 Prometheus 指标说明安装成功。
3.指标接入
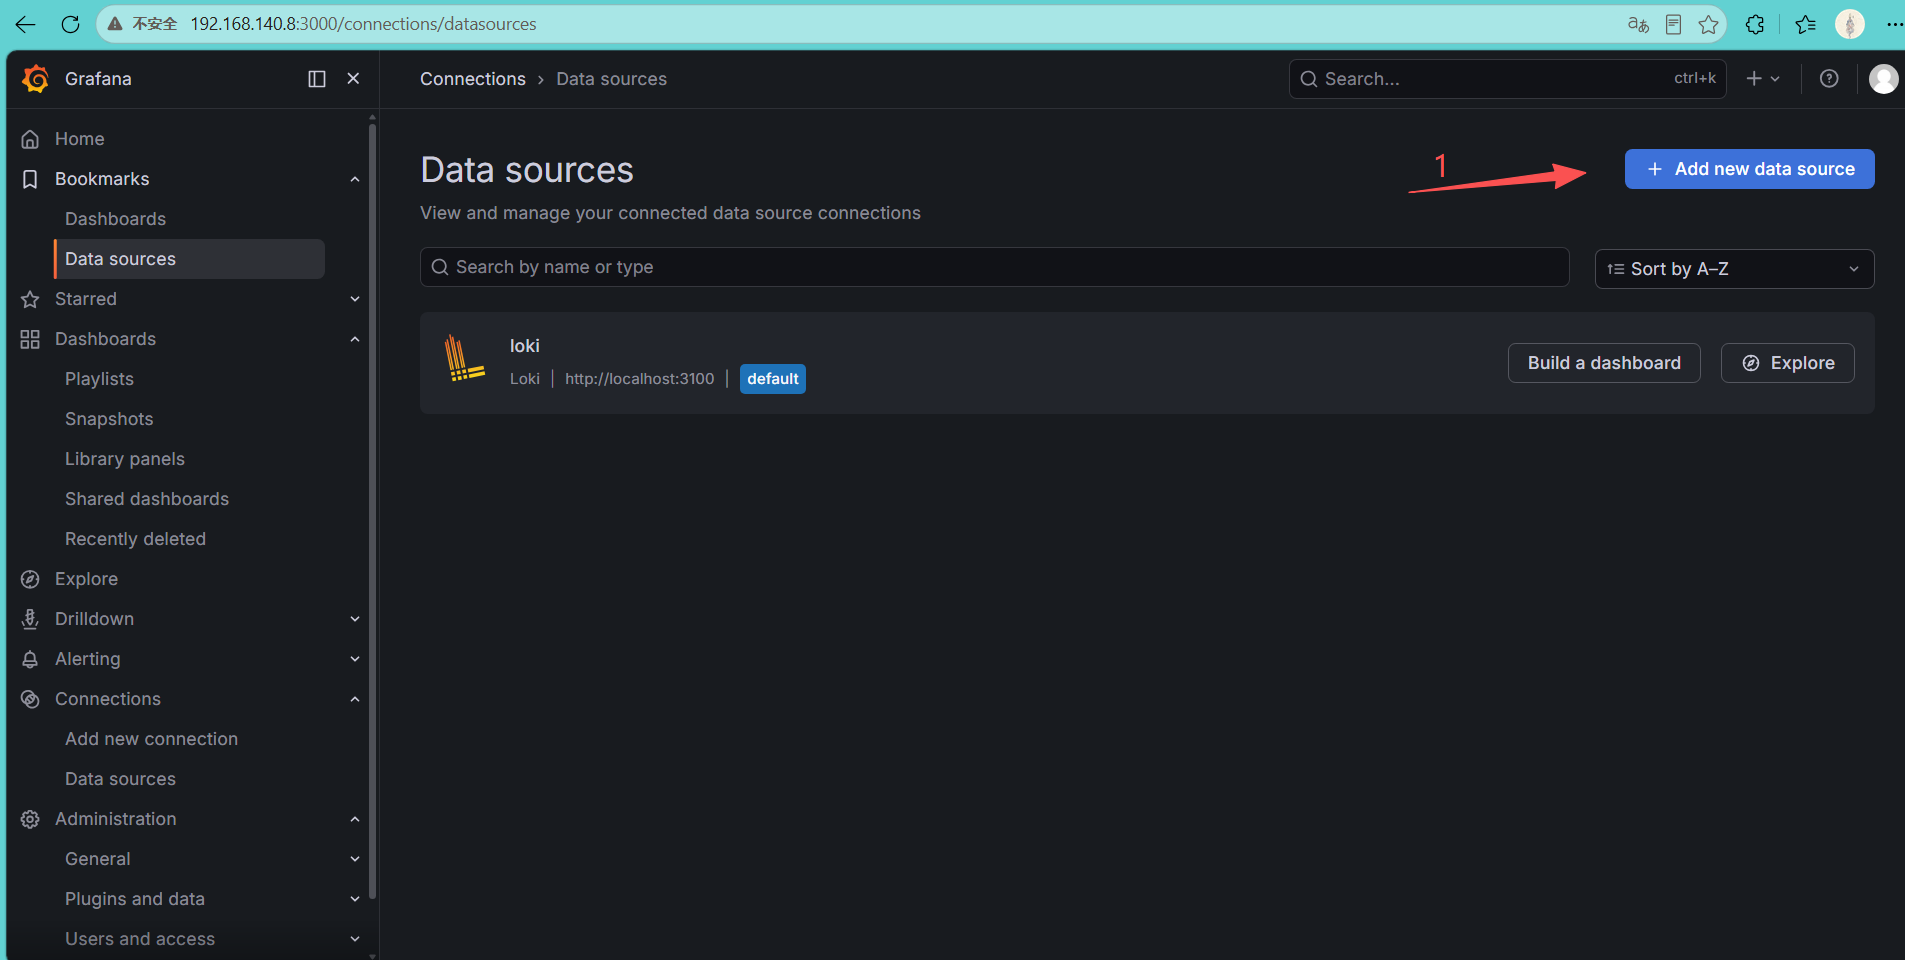
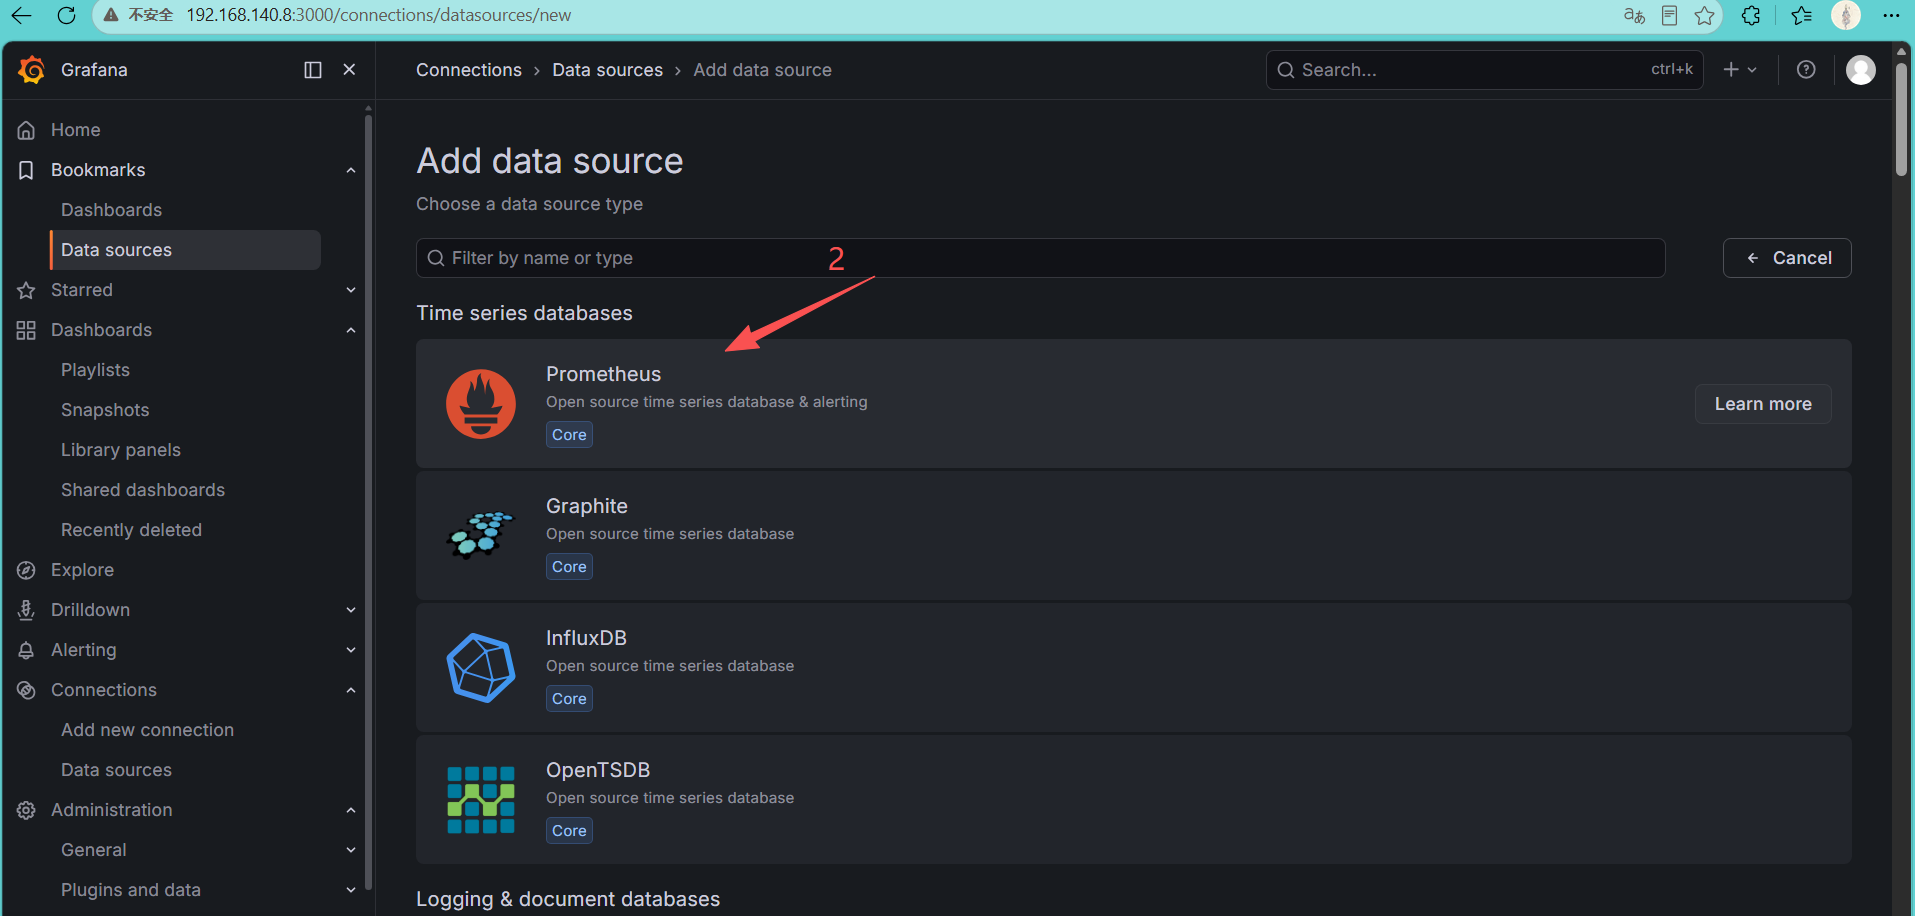
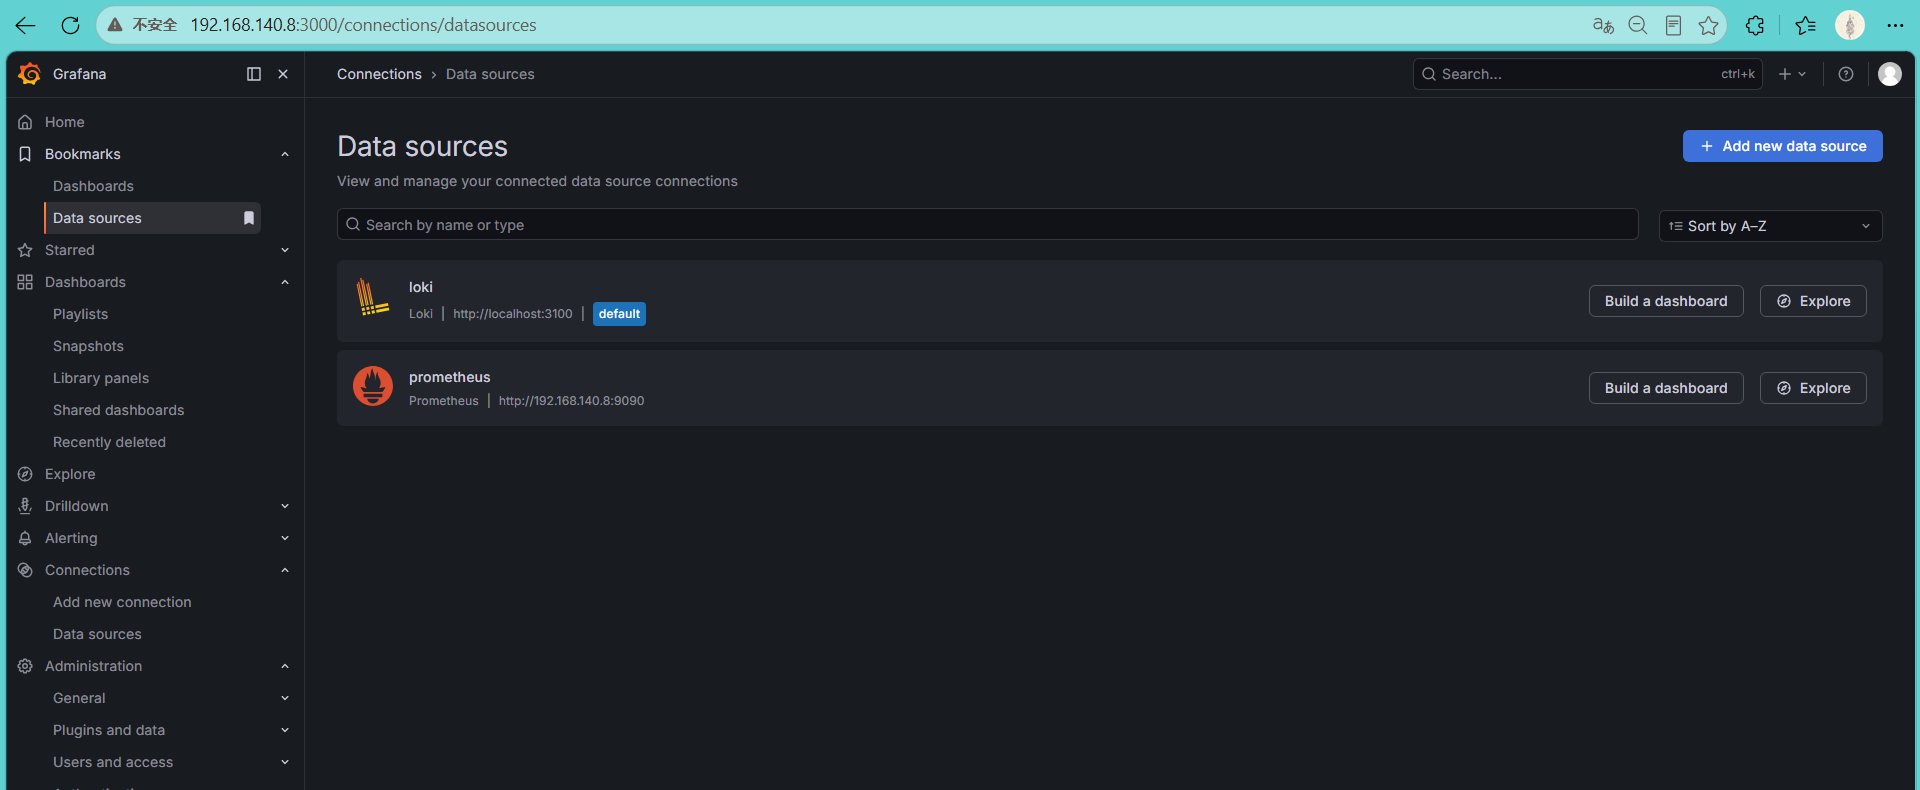
grafana data source 接入 prometheus
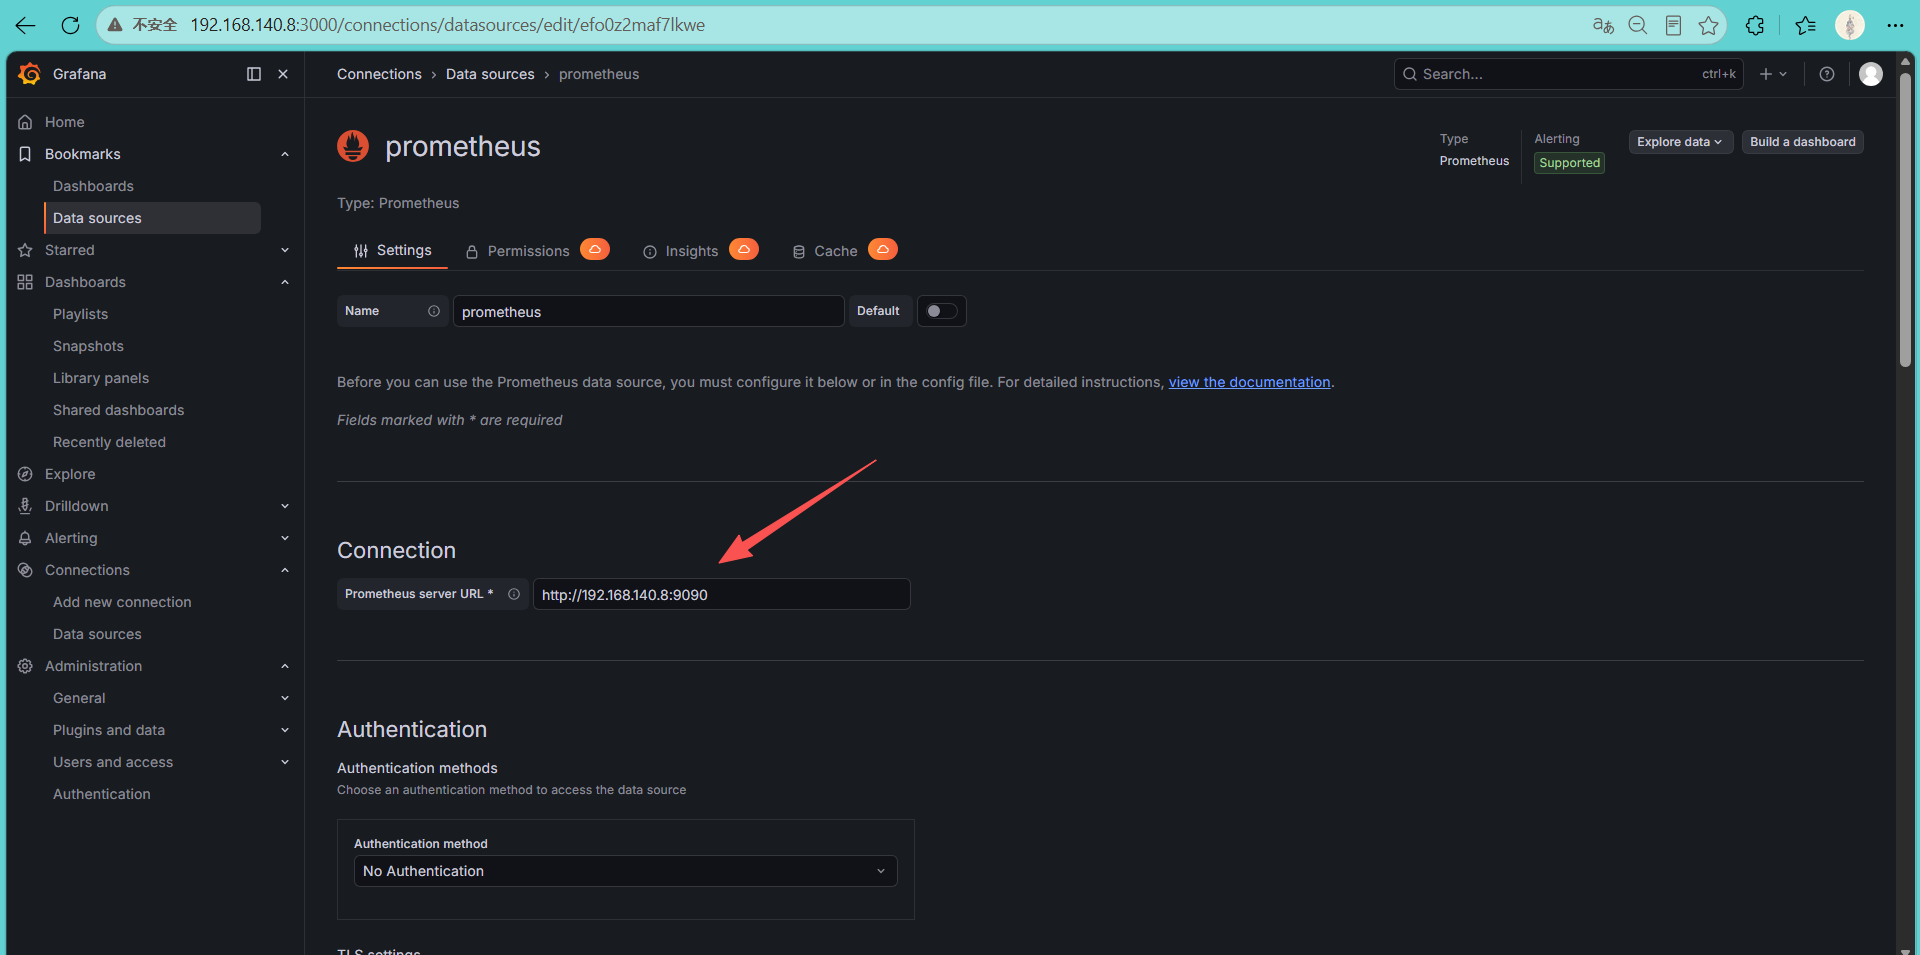
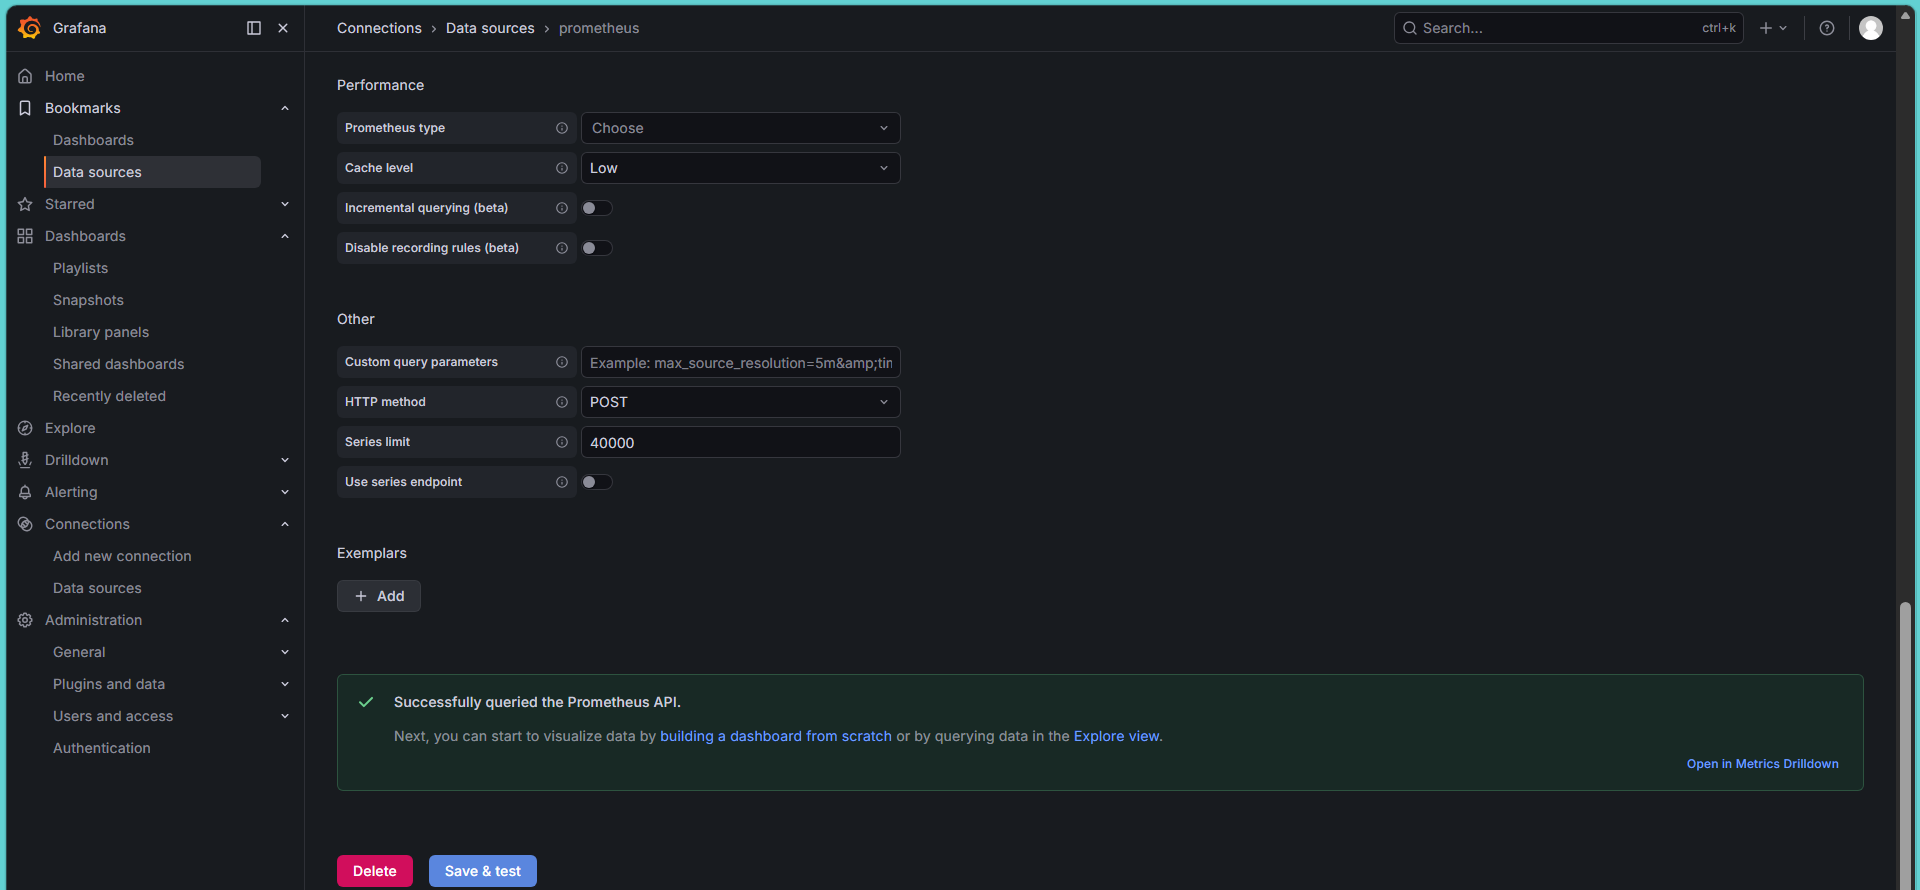
登录premetheus验证node_exporter接入是否正常。如下图显示说明,Grafana 已经通过 Prometheus 获取到了 Node Exporter 数据。
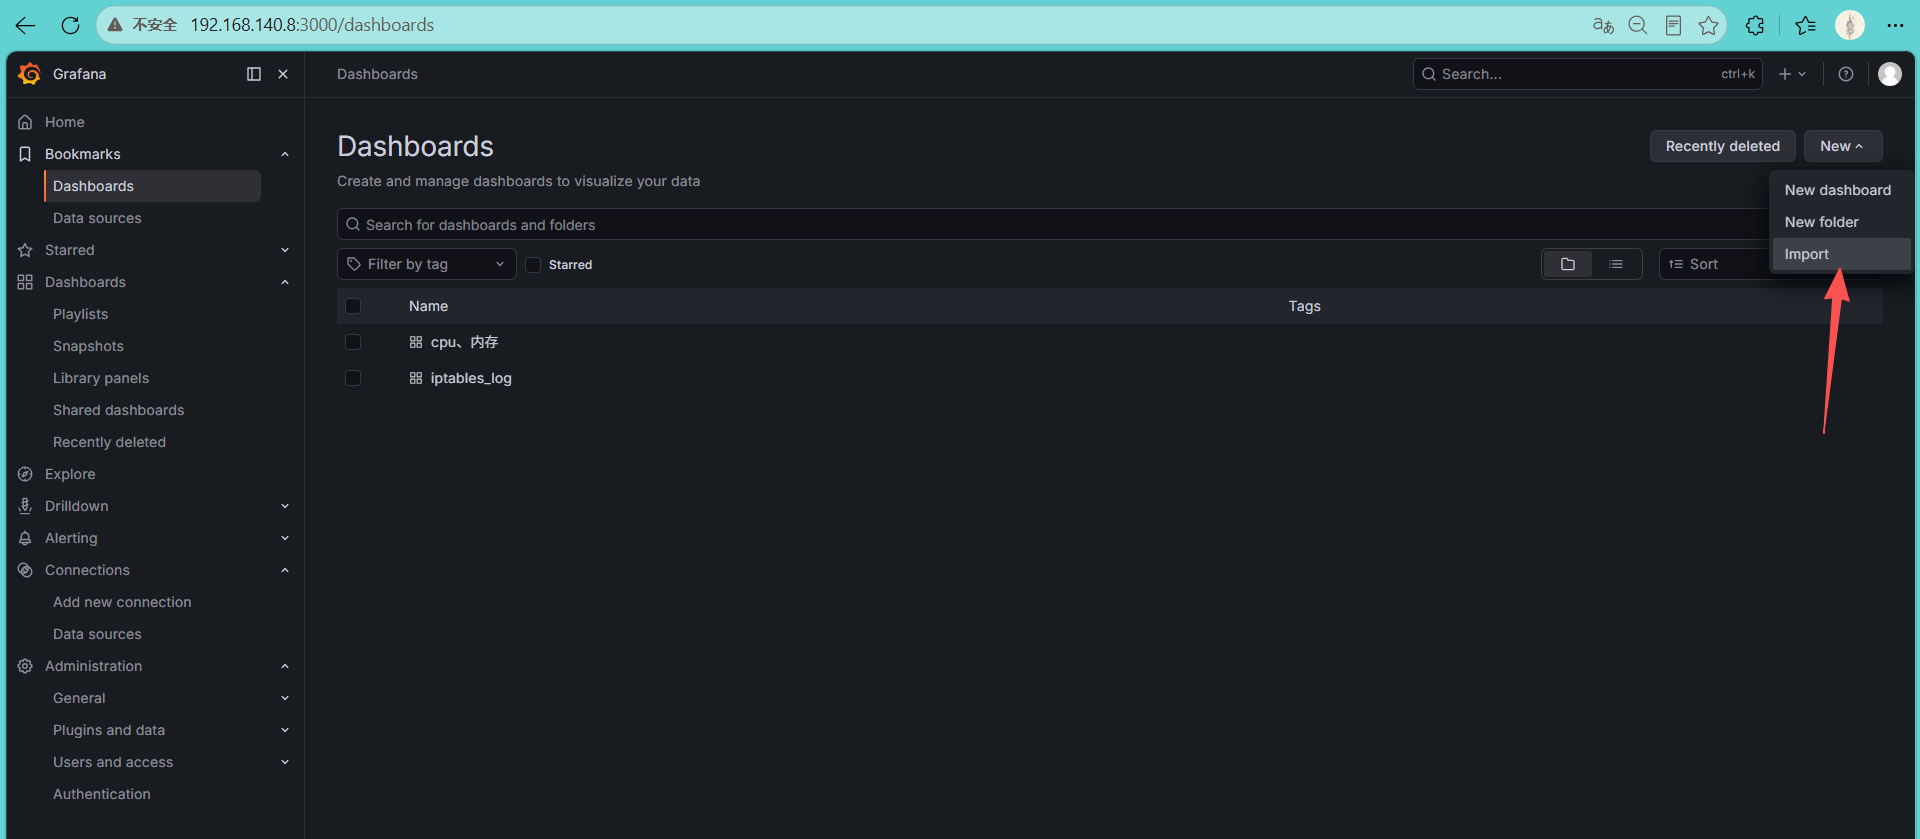
4.导入主机监控面板
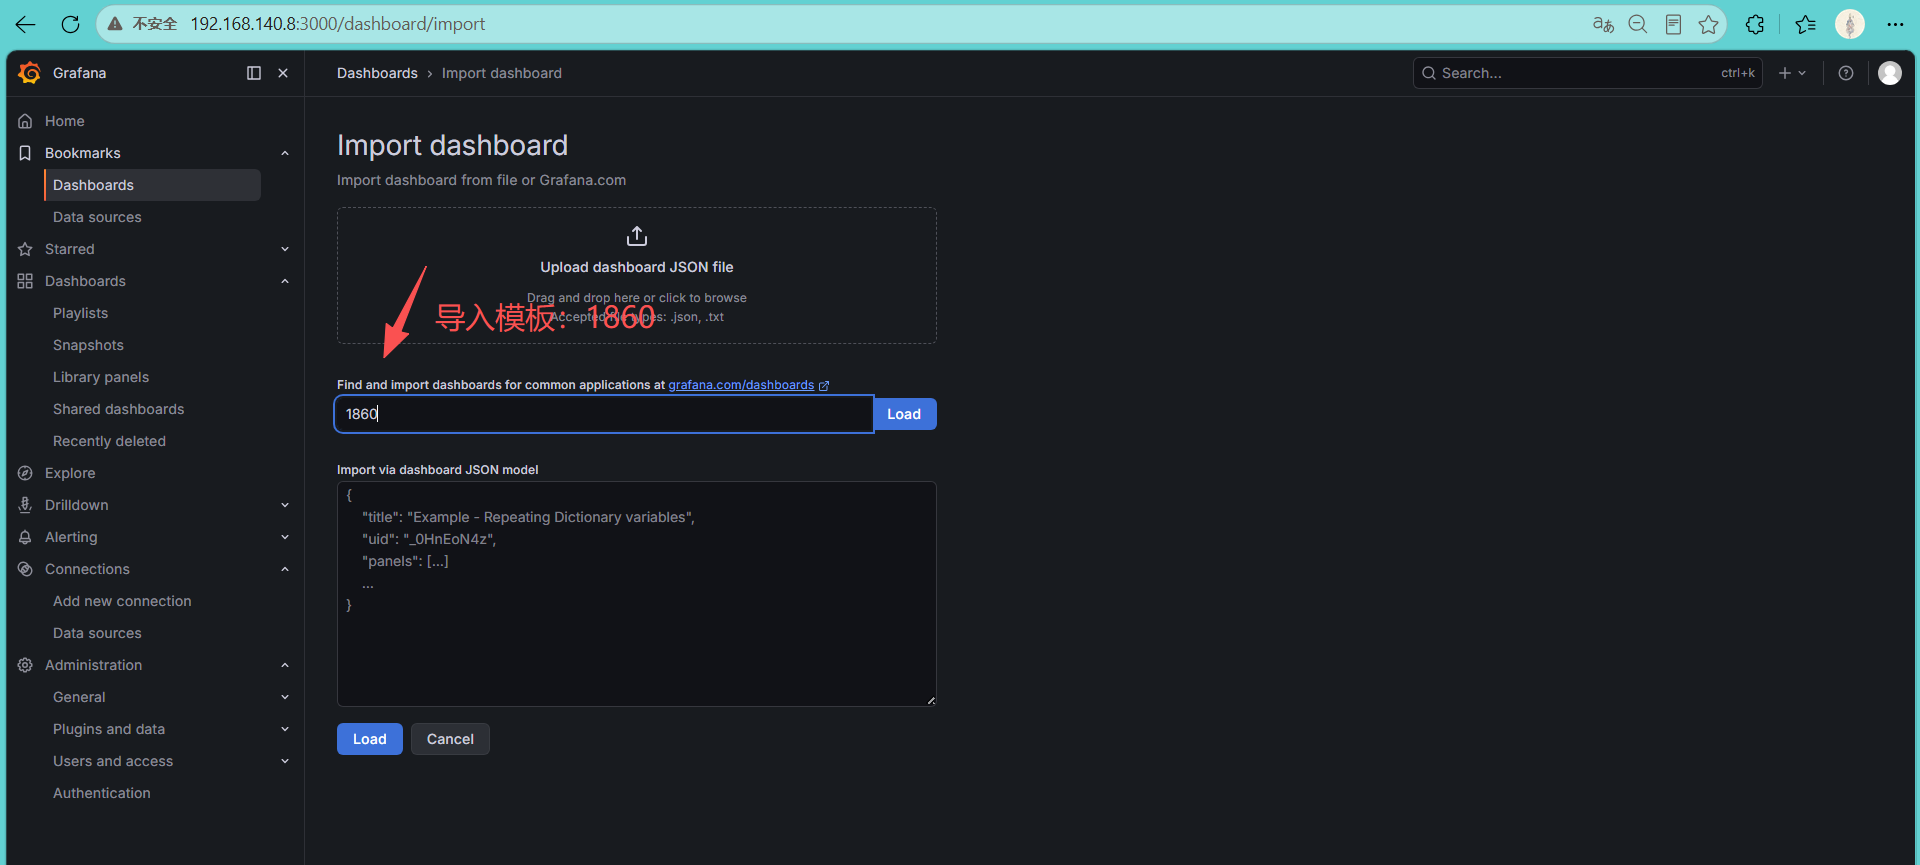
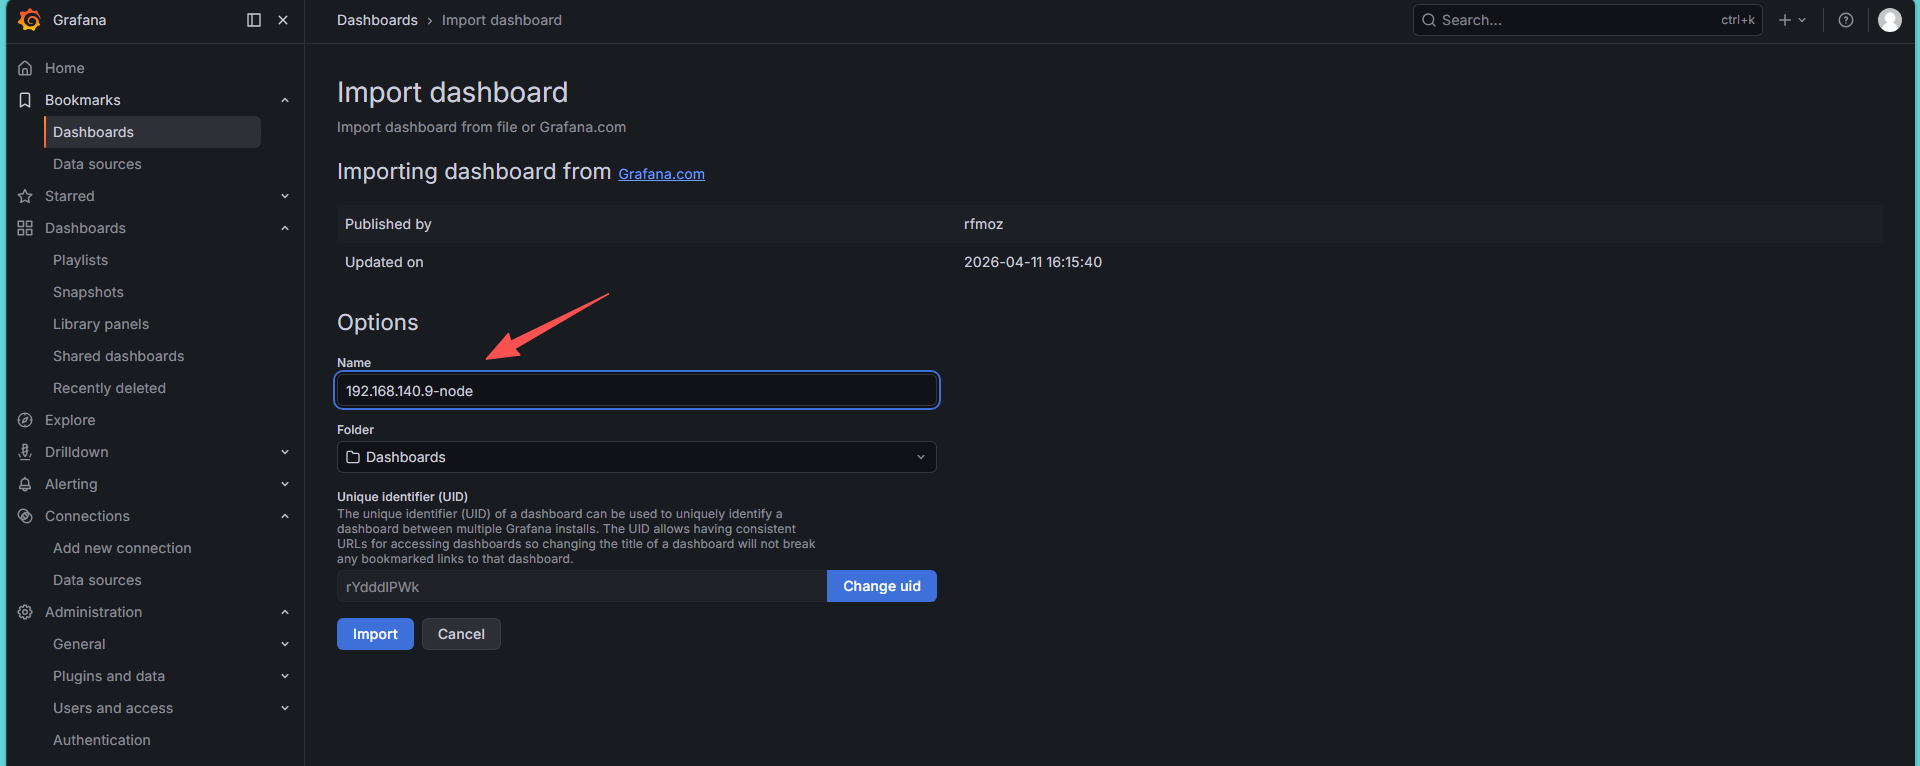
导入成功
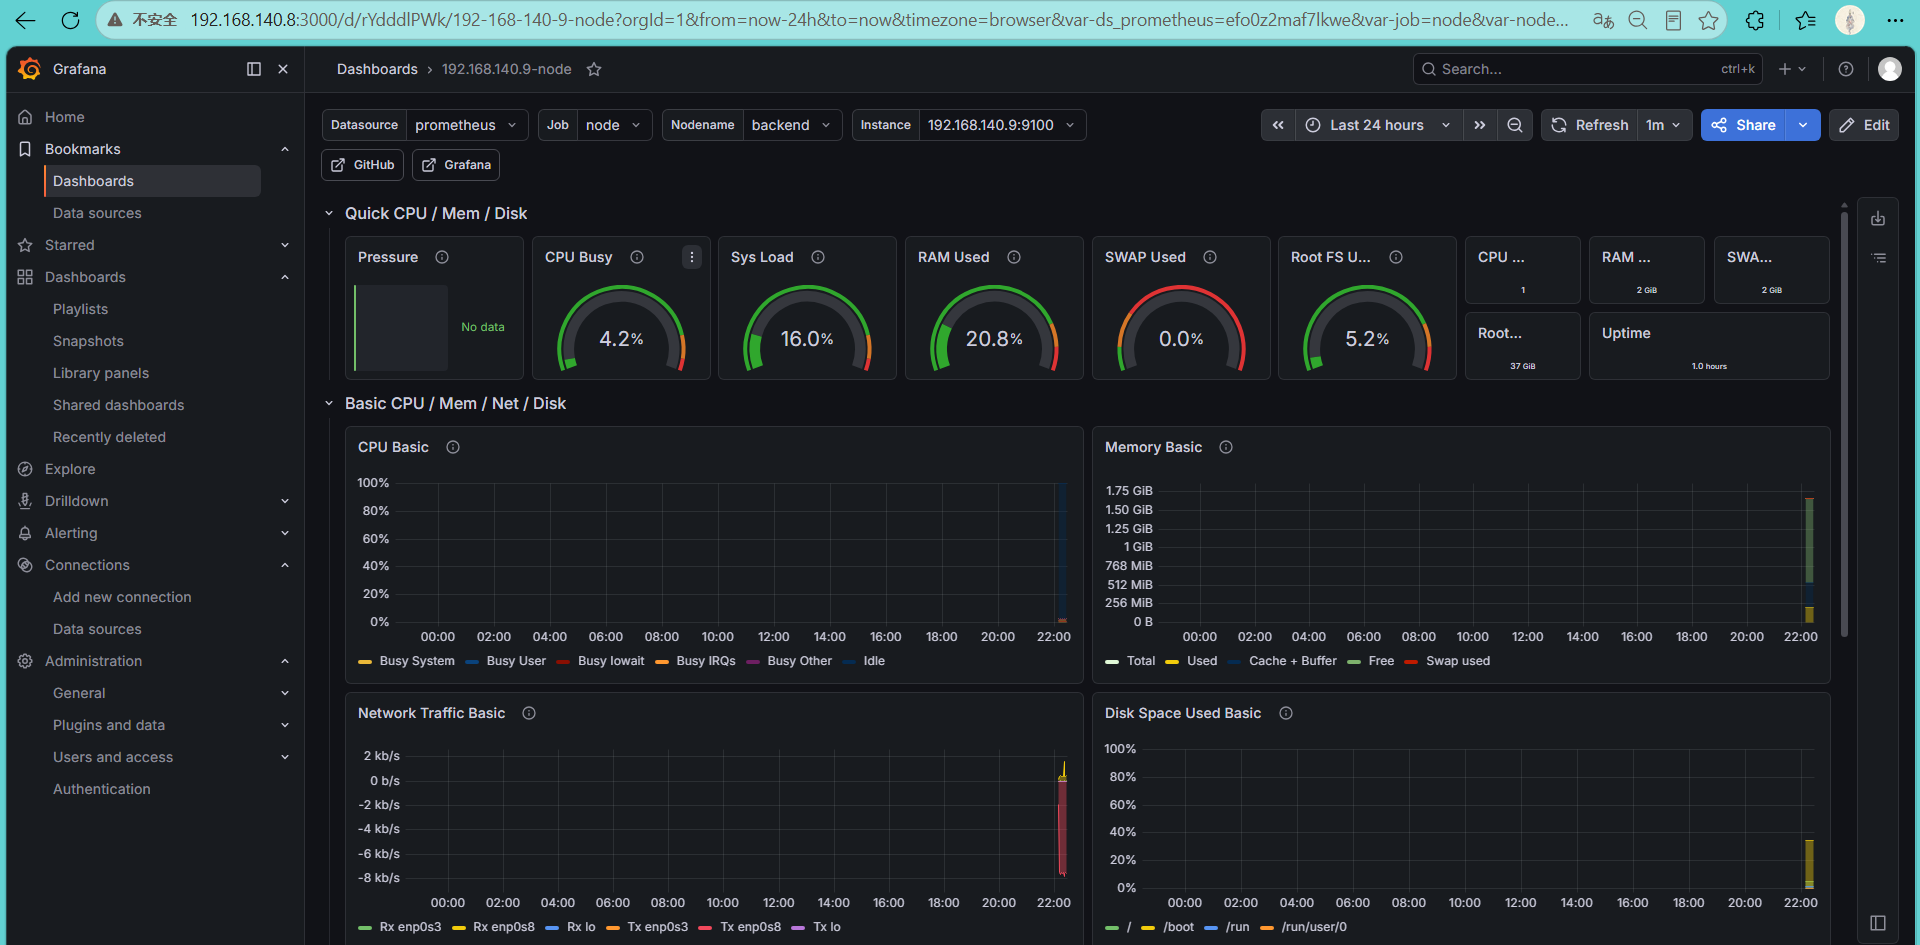
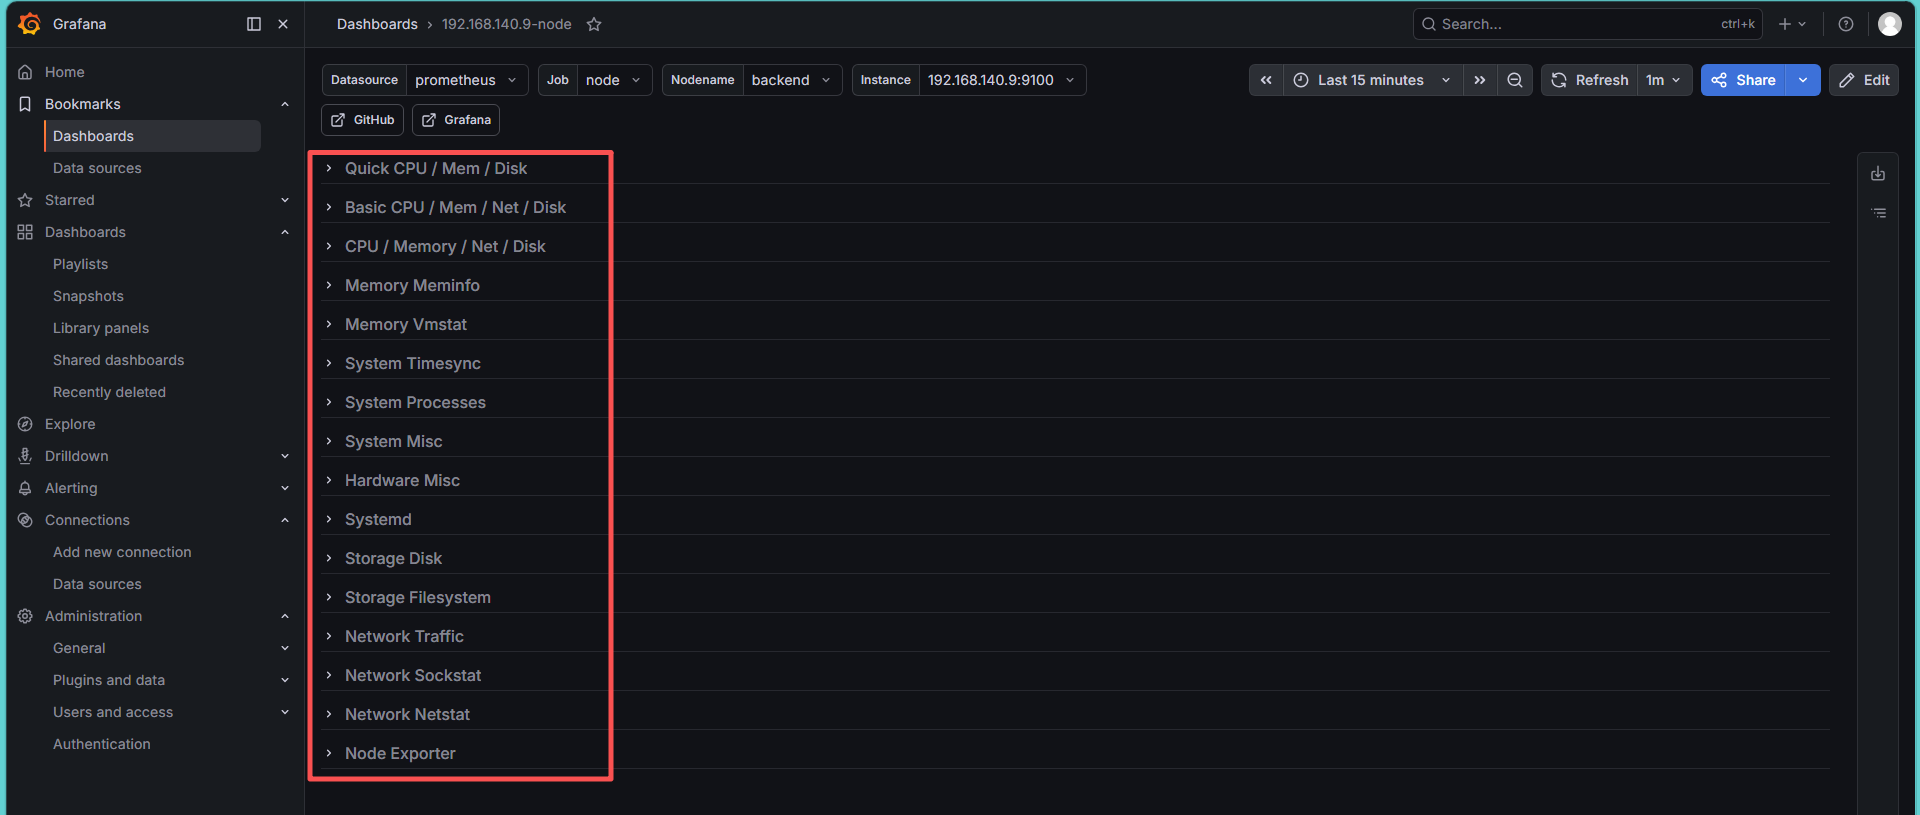
监控指标有多个维度
总结:当前已经接入两个数据源,分别是loki日志接入、prometheus指标接入。
创建了两个仪表盘。