文章目录
- 前言
- [1. 生成 Prometheus 指标](#1. 生成 Prometheus 指标)
-
- [1.1 引入依赖](#1.1 引入依赖)
- [1.2 开放端点](#1.2 开放端点)
- [1.3 查看指标](#1.3 查看指标)
- [2. 集成 Prometheus + Grafana](#2. 集成 Prometheus + Grafana)
-
- [2.1 安装](#2.1 安装)
- [2.2 集成 Prometheus](#2.2 集成 Prometheus)
- [2.3 集成 Grafana](#2.3 集成 Grafana)
-
- [2.3.1 添加数据源](#2.3.1 添加数据源)
- [2.3.2 新建仪表盘](#2.3.2 新建仪表盘)
- [3.3.2 查看监控大盘](#3.3.2 查看监控大盘)
前言
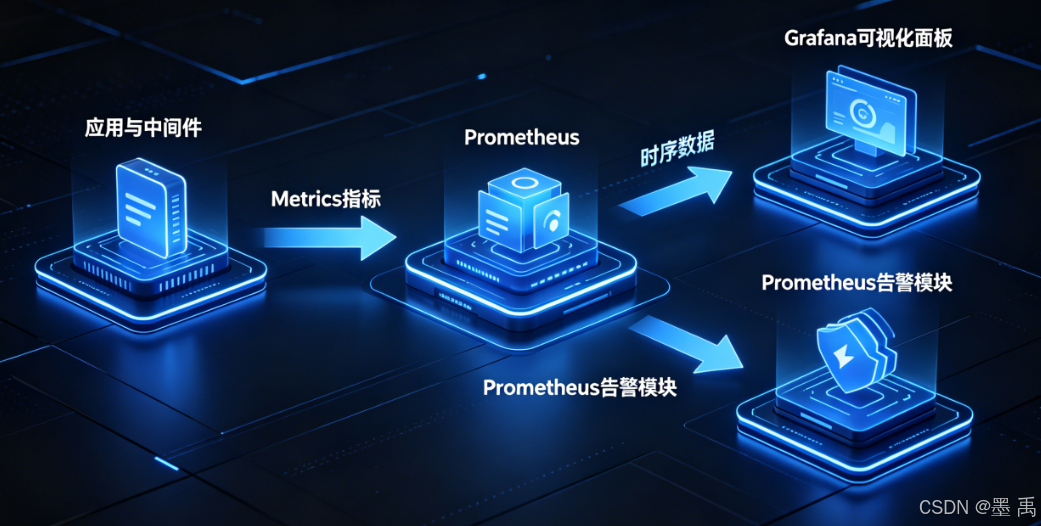
Prometheus + Grafana 是云原生标准监控可视化组合,Prometheus 负责指标采集、存储、告警,Grafana 负责图表展示、大盘、统一视图,广泛用于 Java/Spring 服务、AI 应用、容器、向量库、中间件监控。
常用指标类型:
Counter:计数器(只增不减,如请求总数、错误数)Gauge:仪表盘(可增可减,如内存、CPU、在线连接数)Histogram:直方图(统计请求耗时分布、延迟区间)Summary:摘要(百分位延迟)
适合场景:
Spring Boot/Spring AI微服务、AI应用、RAG系统Docker/ 容器集群监控- 向量数据库、中间件、
API网关监控 - 线上服务稳定性、性能、容量巡检与告警
典型链路:
1. 生成 Prometheus 指标
1.1 引入依赖
xml
        <dependency>
            <groupId>org.springframework.boot</groupId>
            <artifactId>spring-boot-starter-actuator</artifactId>
        </dependency>
        <!-- https://mvnrepository.com/artifact/io.micrometer/micrometer-registry-prometheus -->
        <dependency>
            <groupId>io.micrometer</groupId>
            <artifactId>micrometer-registry-prometheus</artifactId>
        </dependency>
1.2 开放端点
yml
management:
  endpoints:
    # Web端点的配置属性
    web:
      exposure:
        #  开放端点的ID集合(eg:['health','info','beans','env']),配置为"*"表示全部
        include: 'prometheus'
1.3 查看指标
访问:
java
http://localhost:8080/actuator/prometheus你会看到标准 Prometheus 指标,例如:
java
gen_ai_client_token_usage_total{gen_ai_token_type="input",} 120.0
gen_ai_client_token_usage_total{gen_ai_token_type="output",} 80.0
gen_ai_client_operation_seconds_count{gen_ai_system="openai",} 10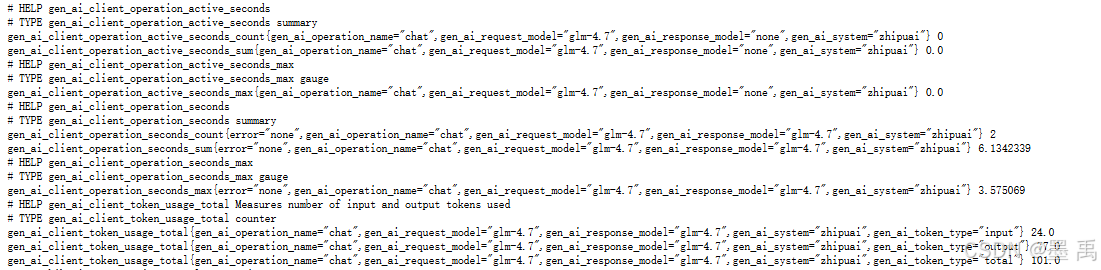
2. 集成 Prometheus + Grafana
2.1 安装
使用 docker-compose 快速安装:
yml
version: "3"
services:
  prometheus:
    image: prom/prometheus
    container_name: prometheus
    restart: always
    user: root
    ports:
      - "9090:9090"  # Prometheus Web UI 的端口映射
    volumes:
      - ./prometheus.yml:/etc/prometheus/prometheus.yml  # Prometheus 配置文件
    command:
      - '--config.file=/etc/prometheus/prometheus.yml'
      - '--storage.tsdb.path=/prometheus'
    networks:
      - monitoring

  grafana:
    image: grafana/grafana
    container_name: grafana
    restart: always
    user: root
    ports:
      - "3000:3000"  # Grafana Web UI 的端口映射
    environment:
      - GF_SECURITY_ADMIN_PASSWORD=admin  # 设置 Grafana 管理员密码
    depends_on:
      - prometheus  # 等待 Prometheus 启动
    networks:
      - monitoring

networks:
  monitoring:
    driver: bridge
2.2 集成 Prometheus
编辑 prometheus.yml文件添加后端地址:
bash
global:
  scrape_interval: 15s

scrape_configs:
  - job_name: 'spring-boot'
    metrics_path: '/actuator/prometheus'
    static_configs:
      - targets: ['192.168.7.84:8080']
访问 Prometheus 查看健康状态:

2.3 集成 Grafana
2.3.1 添加数据源
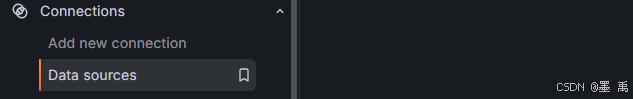
点击左侧菜单栏,选择 Data source :
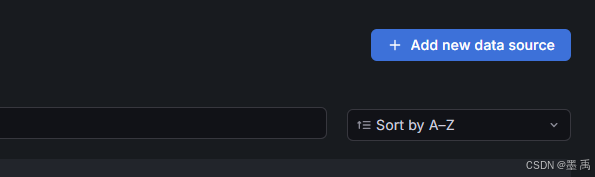
右上角新增数据源:
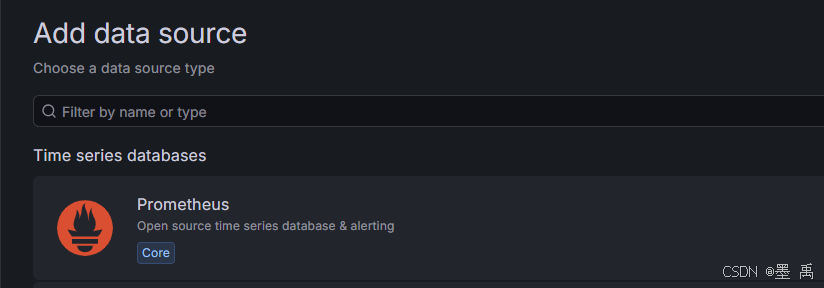
选择 Prometheus :
填写 Prometheus 地址后保存:

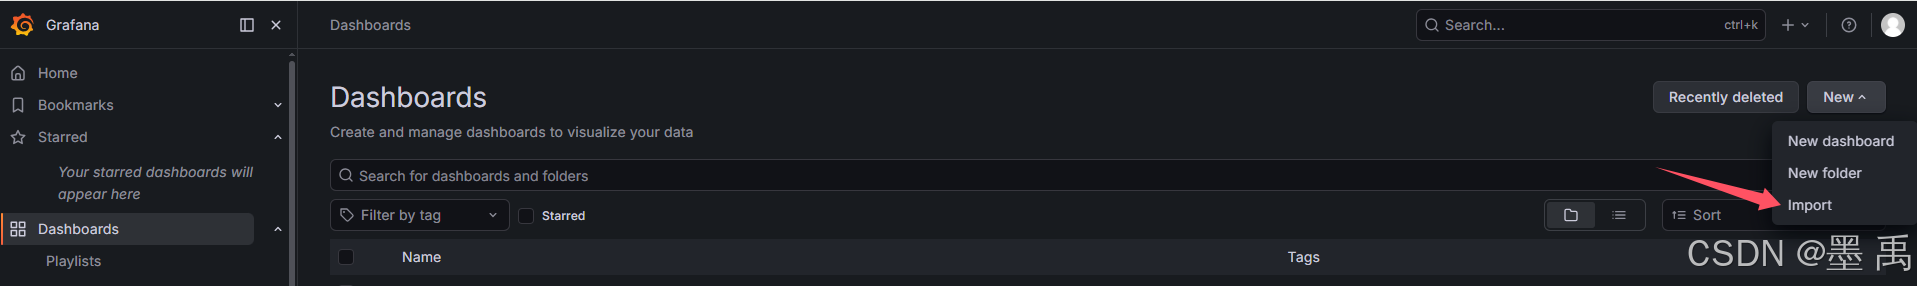
2.3.2 新建仪表盘
点击 Import :
支持多种方式导入:
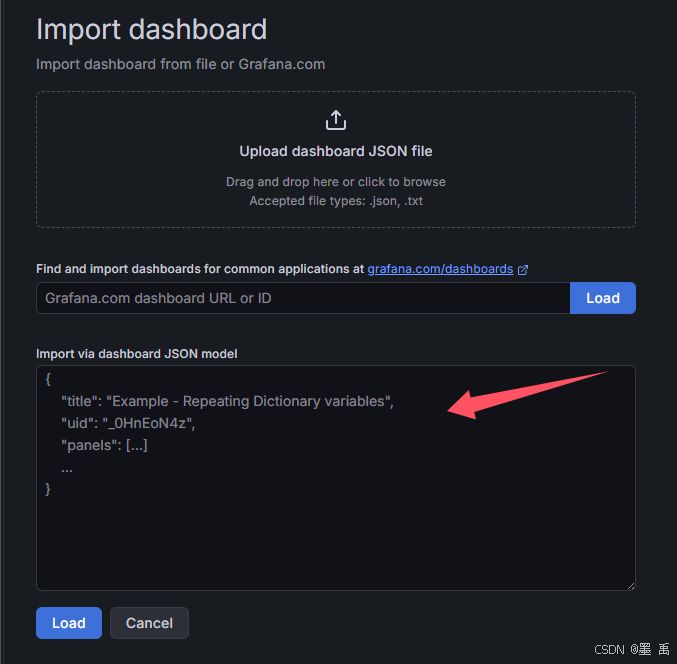
支持多种导入方式,在官方中没找到 Spring AI 相关的仪表盘,这里直接用 AI 写了一个:
json
{
"annotations": {
"list": [
{
"builtIn": 1,
"datasource": {
"type": "grafana",
"uid": "-- Grafana --"
},
"enable": true,
"hide": true,
"iconColor": "rgba(0, 211, 255, 1)",
"name": "Annotations & Alerts",
"type": "dashboard"
}
]
},
"editable": true,
"gnetId": null,
"graphTooltip": 0,
"id": 1,
"iteration": 1770000000000,
"links": [],
"panels": [
{
"collapsed": false,
"datasource": null,
"gridPos": {
"h": 1,
"w": 24,
"x": 0,
"y": 0
},
"id": 20,
"panels": [],
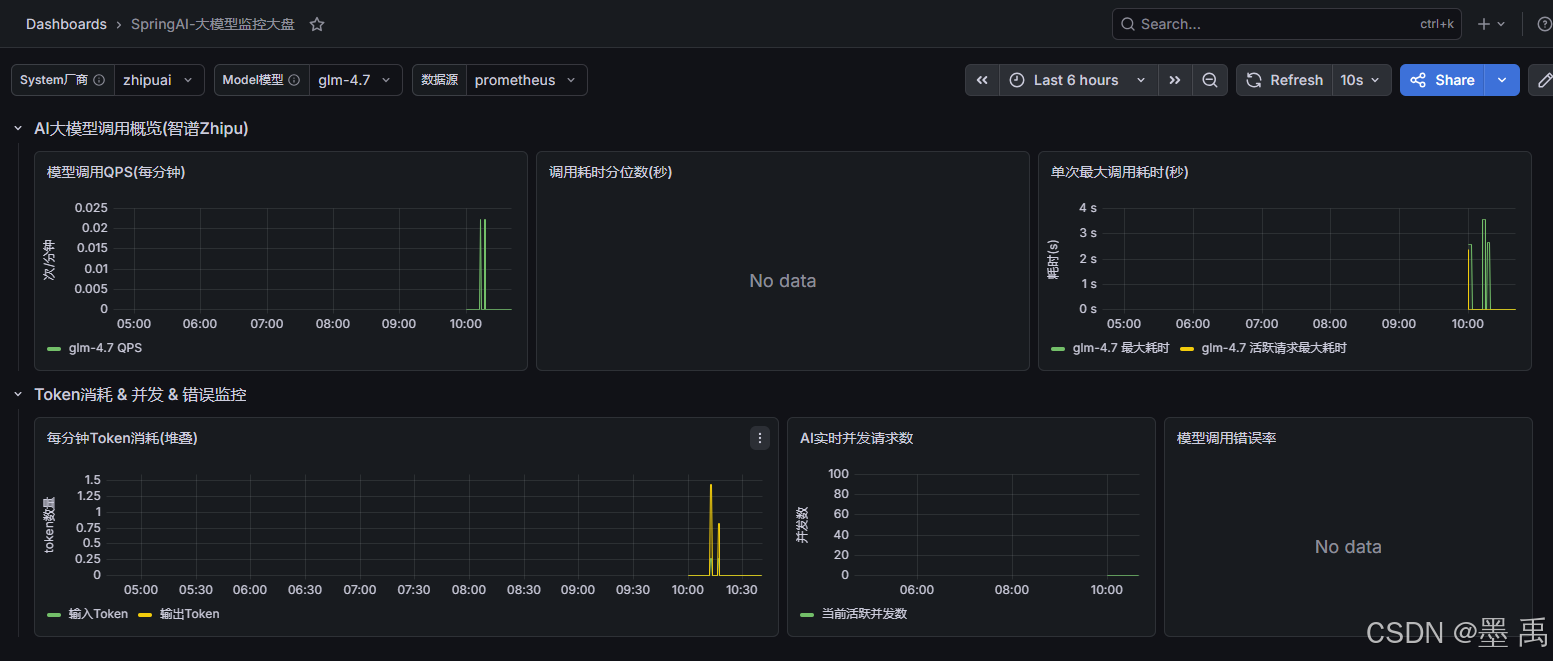
"title": "AI大模型调用概览(智谱Zhipu)",
"type": "row"
},
{
"aliasColors": {},
"bars": false,
"dashLength": 10,
"dashes": false,
"datasource": "${DS_PROM}",
"fill": 1,
"fillGradient": 0,
"gridPos": {
"h": 6,
"w": 8,
"x": 0,
"y": 1
},
"hiddenSeries": false,
"id": 22,
"legend": {
"avg": false,
"current": false,
"max": false,
"min": false,
"show": true,
"total": false,
"values": false
},
"lines": true,
"linewidth": 1,
"nullPointMode": "null",
"options": {
"alertThreshold": true
},
"percentage": false,
"pluginVersion": "9.5.0",
"pointradius": 2,
"points": false,
"renderer": "flot",
"seriesOverrides": [],
"spaceLength": 10,
"stack": false,
"steppedLine": false,
"targets": [
{
"expr": "sum(rate(gen_ai_client_operation_seconds_count{gen_ai_system=~\"$system\",gen_ai_request_model=~\"$model\"}[1m])) by(gen_ai_request_model)",
"interval": "",
"legendFormat": "{{gen_ai_request_model}} QPS",
"refId": "A"
}
],
"thresholds": [],
"timeFrom": null,
"timeRegions": [],
"timeShift": null,
"title": "模型调用QPS(每分钟)",
"tooltip": {
"shared": true,
"sort": 0,
"value_type": "individual"
},
"type": "graph",
"xaxis": {
"buckets": null,
"mode": "time",
"name": null,
"show": true,
"values": []
},
"yaxes": [
{
"format": "short",
"label": "次/分钟",
"logBase": 1,
"max": null,
"min": "0",
"show": true
},
{
"format": "short",
"label": null,
"logBase": 1,
"max": null,
"min": null,
"show": true
}
],
"yaxis": {
"align": false,
"alignLevel": null
}
},
{
"aliasColors": {},
"bars": false,
"dashLength": 10,
"dashes": false,
"datasource": "${DS_PROM}",
"fill": 1,
"fillGradient": 0,
"gridPos": {
"h": 6,
"w": 8,
"x": 8,
"y": 1
},
"hiddenSeries": false,
"id": 24,
"legend": {
"avg": false,
"current": false,
"max": false,
"min": false,
"show": true,
"total": false,
"values": false
},
"lines": true,
"linewidth": 1,
"nullPointMode": "null",
"options": {
"alertThreshold": true
},
"percentage": false,
"pluginVersion": "9.5.0",
"pointradius": 2,
"points": false,
"renderer": "flot",
"seriesOverrides": [],
"spaceLength": 10,
"stack": false,
"steppedLine": false,
"targets": [
{
"expr": "histogram_quantile(0.50, sum(rate(gen_ai_client_operation_seconds_bucket{gen_ai_system=~\"$system\",gen_ai_request_model=~\"$model\"}[1m])) by(le,gen_ai_request_model))",
"interval": "",
"legendFormat": "{{gen_ai_request_model}} P50",
"refId": "A"
},
{
"expr": "histogram_quantile(0.95, sum(rate(gen_ai_client_operation_seconds_bucket{gen_ai_system=~\"$system\",gen_ai_request_model=~\"$model\"}[1m])) by(le,gen_ai_request_model))",
"interval": "",
"legendFormat": "{{gen_ai_request_model}} P95",
"refId": "B"
},
{
"expr": "histogram_quantile(0.99, sum(rate(gen_ai_client_operation_seconds_bucket{gen_ai_system=~\"$system\",gen_ai_request_model=~\"$model\"}[1m])) by(le,gen_ai_request_model))",
"interval": "",
"legendFormat": "{{gen_ai_request_model}} P99",
"refId": "C"
}
],
"thresholds": [],
"timeFrom": null,
"timeRegions": [],
"timeShift": null,
"title": "调用耗时分位数(秒)",
"tooltip": {
"shared": true,
"sort": 0,
"value_type": "individual"
},
"type": "graph",
"xaxis": {
"buckets": null,
"mode": "time",
"name": null,
"show": true,
"values": []
},
"yaxes": [
{
"format": "s",
"label": "耗时(s)",
"logBase": 1,
"max": null,
"min": "0",
"show": true
},
{
"format": "short",
"label": null,
"logBase": 1,
"max": null,
"min": null,
"show": true
}
],
"yaxis": {
"align": false,
"alignLevel": null
}
},
{
"aliasColors": {},
"bars": false,
"dashLength": 10,
"dashes": false,
"datasource": "${DS_PROM}",
"fill": 1,
"fillGradient": 0,
"gridPos": {
"h": 6,
"w": 8,
"x": 16,
"y": 1
},
"hiddenSeries": false,
"id": 26,
"legend": {
"avg": false,
"current": false,
"max": false,
"min": false,
"show": true,
"total": false,
"values": false
},
"lines": true,
"linewidth": 1,
"nullPointMode": "null",
"options": {
"alertThreshold": true
},
"percentage": false,
"pluginVersion": "9.5.0",
"pointradius": 2,
"points": false,
"renderer": "flot",
"seriesOverrides": [],
"spaceLength": 10,
"stack": false,
"steppedLine": false,
"targets": [
{
"expr": "gen_ai_client_operation_seconds_max{gen_ai_system=~\"$system\",gen_ai_request_model=~\"$model\"}",
"interval": "",
"legendFormat": "{{gen_ai_request_model}} 最大耗时",
"refId": "A"
},
{
"expr": "gen_ai_client_operation_active_seconds_max{gen_ai_system=~\"$system\",gen_ai_request_model=~\"$model\"}",
"interval": "",
"legendFormat": "{{gen_ai_request_model}} 活跃请求最大耗时",
"refId": "B"
}
],
"thresholds": [],
"timeFrom": null,
"timeRegions": [],
"timeShift": null,
"title": "单次最大调用耗时(秒)",
"tooltip": {
"shared": true,
"sort": 0,
"value_type": "individual"
},
"type": "graph",
"xaxis": {
"buckets": null,
"mode": "time",
"name": null,
"show": true,
"values": []
},
"yaxes": [
{
"format": "s",
"label": "耗时(s)",
"logBase": 1,
"max": null,
"min": "0",
"show": true
},
{
"format": "short",
"label": null,
"logBase": 1,
"max": null,
"min": null,
"show": true
}
],
"yaxis": {
"align": false,
"alignLevel": null
}
},
{
"collapsed": false,
"datasource": null,
"gridPos": {
"h": 1,
"w": 24,
"x": 0,
"y": 7
},
"id": 28,
"panels": [],
"title": "Token消耗 & 并发 & 错误监控",
"type": "row"
},
{
"aliasColors": {},
"bars": false,
"dashLength": 10,
"dashes": false,
"datasource": "${DS_PROM}",
"fill": 1,
"fillGradient": 0,
"gridPos": {
"h": 6,
"w": 12,
"x": 0,
"y": 8
},
"hiddenSeries": false,
"id": 30,
"legend": {
"avg": false,
"current": false,
"max": false,
"min": false,
"show": true,
"total": false,
"values": false
},
"lines": true,
"linewidth": 1,
"nullPointMode": "null",
"options": {
"alertThreshold": true
},
"percentage": false,
"pluginVersion": "9.5.0",
"pointradius": 2,
"points": false,
"renderer": "flot",
"seriesOverrides": [],
"spaceLength": 10,
"stack": true,
"steppedLine": false,
"targets": [
{
"expr": "sum(rate(gen_ai_client_token_usage_total{gen_ai_system=~\"$system\",gen_ai_request_model=~\"$model\",gen_ai_token_type=\"input\"}[1m])) by(gen_ai_token_type)",
"interval": "",
"legendFormat": "输入Token",
"refId": "A"
},
{
"expr": "sum(rate(gen_ai_client_token_usage_total{gen_ai_system=~\"$system\",gen_ai_request_model=~\"$model\",gen_ai_token_type=\"output\"}[1m])) by(gen_ai_token_type)",
"interval": "",
"legendFormat": "输出Token",
"refId": "B"
}
],
"thresholds": [],
"timeFrom": null,
"timeRegions": [],
"timeShift": null,
"title": "每分钟Token消耗(堆叠)",
"tooltip": {
"shared": true,
"sort": 0,
"value_type": "individual"
},
"type": "graph",
"xaxis": {
"buckets": null,
"mode": "time",
"name": null,
"show": true,
"values": []
},
"yaxes": [
{
"format": "short",
"label": "token数量",
"logBase": 1,
"max": null,
"min": "0",
"show": true
},
{
"format": "short",
"label": null,
"logBase": 1,
"max": null,
"min": null,
"show": true
}
],
"yaxis": {
"align": false,
"alignLevel": null
}
},
{
"aliasColors": {},
"bars": false,
"dashLength": 10,
"dashes": false,
"datasource": "${DS_PROM}",
"fill": 1,
"fillGradient": 0,
"gridPos": {
"h": 6,
"w": 6,
"x": 12,
"y": 8
},
"hiddenSeries": false,
"id": 32,
"legend": {
"avg": false,
"current": false,
"max": false,
"min": false,
"show": true,
"total": false,
"values": false
},
"lines": true,
"linewidth": 1,
"nullPointMode": "null",
"options": {
"alertThreshold": true
},
"percentage": false,
"pluginVersion": "9.5.0",
"pointradius": 2,
"points": false,
"renderer": "flot",
"seriesOverrides": [],
"spaceLength": 10,
"stack": false,
"steppedLine": false,
"targets": [
{
"expr": "sum(gen_ai_client_operation_active_seconds_count{gen_ai_system=~\"$system\",gen_ai_request_model=~\"$model\"})",
"interval": "",
"legendFormat": "当前活跃并发数",
"refId": "A"
}
],
"thresholds": [],
"timeFrom": null,
"timeRegions": [],
"timeShift": null,
"title": "AI实时并发请求数",
"tooltip": {
"shared": true,
"sort": 0,
"value_type": "individual"
},
"type": "graph",
"xaxis": {
"buckets": null,
"mode": "time",
"name": null,
"show": true,
"values": []
},
"yaxes": [
{
"format": "short",
"label": "并发数",
"logBase": 1,
"max": null,
"min": "0",
"show": true
},
{
"format": "short",
"label": null,
"logBase": 1,
"max": null,
"min": null,
"show": true
}
],
"yaxis": {
"align": false,
"alignLevel": null
}
},
{
"aliasColors": {},
"bars": false,
"dashLength": 10,
"dashes": false,
"datasource": "${DS_PROM}",
"fill": 1,
"fillGradient": 0,
"gridPos": {
"h": 6,
"w": 6,
"x": 18,
"y": 8
},
"hiddenSeries": false,
"id": 34,
"legend": {
"avg": false,
"current": false,
"max": false,
"min": false,
"show": true,
"total": false,
"values": false
},
"lines": true,
"linewidth": 1,
"nullPointMode": "null",
"options": {
"alertThreshold": true
},
"percentage": false,
"pluginVersion": "9.5.0",
"pointradius": 2,
"points": false,
"renderer": "flot",
"seriesOverrides": [],
"spaceLength": 10,
"stack": false,
"steppedLine": false,
"targets": [
{
"expr": "sum(rate(gen_ai_client_operation_seconds_count{error!=\"none\",gen_ai_system=~\"$system\"}[1m])) / sum(rate(gen_ai_client_operation_seconds_count{gen_ai_system=~\"$system\"}[1m]))",
"interval": "",
"legendFormat": "全局错误率",
"refId": "A"
}
],
"thresholds": [],
"timeFrom": null,
"timeRegions": [],
"timeShift": null,
"title": "模型调用错误率",
"tooltip": {
"shared": true,
"sort": 0,
"value_type": "individual"
},
"type": "graph",
"xaxis": {
"buckets": null,
"mode": "time",
"name": null,
"show": true,
"values": []
},
"yaxes": [
{
"format": "percentunit",
"label": "错误率",
"logBase": 1,
"max": "1",
"min": "0",
"show": true
},
{
"format": "short",
"label": null,
"logBase": 1,
"max": null,
"min": null,
"show": true
}
],
"yaxis": {
"align": false,
"alignLevel": null
}
}
],
"refresh": "10s",
"schemaVersion": 38,
"style": "dark",
"tags": ["SpringAI","ZhipuGLM","Prometheus"],
"templating": {
"list": [
{
"allValue": null,
"current": {
"selected": false,
"text": "All",
"value": "$__all"
},
"datasource": "${DS_PROM}",
"definition": "label_values(gen_ai_system)",
"description": "AI厂商",
"hide": 0,
"includeAll": true,
"label": "System厂商",
"multi": false,
"name": "system",
"options": [],
"query": {
"query": "label_values(gen_ai_system)",
"refId": "StandardVariableQuery"
},
"refresh": 1,
"regex": "",
"skipUrlSync": false,
"sort": 1,
"tagValuesQuery": "",
"tags": [],
"tagsQuery": "",
"type": "query",
"useTags": false
},
{
"allValue": null,
"current": {
"selected": false,
"text": "All",
"value": "$__all"
},
"datasource": "${DS_PROM}",
"definition": "label_values(gen_ai_request_model)",
"description": "模型名称",
"hide": 0,
"includeAll": true,
"label": "Model模型",
"multi": false,
"name": "model",
"options": [],
"query": {
"query": "label_values(gen_ai_request_model)",
"refId": "StandardVariableQuery"
},
"refresh": 1,
"regex": "",
"skipUrlSync": false,
"sort": 1,
"tagValuesQuery": "",
"tags": [],
"tagsQuery": "",
"type": "query",
"useTags": false
},
{
"allValue": null,
"current": {
"selected": false,
"text": "Prometheus",
"value": "Prometheus"
},
"hide": 0,
"includeAll": false,
"label": "数据源",
"multi": false,
"name": "DS_PROM",
"options": [],
"query": {
"query": "prometheus",
"refId": "StandardVariableQuery"
},
"refresh": 1,
"regex": "",
"skipUrlSync": false,
"type": "datasource"
}
]
},
"time": {
"from": "now-6h",
"to": "now"
},
"timepicker": {
"refresh_intervals": ["5s","10s","30s","1m","5m","15m","30m","1h","2h","1d"]
},
"timezone": "",
"title": "SpringAI-ZhipuGLM大模型监控大盘",
"uid": "springai-zhipu-monitor",
"version": 1
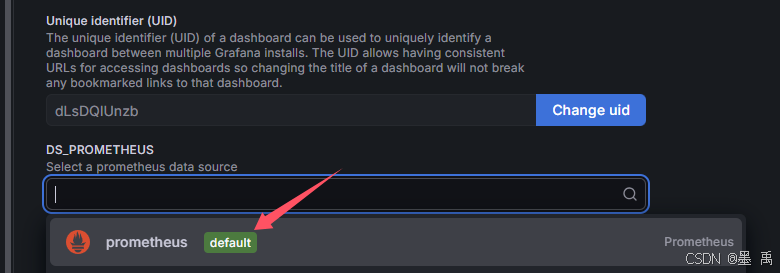
}下一步选择数据源:
3.3.2 查看监控大盘