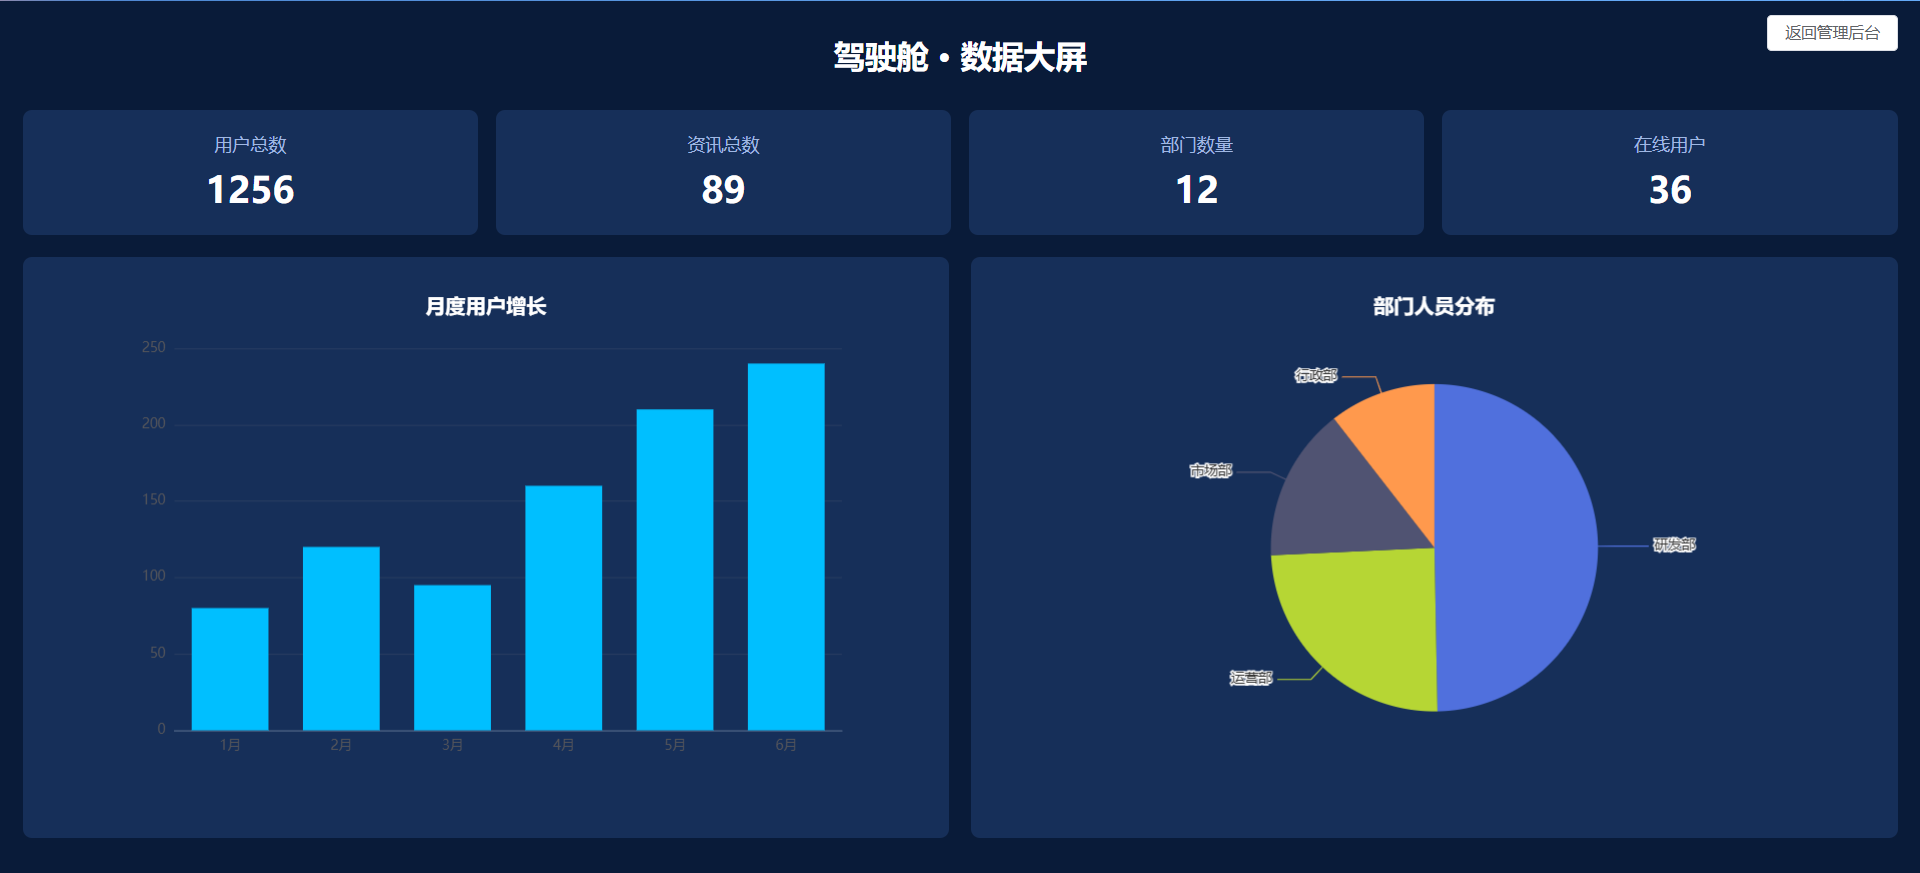
<template>
  <div class="cockpit-wrap">
    <!-- 返回后台按钮 -->
    <el-button class="back-btn" @click="backAdmin">返回管理后台</el-button>
    <h1 class="title">驾驶舱 · 数据大屏</h1>

    <!-- 顶部指标卡片 -->
    <div class="card-row">
      <div class="stat-card">
        <div class="label">用户总数</div>
        <div class="num">{{ statData.userTotal }}</div>
      </div>
      <div class="stat-card">
        <div class="label">资讯总数</div>
        <div class="num">{{ statData.newsTotal }}</div>
      </div>
      <div class="stat-card">
        <div class="label">部门数量</div>
        <div class="num">{{ statData.deptTotal }}</div>
      </div>
      <div class="stat-card">
        <div class="label">在线用户</div>
        <div class="num">{{ statData.onlineUser }}</div>
      </div>
    </div>

    <!-- 图表行 -->
    <div class="chart-row">
      <div class="chart-item">
        <div ref="barRef" class="chart"></div>
      </div>
      <div class="chart-item">
        <div ref="pieRef" class="chart"></div>
      </div>
    </div>
  </div>
</template>

<script setup>
import { ref, onMounted, onUnmounted, watch } from 'vue'
import { useRouter } from 'vue-router'
import * as echarts from 'echarts'
import axios from '@/api/request'

const router = useRouter()
const barRef = ref(null)
const pieRef = ref(null)
let barChart = null
let pieChart = null

// 统计数据
const statData = ref({
  userTotal: 0,
  newsTotal: 0,
  deptTotal: 0,
  onlineUser: 0
})

// 返回后台
const backAdmin = () => {
  router.push('/dashboard/dashboard')
}

// 获取大屏统计接口
const getCockpitStat = async () => {
  const res = await axios.get('/cockpit/getStat')
  if(res.code === 200) {
    statData.value = res.data
    renderChart()
  }
}

// 渲染图表
const renderChart = () => {
  // 柱状图
  barChart = echarts.init(barRef.value)
  barChart.setOption({
    title: { text: '月度用户增长', textStyle:{color:'#fff'} },
    tooltip: {},
    xAxis: {
      type: 'category',
      data: ['1月','2月','3月','4月','5月','6月'],
      axisLine:{lineStyle:{color:'#506688'}}
    },
    yAxis: {
      type: 'value',
      axisLine:{lineStyle:{color:'#506688'}},
      splitLine:{lineStyle:{color:'#273b60'}}
    },
    series: [{
      data: [80,120,95,160,210,240],
      type: 'bar',
      color: '#00bfff'
    }]
  })

  // 饼图
  pieChart = echarts.init(pieRef.value)
  pieChart.setOption({
    title: { text: '部门人员分布', textStyle:{color:'#fff'} },
    tooltip: {},
    series: [{
      type: 'pie',
      radius: '60%',
      data: [
        {value: 85, name:'研发部'},
        {value: 42, name:'运营部'},
        {value: 26, name:'市场部'},
        {value: 18, name:'行政部'}
      ]
    }]
  })
}

// 窗口大小变化自适应
const resizeHandler = () => {
  barChart?.resize()
  pieChart?.resize()
}

onMounted(() => {
  getCockpitStat()
  window.addEventListener('resize', resizeHandler)
})

// 销毁释放实例,防止内存泄漏
onUnmounted(() => {
  window.removeEventListener('resize', resizeHandler)
  barChart?.dispose()
  pieChart?.dispose()
})
</script>

<style scoped>
.cockpit-wrap {
  width: 100vw;
  height: 100vh;
  box-sizing: border-box;
  padding:20px;
  background-color: #091b39;
  color:#fff;
}
.back-btn {
  position: absolute;
  top:12px;
  right:20px;
  z-index:99;
}
.title {
  text-align:center;
  font-size:28px;
  margin:10px 0 30px;
}
.card-row {
  display: grid;
  grid-template-columns: repeat(4, 1fr);
  gap:16px;
  margin-bottom:20px;
}
.stat-card {
  background: rgba(30, 60, 110, 0.6);
  padding:20px;
  border-radius:8px;
  text-align:center;
}
.stat-card .label {
  font-size:16px;
  color:#a0b8e3;
}
.stat-card .num {
  font-size:32px;
  font-weight:bold;
  margin-top:8px;
}
.chart-row {
  display: grid;
  grid-template-columns: 1fr 1fr;
  gap:20px;
  height: calc(100% - 220px);
}
.chart-item {
  background: rgba(30, 60, 110, 0.6);
  border-radius:8px;
  padding:16px;
}
.chart {
  width:100%;
  height:100%;
}
</style>