💖💖作者:计算机毕业设计杰瑞
💙💙个人简介:曾长期从事计算机专业培训教学,本人也热爱上课教学,语言擅长Java、微信小程序、Python、Golang、安卓Android等,开发项目包括大数据、深度学习、网站、小程序、安卓、算法。平常会做一些项目定制化开发、代码讲解、答辩教学、文档编写、也懂一些降重方面的技巧。平常喜欢分享一些自己开发中遇到的问题的解决办法,也喜欢交流技术,大家有技术代码这一块的问题可以问我!
💛💛想说的话:感谢大家的关注与支持!
💜💜
目录
- 基于大数据的社交媒体用户行为数据分析与可视化介绍
- 基于大数据的社交媒体用户行为数据分析与可视化演示视频
- 基于大数据的社交媒体用户行为数据分析与可视化演示图片
- 基于大数据的社交媒体用户行为数据分析与可视化代码展示
- 基于大数据的社交媒体用户行为数据分析与可视化文档展示
基于大数据的社交媒体用户行为数据分析与可视化介绍
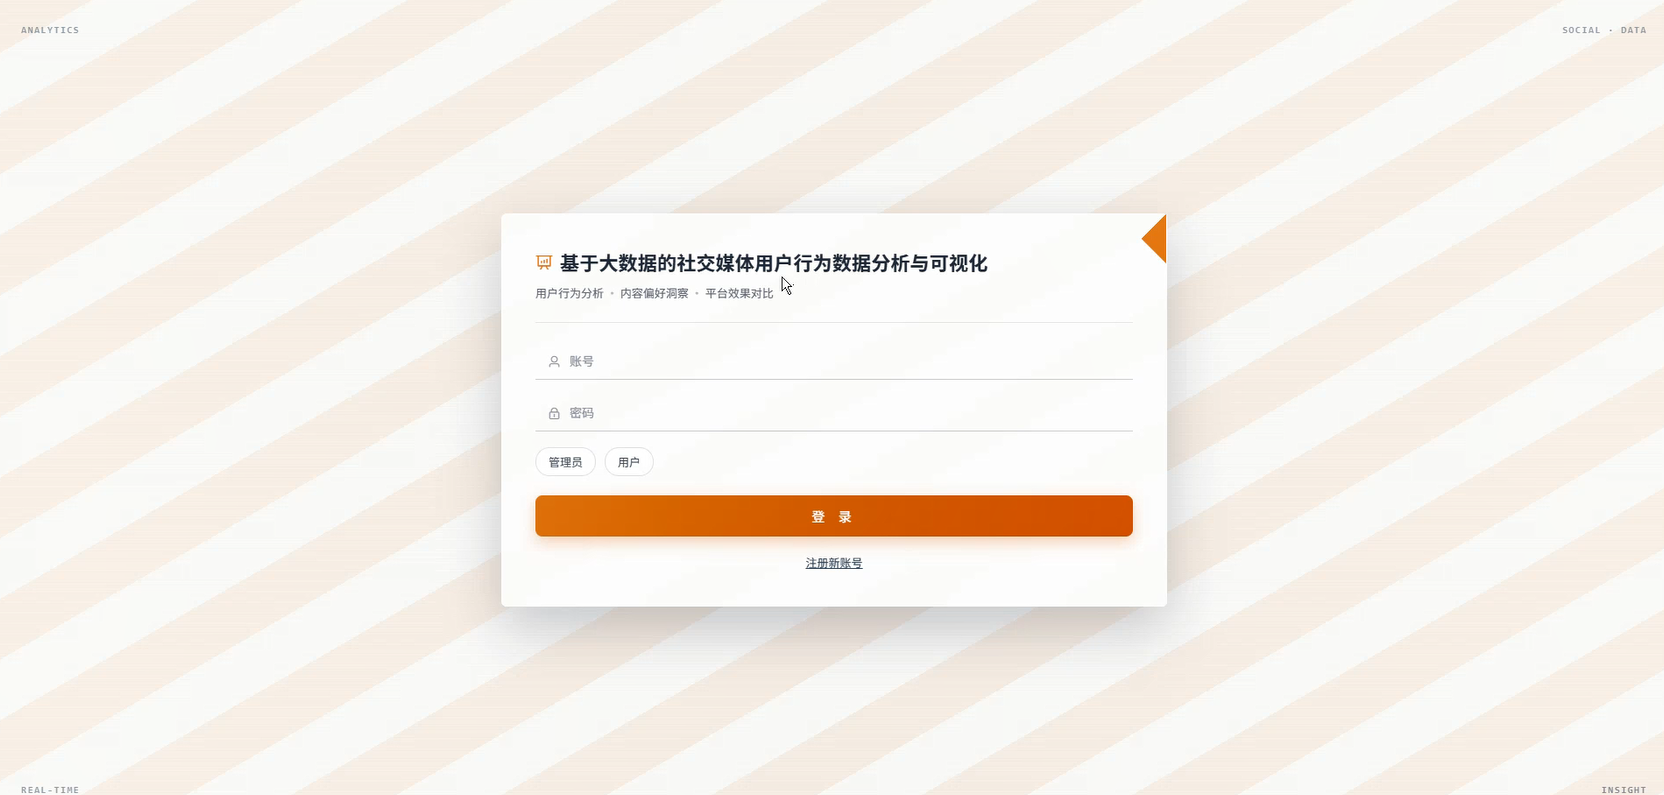
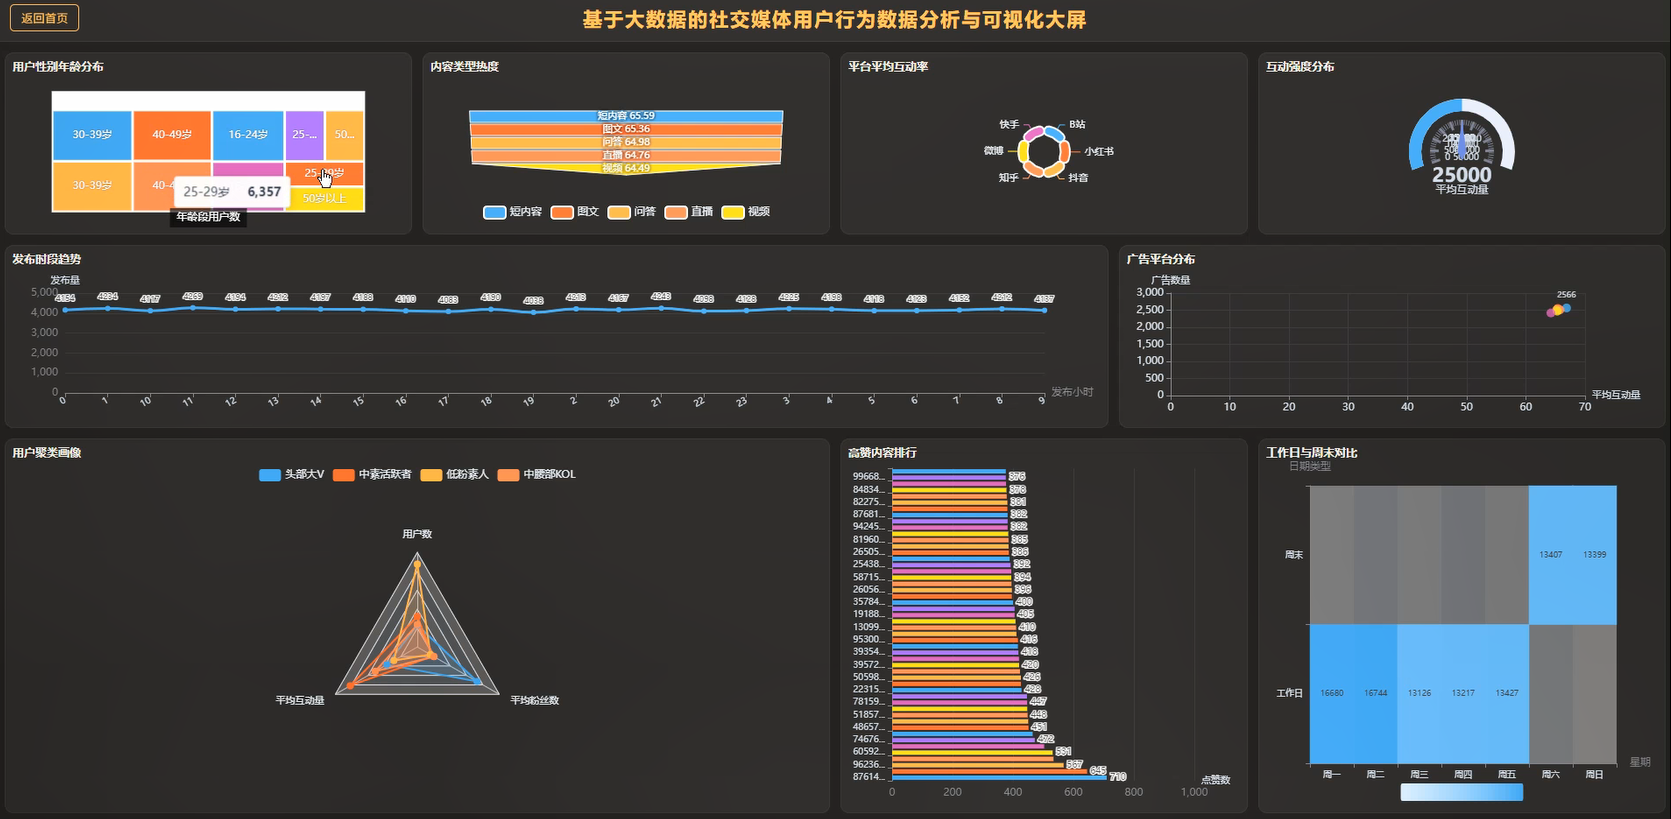
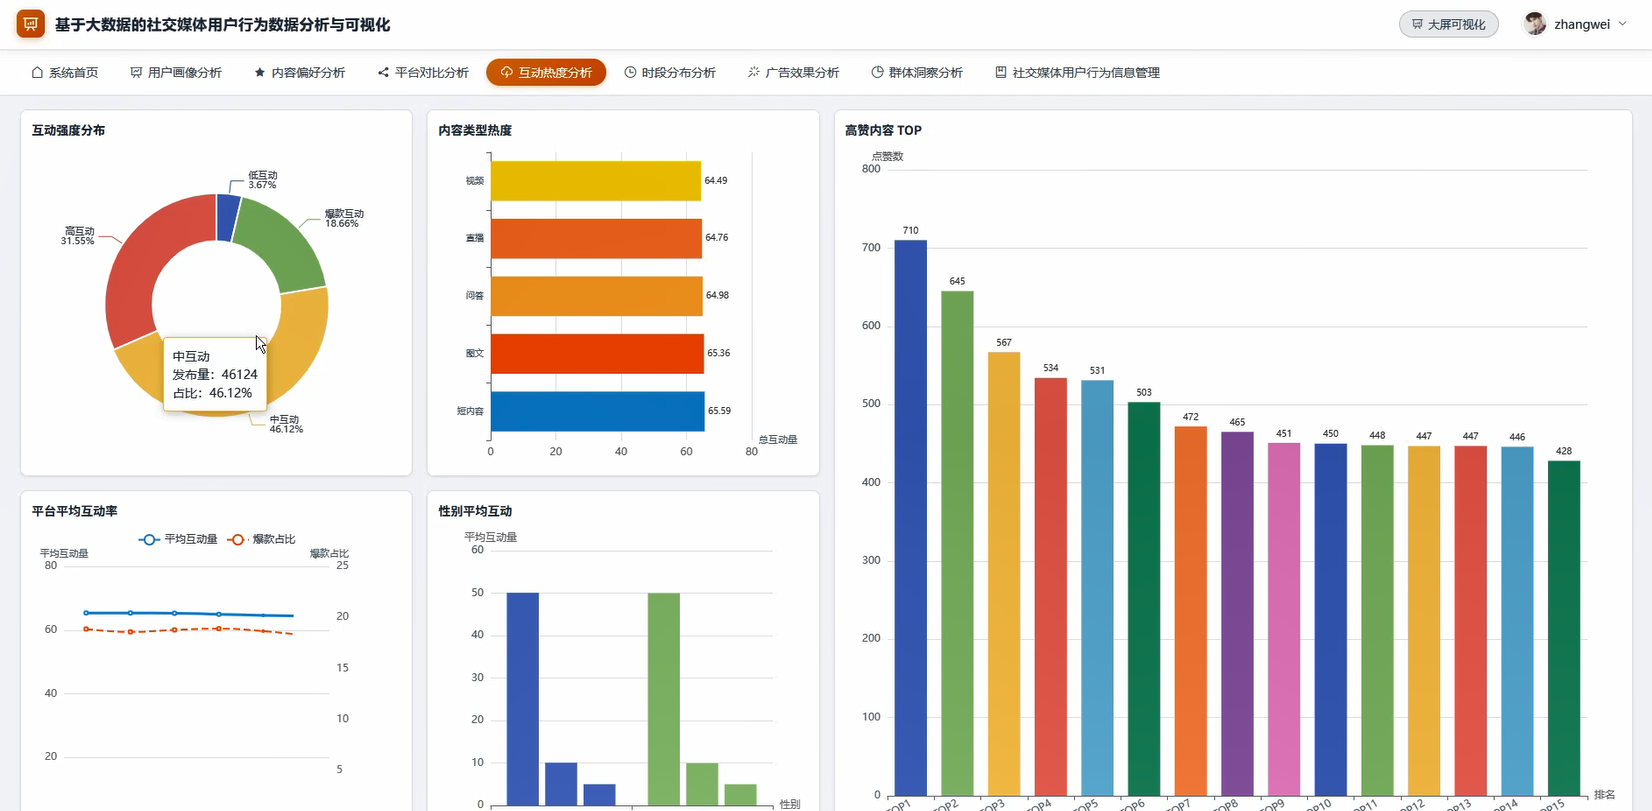
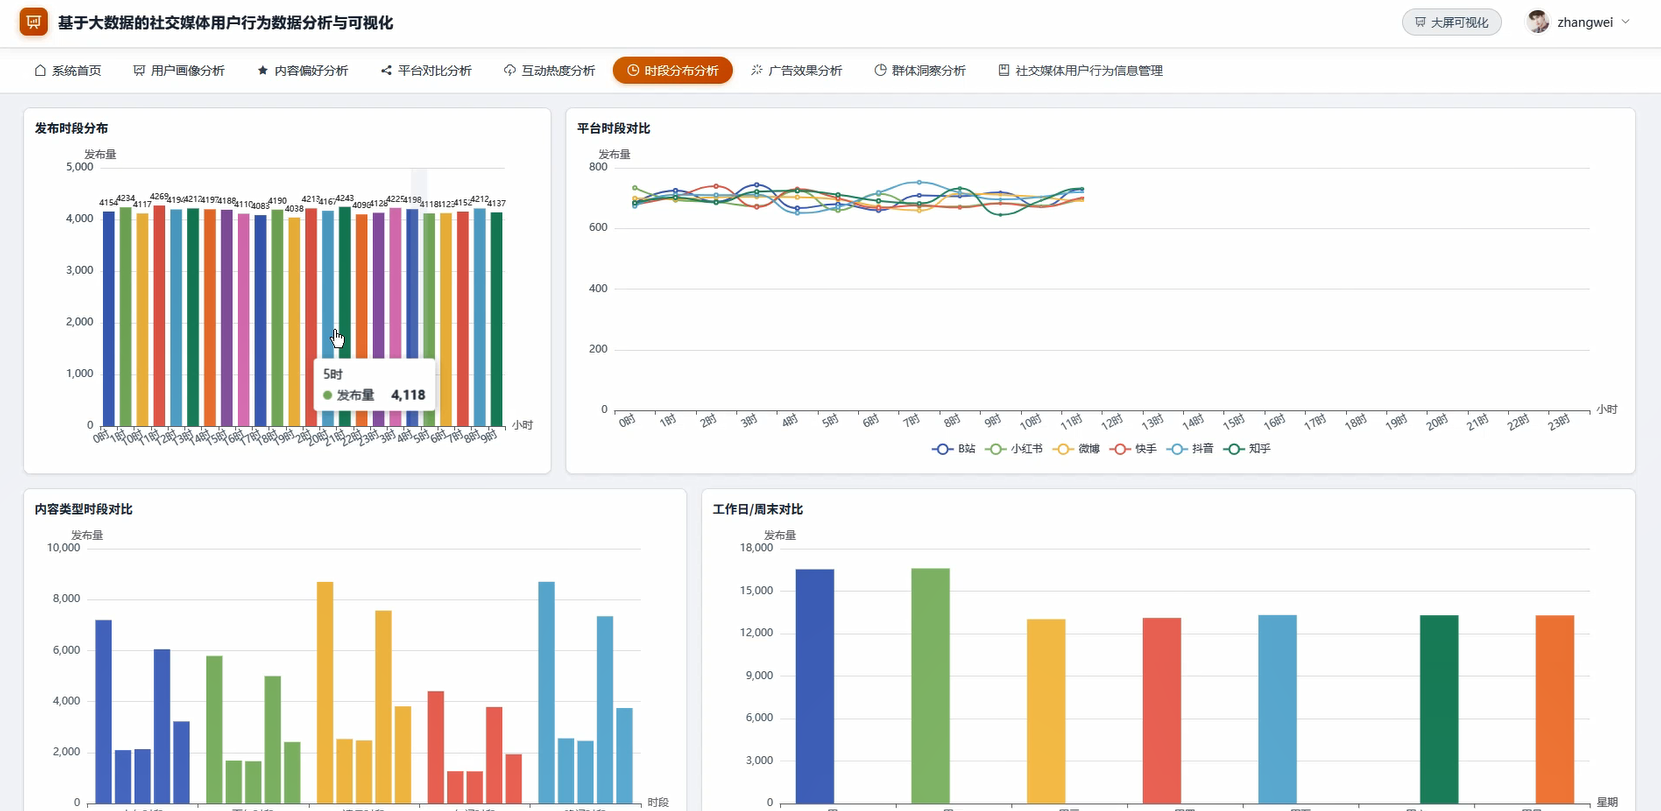
本系统名为《基于大数据的社交媒体用户行为数据分析与可视化》,主要面向社交媒体平台中产生的用户行为数据,借助Hadoop与Spark构建数据处理与分析流程,对用户画像、内容偏好、平台对比、互动热度、时段分布、广告效果以及群体洞察等维度进行统计分析与可视化展示。系统底层采用HDFS进行数据存储,使用Spark与Spark SQL完成数据清洗、聚合计算和指标提取,并结合Pandas、NumPy进行辅助处理,后端可基于Django或Spring Boot实现数据接口与业务逻辑,前端通过Vue、ElementUI与ECharts完成图表展示与交互呈现,数据库使用MySQL保存系统运行所需的基础信息与管理数据。整体上,系统围绕社交媒体用户行为信息管理与分析展开,既包含用户行为数据的采集与整理,也包含多维度分析结果的图表化表达,能够较完整地呈现从大数据处理到可视化展示的实现过程。
基于大数据的社交媒体用户行为数据分析与可视化演示视频
基于大数据的社交媒体用户行为数据分析与可视化演示图片
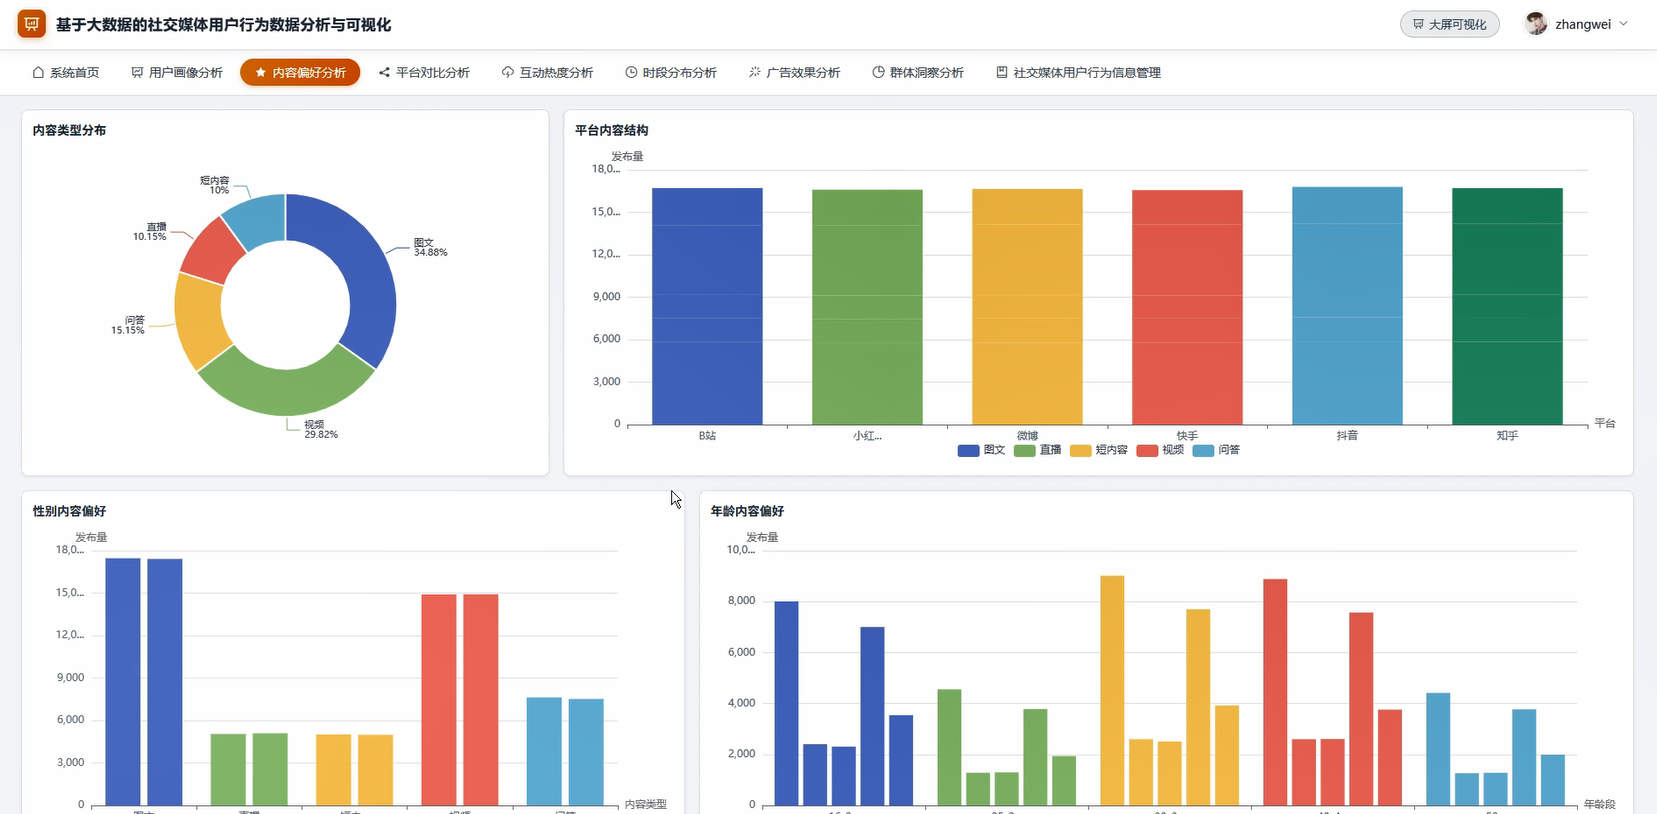
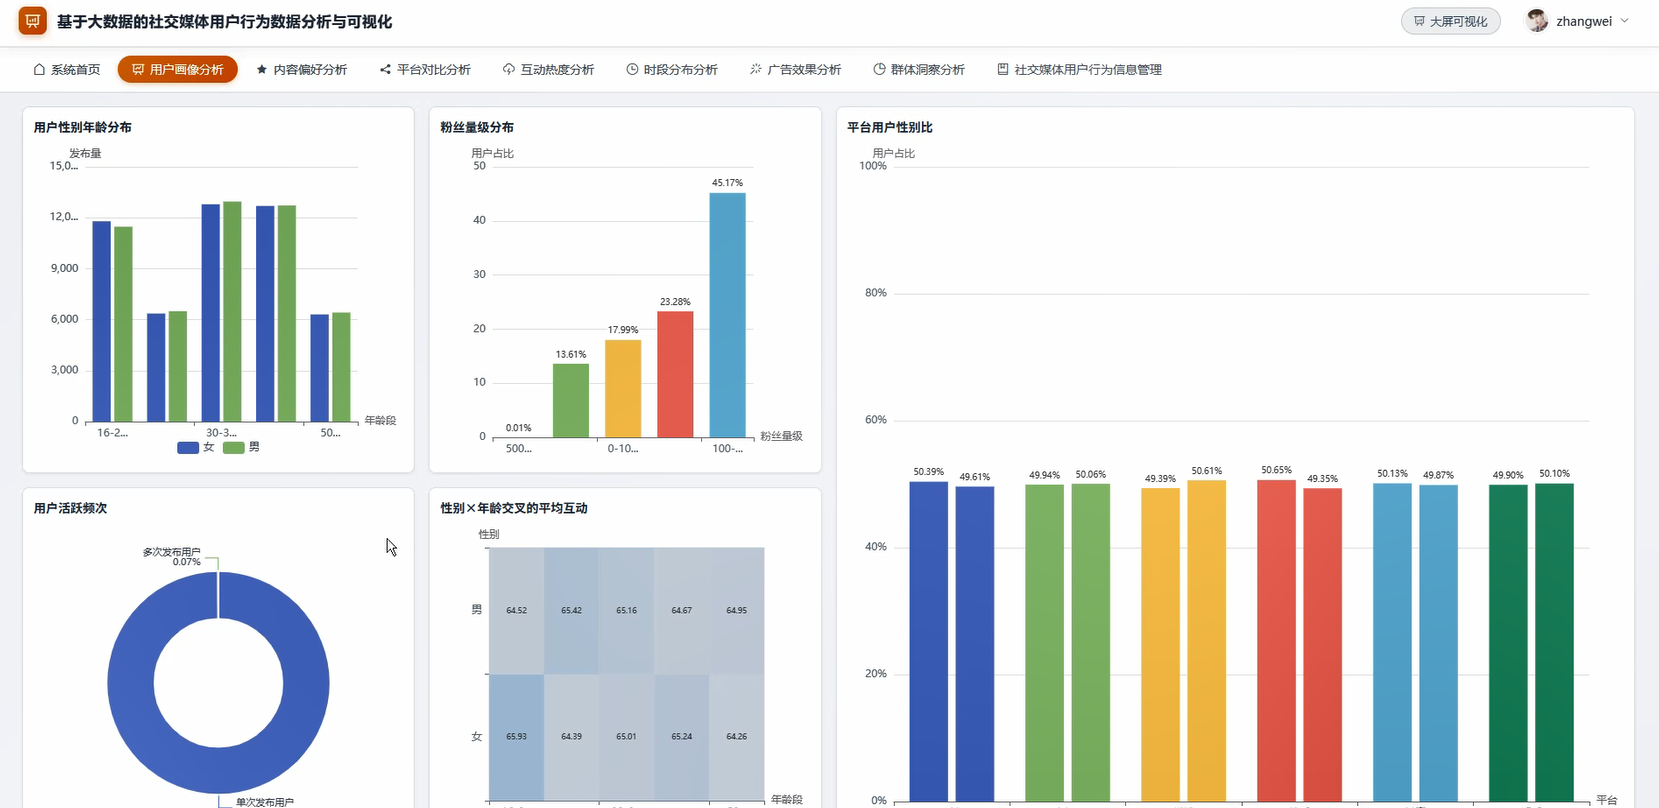
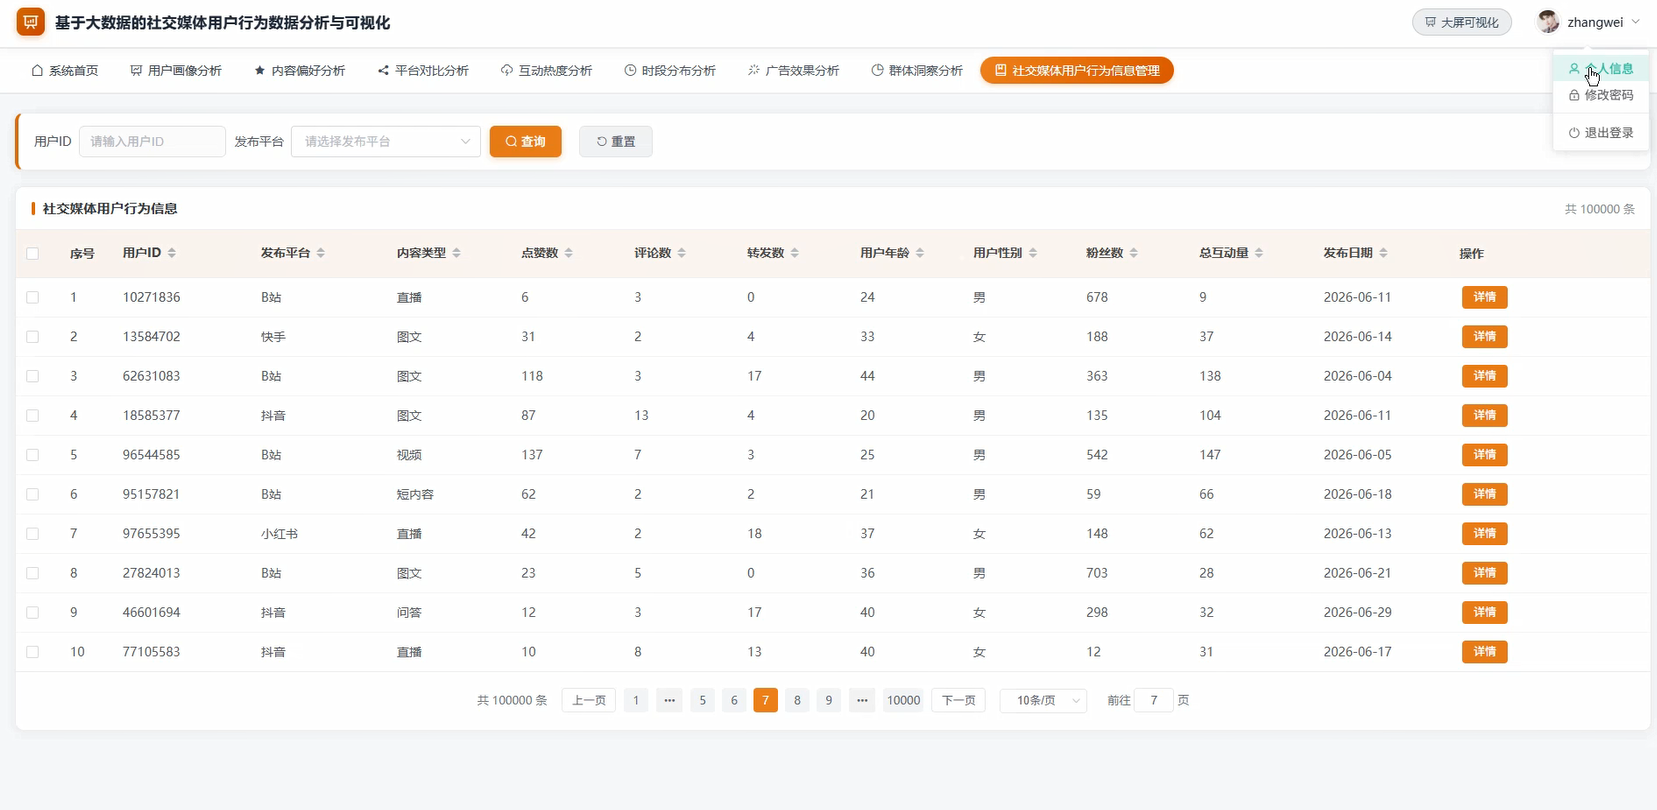
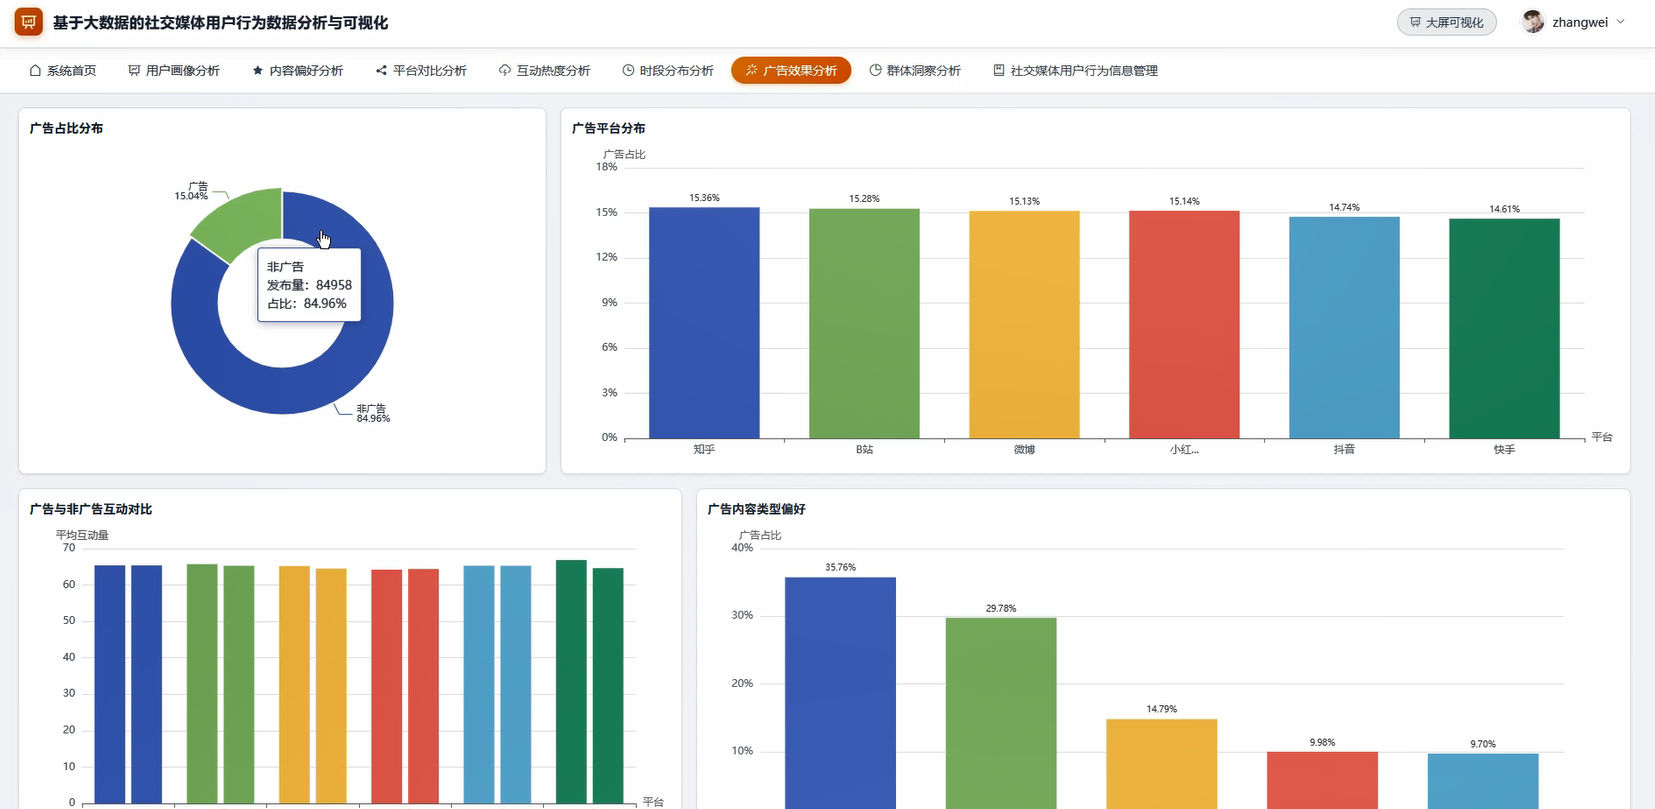
基于大数据的社交媒体用户行为数据分析与可视化代码展示
python
from pyspark.sql import SparkSession
from pyspark.sql.functions import col, count, when, hour, to_timestamp, avg, sum as spark_sum, desc

spark = SparkSession.builder.appName("SocialMediaUserBehaviorAnalysis").master("local[*]").getOrCreate()
behavior_df = spark.read.option("header", True).option("inferSchema", True).csv("hdfs://localhost:9000/social_media/behavior.csv")
behavior_df = behavior_df.withColumn("event_time", to_timestamp(col("event_time"), "yyyy-MM-dd HH:mm:ss"))
behavior_df = behavior_df.filter(col("user_id").isNotNull()).filter(col("event_type").isNotNull())
behavior_df.cache()

def analyze_user_profile(behavior_df):
    user_profile_df = behavior_df.groupBy("user_id").agg(
        count("*").alias("total_behavior_count"),
        spark_sum(when(col("event_type") == "like", 1).otherwise(0)).alias("like_count"),
        spark_sum(when(col("event_type") == "comment", 1).otherwise(0)).alias("comment_count"),
        spark_sum(when(col("event_type") == "share", 1).otherwise(0)).alias("share_count"),
        spark_sum(when(col("event_type") == "view", 1).otherwise(0)).alias("view_count")
    )
    user_profile_df = user_profile_df.withColumn(
        "interaction_score",
        col("like_count") * 1 + col("comment_count") * 3 + col("share_count") * 5 + col("view_count") * 0.2
    )
    user_profile_df = user_profile_df.withColumn(
        "active_level",
        when(col("interaction_score") >= 100, "高活跃")
        .when(col("interaction_score") >= 50, "中活跃")
        .otherwise("低活跃")
    )
    user_profile_df = user_profile_df.orderBy(desc("interaction_score"))
    user_profile_df.write.mode("overwrite").jdbc(
        "jdbc:mysql://localhost:3306/social_media_analysis", "user_profile_result",
        properties={"user": "root", "password": "123456", "driver": "com.mysql.cj.jdbc.Driver"}
    )
    return user_profile_df

def analyze_content_preference(behavior_df):
    content_df = behavior_df.groupBy("content_type", "event_type").agg(count("*").alias("event_count"))
    content_total_df = behavior_df.groupBy("content_type").agg(count("*").alias("total_count"))
    content_preference_df = content_df.join(content_total_df, on="content_type", how="left")
    content_preference_df = content_preference_df.withColumn(
        "event_ratio", col("event_count") / col("total_count")
    )
    content_preference_df = content_preference_df.withColumn(
        "preference_weight",
        when(col("event_type") == "like", col("event_ratio") * 1)
        .when(col("event_type") == "comment", col("event_ratio") * 3)
        .when(col("event_type") == "share", col("event_ratio") * 5)
        .otherwise(col("event_ratio") * 0.2)
    )
    content_result_df = content_preference_df.groupBy("content_type").agg(
        spark_sum("event_count").alias("total_event_count"),
        spark_sum("preference_weight").alias("preference_score")
    )
    content_result_df = content_result_df.orderBy(desc("preference_score"))
    content_result_df.write.mode("overwrite").jdbc(
        "jdbc:mysql://localhost:3306/social_media_analysis", "content_preference_result",
        properties={"user": "root", "password": "123456", "driver": "com.mysql.cj.jdbc.Driver"}
    )
    return content_result_df

def analyze_time_distribution(behavior_df):
    time_df = behavior_df.withColumn("event_hour", hour(col("event_time")))
    hour_distribution_df = time_df.groupBy("event_hour").agg(
        count("*").alias("behavior_count"),
        spark_sum(when(col("event_type") == "like", 1).otherwise(0)).alias("like_count"),
        spark_sum(when(col("event_type") == "comment", 1).otherwise(0)).alias("comment_count"),
        spark_sum(when(col("event_type") == "share", 1).otherwise(0)).alias("share_count")
    )
    hour_distribution_df = hour_distribution_df.withColumn(
        "time_period",
        when((col("event_hour") >= 6) & (col("event_hour") < 12), "上午")
        .when((col("event_hour") >= 12) & (col("event_hour") < 18), "下午")
        .when((col("event_hour") >= 18) & (col("event_hour") < 24), "晚上")
        .otherwise("凌晨")
    )
    period_summary_df = hour_distribution_df.groupBy("time_period").agg(
        spark_sum("behavior_count").alias("period_behavior_count"),
        spark_sum("like_count").alias("period_like_count"),
        spark_sum("comment_count").alias("period_comment_count"),
        spark_sum("share_count").alias("period_share_count")
    )
    period_summary_df = period_summary_df.orderBy(desc("period_behavior_count"))
    period_summary_df.write.mode("overwrite").jdbc(
        "jdbc:mysql://localhost:3306/social_media_analysis", "time_distribution_result",
        properties={"user": "root", "password": "123456", "driver": "com.mysql.cj.jdbc.Driver"}
    )
    return period_summary_df

user_profile_result = analyze_user_profile(behavior_df)
content_preference_result = analyze_content_preference(behavior_df)
time_distribution_result = analyze_time_distribution(behavior_df)
user_profile_result.show(10, truncate=False)
content_preference_result.show(10, truncate=False)
time_distribution_result.show(10, truncate=False)
spark.stop()
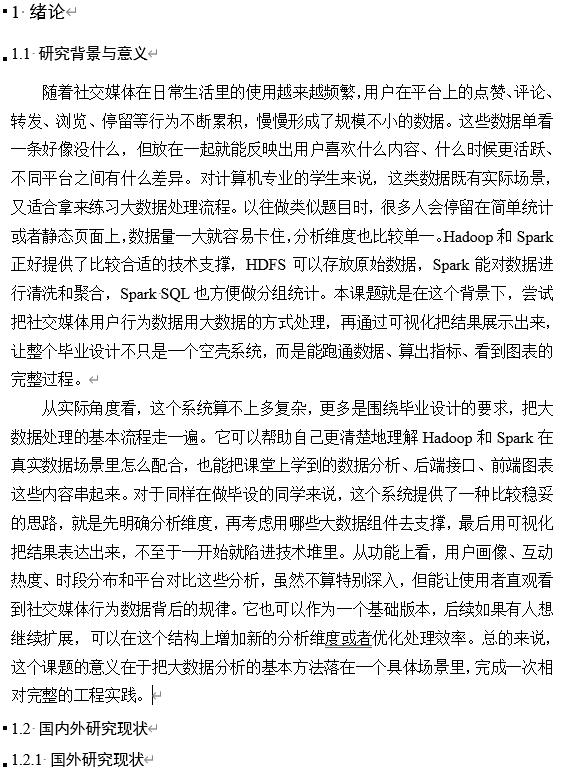
基于大数据的社交媒体用户行为数据分析与可视化文档展示
💖💖作者:计算机毕业设计杰瑞
💙💙个人简介:曾长期从事计算机专业培训教学,本人也热爱上课教学,语言擅长Java、微信小程序、Python、Golang、安卓Android等,开发项目包括大数据、深度学习、网站、小程序、安卓、算法。平常会做一些项目定制化开发、代码讲解、答辩教学、文档编写、也懂一些降重方面的技巧。平常喜欢分享一些自己开发中遇到的问题的解决办法,也喜欢交流技术,大家有技术代码这一块的问题可以问我!
💛💛想说的话:感谢大家的关注与支持!
💜💜