文章目录
- [1. 前言](#1. 前言)
- [2. 前置工作](#2. 前置工作)
- [3. 代码](#3. 代码)
-
- [3.1 metrics.go](#3.1 metrics.go)
- [3.2 main 方法](#3.2 main 方法)
- [3.3 项目启动](#3.3 项目启动)
- [4. 小结](#4. 小结)
1. 前言
最近工作开发的时候经常用到指标监控,一般来说线上都会有调用链监控,但是对比起来还是指标监控好用,最重要的就是 支持 PromQL 语法,有了语法就能查询出各种各样的指标,比如 每秒 QPS、每分钟最大耗时... 各种指标,线上用的最多就是就是用来监控发送量、QPS,下面来学习下 prometheus。
2. 前置工作
首先要下载一个 Windows Prometheus,这个工具是用来监控指标的,当然用 go sdk 之后也可以在本地启动 http 接口查看指标,但是查看的指标都是瞬时值,也就是没有成图表,这个工具就是用来看图表的。
要下载可以到这个网站去下载:https://prometheus.ac.cn/download/,但是这个网站下载的太慢了,我下载的时候速度基本是 几kb/s,所以直接问豆包,让豆包给一个百度网盘的地址来下载。

下载下来之后,解压到 英文路径下 ,别中文路径,然后修改 prometheus.yml。
yml
global:
  scrape_interval: 15s

scrape_configs:
  - job_name: 'prometheus'
    static_configs:
      - targets: ['127.0.0.1:8088']
来解释下,上面配置的意思就是 prometheus 会每隔 15s 到本地拉取一次指标,没有配置 metrics_path,那么默认会访问 http://127.0.0.1:8088/metrics 端口,所以我们在项目里面也要暴露 metrics 端口方便指标拉取。
接下来到解压目录下创建一个 bat 执行文件 prometheus.bat。
bat
@echo off
chcp 65001
title Prometheus监控服务
:: 切换到当前脚本所在目录
cd /d %~dp0
echo 正在启动 Prometheus...
prometheus.exe --config.file=prometheus.yml
pause
这个脚本很简单,核心就是调用 prometheus.exe --config.file=prometheus.yml 这行命令启动 prometheus,启动之后通过 127.0.0.1:9090打开网站,prometheus 默认监听 9090 端口。
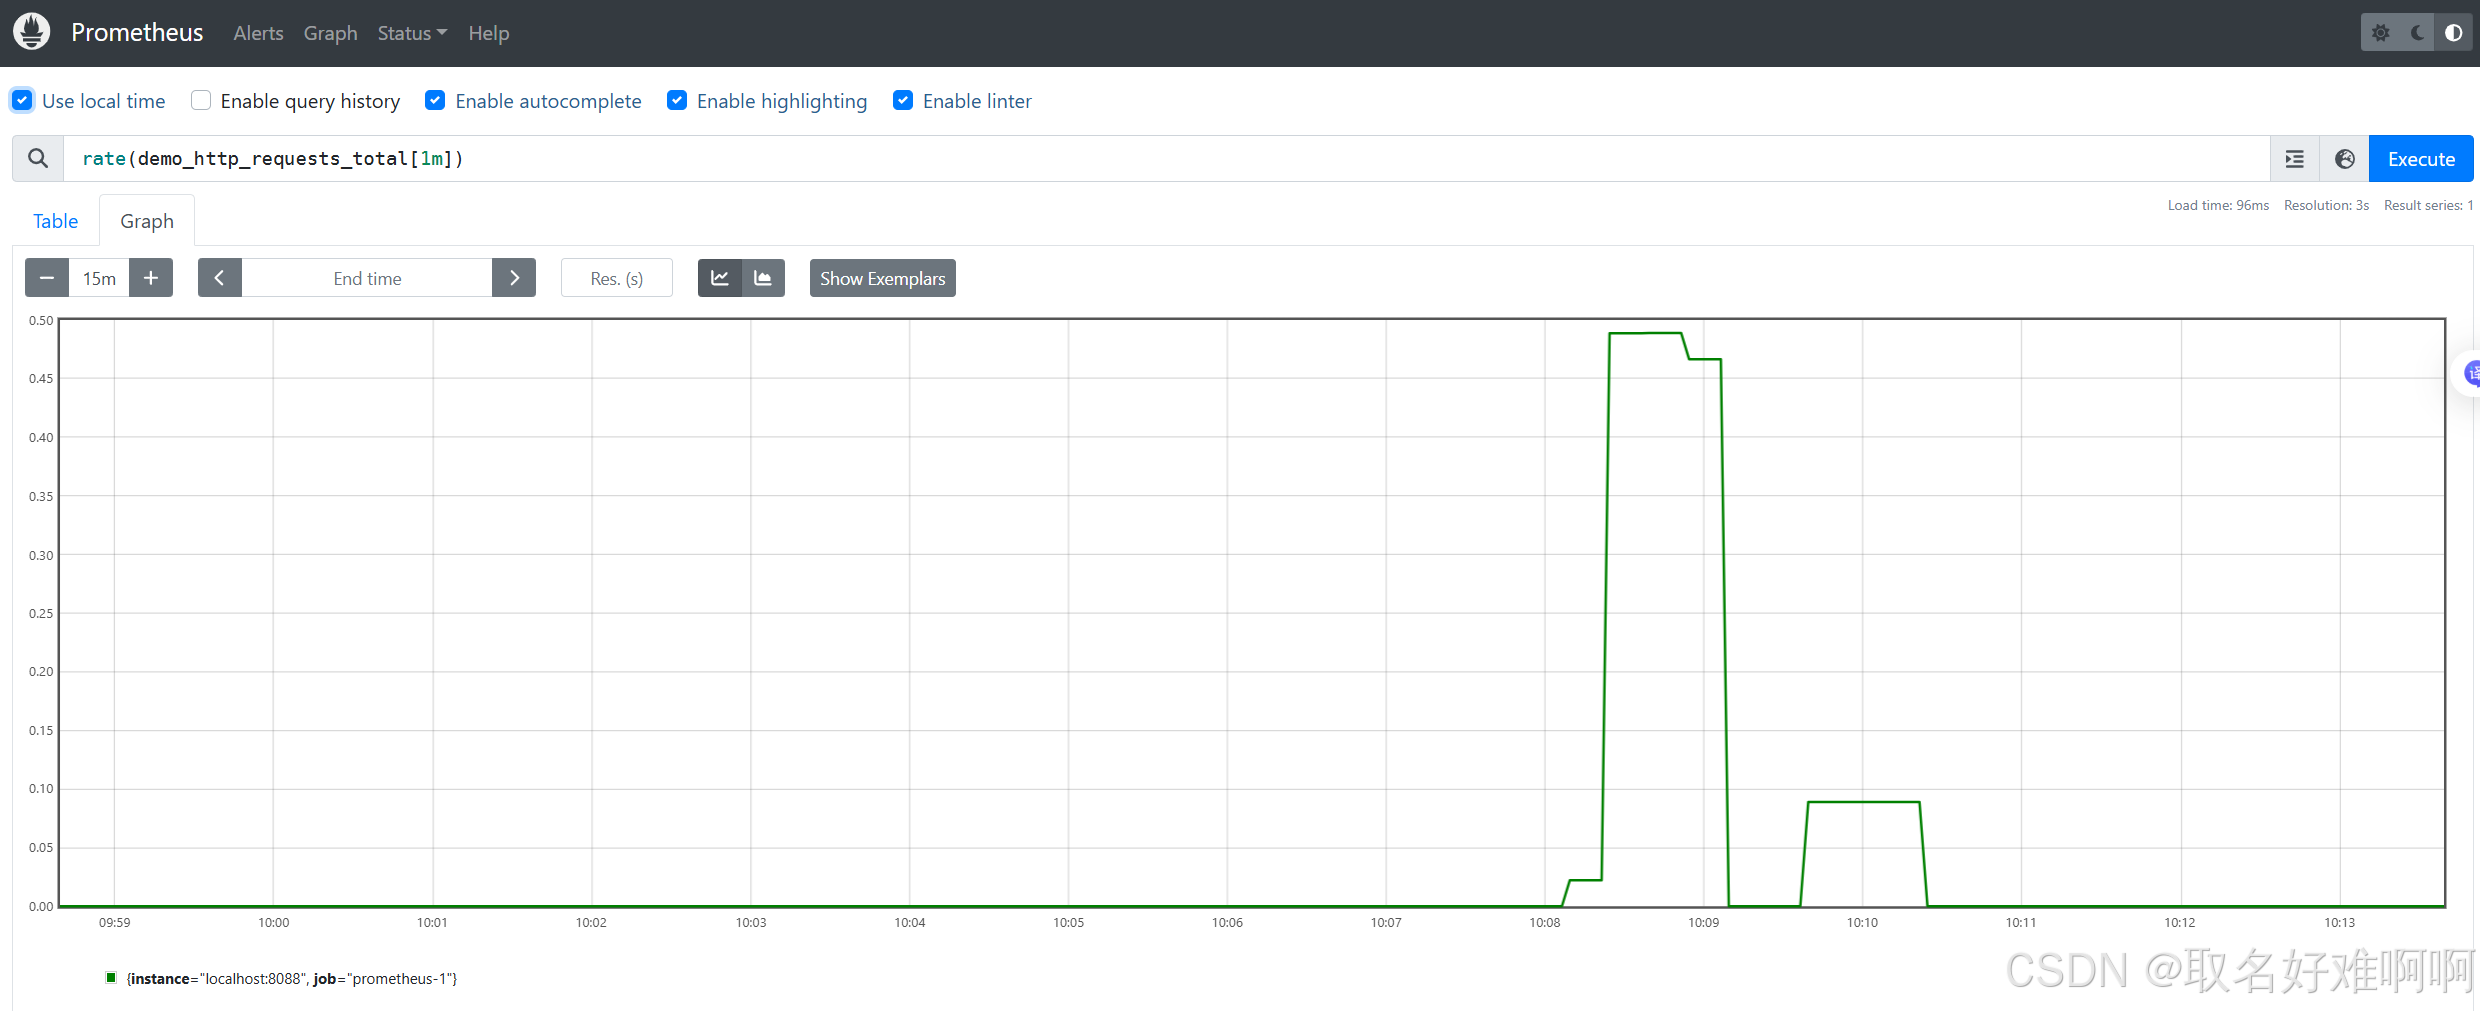
注意把左上角的 Use local time 点上,不然时间不对,得 +8。
3. 代码
好了,上面准备好 prometheus 之后,下面就是具体代码,引入 github.com/prometheus/client_golang v1.20.5 这个关键包,然后看下下面几个方法:
| 方法 | 指标类型 | 用法 |
|---|---|---|
prometheus.NewCounter(...) |
Counter | 用于只增不减的累计值,比如请求总数、错误总数、处理总数 |
prometheus.NewGauge(...) |
Gauge | 用于可增可减的当前值,比如并发请求数、活跃用户数、队列深度 |
prometheus.NewHistogram(...) |
Histogram | 用于统计耗时、大小等分布数据 |
prometheus.NewHistogramVec(...) |
HistogramVec | 用于按标签维度统计耗时、大小等分布数据 |
prometheus.NewRegistry() |
Registry | 用于创建自定义注册表,并统一注册和暴露指标 |
这几个方法中前 4 个就是创建指标,最后一个是创建注册表,用于注册指标同时暴露指标给上面的 prometheus 组件读取。
3.1 metrics.go
下面看下这个文件,这个文件就是用来初始化指标的,先来看下指标。
go
type Registry struct {
	RequestsTotal           prometheus.Counter
	RequestDuration         prometheus.Histogram
	RequestDurationByMethod *prometheus.HistogramVec
	InFlightRequests        prometheus.Gauge
	JobLastRunTimestamp     prometheus.Gauge
	JobRunTotal             prometheus.Counter
	JobFailureTotal         prometheus.Counter
	ActiveUsers             prometheus.Gauge
	queueDepth              prometheus.Gauge
	queueProcessedTotal     prometheus.Counter
	registry                *prometheus.Registry
	// 启动时间
	startedAt               int64
}
然后就是这些指标的初始化。
go
func NewRegistry() *Registry {
	reg := prometheus.NewRegistry()
	r := &Registry{
		// RequestsTotal 统计服务处理过的 HTTP 请求总数
		RequestsTotal: prometheus.NewCounter(prometheus.CounterOpts{
			Name: "demo_http_requests_total",
			Help: "Total number of HTTP requests handled by the demo service.",
		}),
		// RequestDuration 统计所有 HTTP 请求的耗时分布
		RequestDuration: prometheus.NewHistogram(prometheus.HistogramOpts{
			Name:    "demo_http_request_duration_seconds",
			Help:    "HTTP request duration in seconds.",
			Buckets: prometheus.DefBuckets,
		}),
		// RequestDurationByMethod 按请求方法统计 HTTP 请求耗时分布
		RequestDurationByMethod: prometheus.NewHistogramVec(
			prometheus.HistogramOpts{
				Name:    "demo_http_request_duration_by_method_seconds",
				Help:    "HTTP request duration in seconds partitioned by request method.",
				Buckets: prometheus.DefBuckets,
			},
			[]string{"method"},
		),
		// InFlightRequests 统计当前正在处理中的请求数
		InFlightRequests: prometheus.NewGauge(prometheus.GaugeOpts{
			Name: "demo_http_in_flight_requests",
			Help: "Current number of in-flight requests.",
		}),
		// JobLastRunTimestamp 记录后台任务最近一次执行的时间戳
		JobLastRunTimestamp: prometheus.NewGauge(prometheus.GaugeOpts{
			Name: "demo_job_last_run_timestamp_seconds",
			Help: "Unix timestamp of the last background job run.",
		}),
		// JobRunTotal 统计后台任务执行的总次数
		JobRunTotal: prometheus.NewCounter(prometheus.CounterOpts{
			Name: "demo_job_runs_total",
			Help: "Total number of background job runs.",
		}),
		// JobFailureTotal 统计后台任务执行失败的总次数
		JobFailureTotal: prometheus.NewCounter(prometheus.CounterOpts{
			Name: "demo_job_failures_total",
			Help: "Total number of simulated background job failures.",
		}),
		// ActiveUsers 表示当前模拟的活跃用户数
		ActiveUsers: prometheus.NewGauge(prometheus.GaugeOpts{
			Name: "demo_active_users",
			Help: "Current simulated active users.",
		}),
		// queueDepth 表示当前模拟的队列积压深度
		queueDepth: prometheus.NewGauge(prometheus.GaugeOpts{
			Name: "demo_queue_depth",
			Help: "Current simulated queue depth.",
		}),
		// queueProcessedTotal 统计队列累计处理完成的任务数
		queueProcessedTotal: prometheus.NewCounter(prometheus.CounterOpts{
			Name: "demo_queue_processed_total",
			Help: "Total number of simulated queue items processed.",
		}),
		registry:  reg,
		startedAt: time.Now().Unix(),
	}

	reg.MustRegister(
		r.RequestsTotal,
		r.RequestDuration,
		r.RequestDurationByMethod,
		r.InFlightRequests,
		r.JobLastRunTimestamp,
		r.JobRunTotal,
		r.JobFailureTotal,
		r.ActiveUsers,
		r.queueDepth,
		r.queueProcessedTotal,
	)

	return r
}
上面就是初始化指标的代码,里面的属性先不解释,最终指标注册到注册中心是通过 MustRegister 方法批量注册的,下面看下这些指标的更新。
go
// ObserveRequest 请求统计增加
func (r *Registry) ObserveRequest(duration time.Duration) {
	// 总请求数 + 1
	r.RequestsTotal.Inc()
	// 请求耗时
	r.RequestDuration.Observe(duration.Seconds())
}

// ObserveRequestByMethod 统计每个方法的耗时
func (r *Registry) ObserveRequestByMethod(method string, duration time.Duration) {
	r.RequestDurationByMethod.WithLabelValues(method).Observe(duration.Seconds())
}

// SetActiveUsers 设置当前活跃的用户
func (r *Registry) SetActiveUsers(n int) {
	r.ActiveUsers.Set(float64(n))
}

// SetQueueDepth 设置当前队列里还堆着多少任务没处理
func (r *Registry) SetQueueDepth(n int) {
	r.queueDepth.Set(float64(n))
}

// AddProcessedQueue 设置队列累积完成的任务数
func (r *Registry) AddProcessedQueue(n int) {
	r.queueProcessedTotal.Add(float64(n))
}

// MarkJobRun
func (r *Registry) MarkJobRun(success bool) {
	// 定时任务执行次数
	r.JobRunTotal.Inc()
	// 定时任务上一次执行的时间
	r.JobLastRunTimestamp.Set(float64(time.Now().Unix()))
	if !success {
		// 定时任务执行失败的次数
		r.JobFailureTotal.Inc()
	}
}

func (r *Registry) StartedAt() int64 {
	return atomic.LoadInt64(&r.startedAt)
}

func (r *Registry) RouteCount(count int) string {
	return strconv.Itoa(count)
}
最后就是 metrics 路径的处理器,也就是 prometheus 读取本地指标接口的处理器。
go
func (r *Registry) Handler() http.Handler {
	return promhttp.HandlerFor(r.registry, promhttp.HandlerOpts{})
}
3.2 main 方法
go
package main

import (
	"fmt"
	"log"
	"math/rand"
	"net/http"
	"time"

	"example.com/prometheus-1/metrics"
)

func main() {
	r := metrics.NewRegistry()
	// 模拟后台定时任务
	go runBackgroundJob(r)

	// 收到请求就调用下面的来处理
	http.HandleFunc("/", func(w http.ResponseWriter, req *http.Request) {
		// 当前时间
		start := time.Now()
		// 当前正在处理的请求数 + 1
		r.InFlightRequests.Inc()
		defer func() {
			// 当前正在处理的请求数 -1
			r.InFlightRequests.Dec()
			// 方法耗时
			duration := time.Since(start)
			// 已经处理的请求数 + 1
			r.ObserveRequest(duration)
			// 统计已经处理过的方法请求耗时
			r.ObserveRequestByMethod(req.Method, duration)
		}()

		// 模拟当前活跃用户数
		users := 50 + rand.Intn(200)
		queue := rand.Intn(100)
		r.SetActiveUsers(users)
		r.SetQueueDepth(queue)
		// 模拟设置队列累积完成的任务数
		r.AddProcessedQueue(1 + rand.Intn(8))

		_, _ = fmt.Fprintf(w, "hello prometheus, users=%d queue=%d\n", users, queue)
	})

	http.HandleFunc("/work", func(w http.ResponseWriter, req *http.Request) {
		// 当前时间
		start := time.Now()
		// 当前正在处理的请求数 + 1
		r.InFlightRequests.Inc()
		defer func() {
			r.InFlightRequests.Dec()
			duration := time.Since(start)
			r.ObserveRequest(duration)
			r.ObserveRequestByMethod(req.Method, duration)
		}()

		cost := 20 + rand.Intn(80)
		time.Sleep(time.Duration(cost) * time.Millisecond)
		r.SetActiveUsers(100 + rand.Intn(300))
		r.SetQueueDepth(rand.Intn(50))
		r.AddProcessedQueue(5)

		_, _ = fmt.Fprintf(w, "work done, cost=%dms\n", cost)
	})

	http.HandleFunc("/healthz", func(w http.ResponseWriter, req *http.Request) {
		_, _ = w.Write([]byte("ok"))
	})

	http.Handle("/metrics", r.Handler())

	addr := ":8088"
	log.Printf("prometheus-1 listening on %s", addr)
	log.Printf("metrics endpoint: http://127.0.0.1%s/metrics", addr)
	log.Fatal(http.ListenAndServe(addr, nil))
}

func runBackgroundJob(r *metrics.Registry) {
	ticker := time.NewTicker(5 * time.Second)
	defer ticker.Stop()

	for range ticker.C {
		success := rand.Intn(10) != 0
		r.MarkJobRun(success)
	}
}

func init() {
	rand.Seed(time.Now().UnixNano())
}
3.3 项目启动
接下来启动项目,输出如下。
go
2026/05/16 00:06:08 prometheus-1 listening on :8088
2026/05/16 00:06:08 metrics endpoint: http://127.0.0.1:8088/metrics
我们在浏览器输入 http://127.0.0.1:8088/metrics 可以访问到指标。
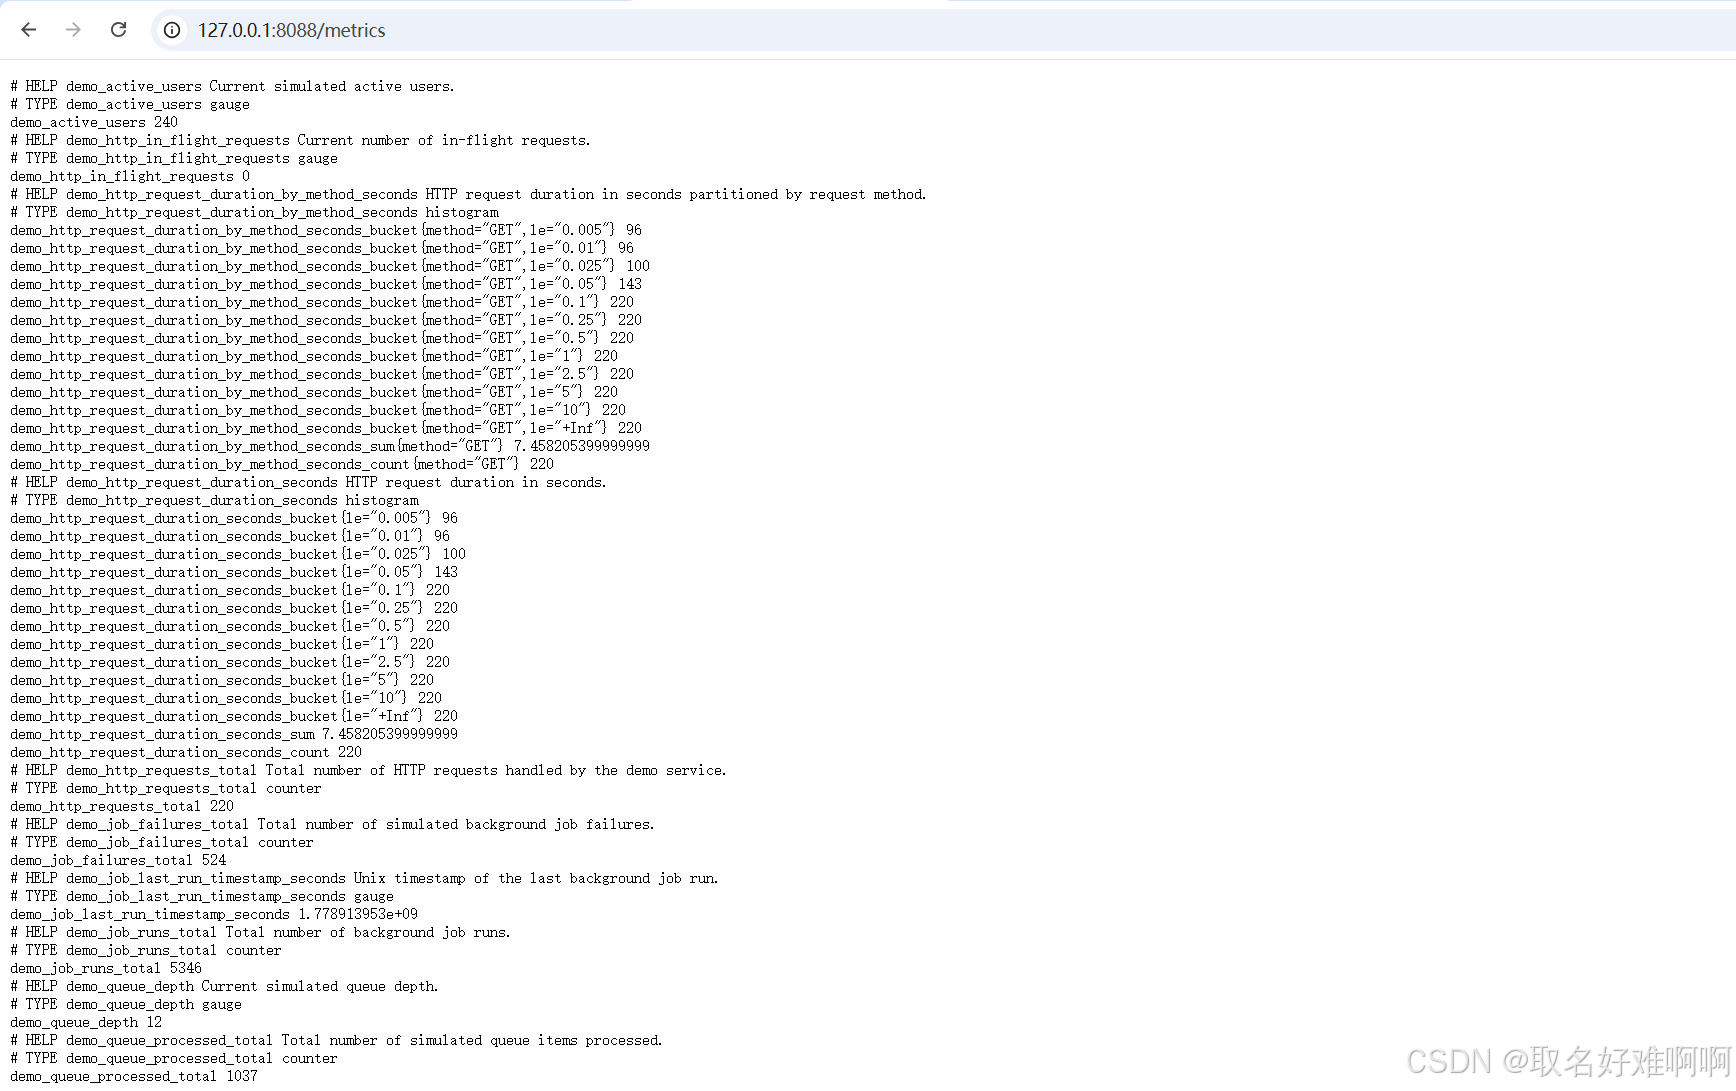
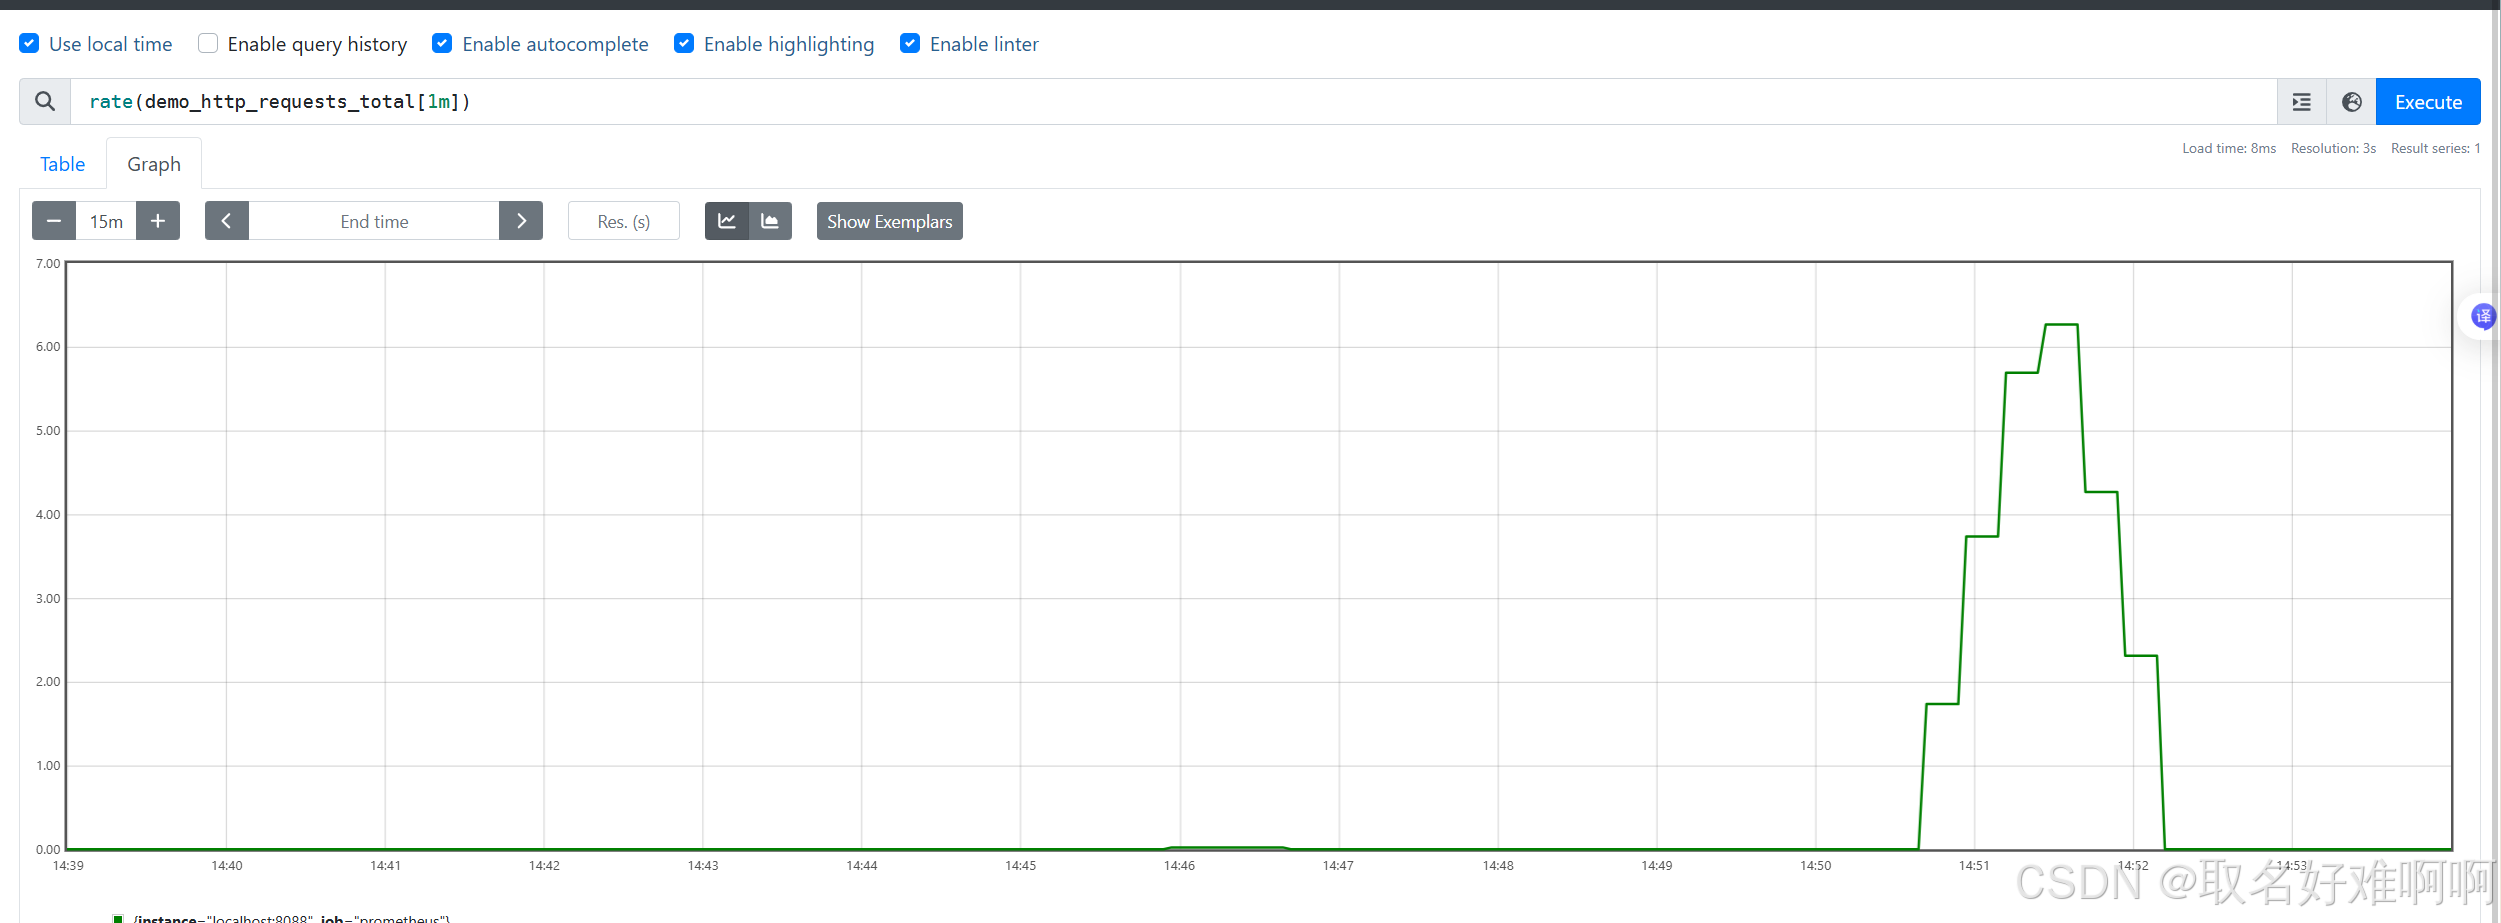
接下来我们访问 http://localhost:8088/work 接口以及 http://localhost:8088,然后在 prometheus 界面查看指标,下面随便找几个指标来看,首先是 rate(demo_http_requests_total[1m]),这个指标用于计算每秒的请求量,rate 就是平均的意思。
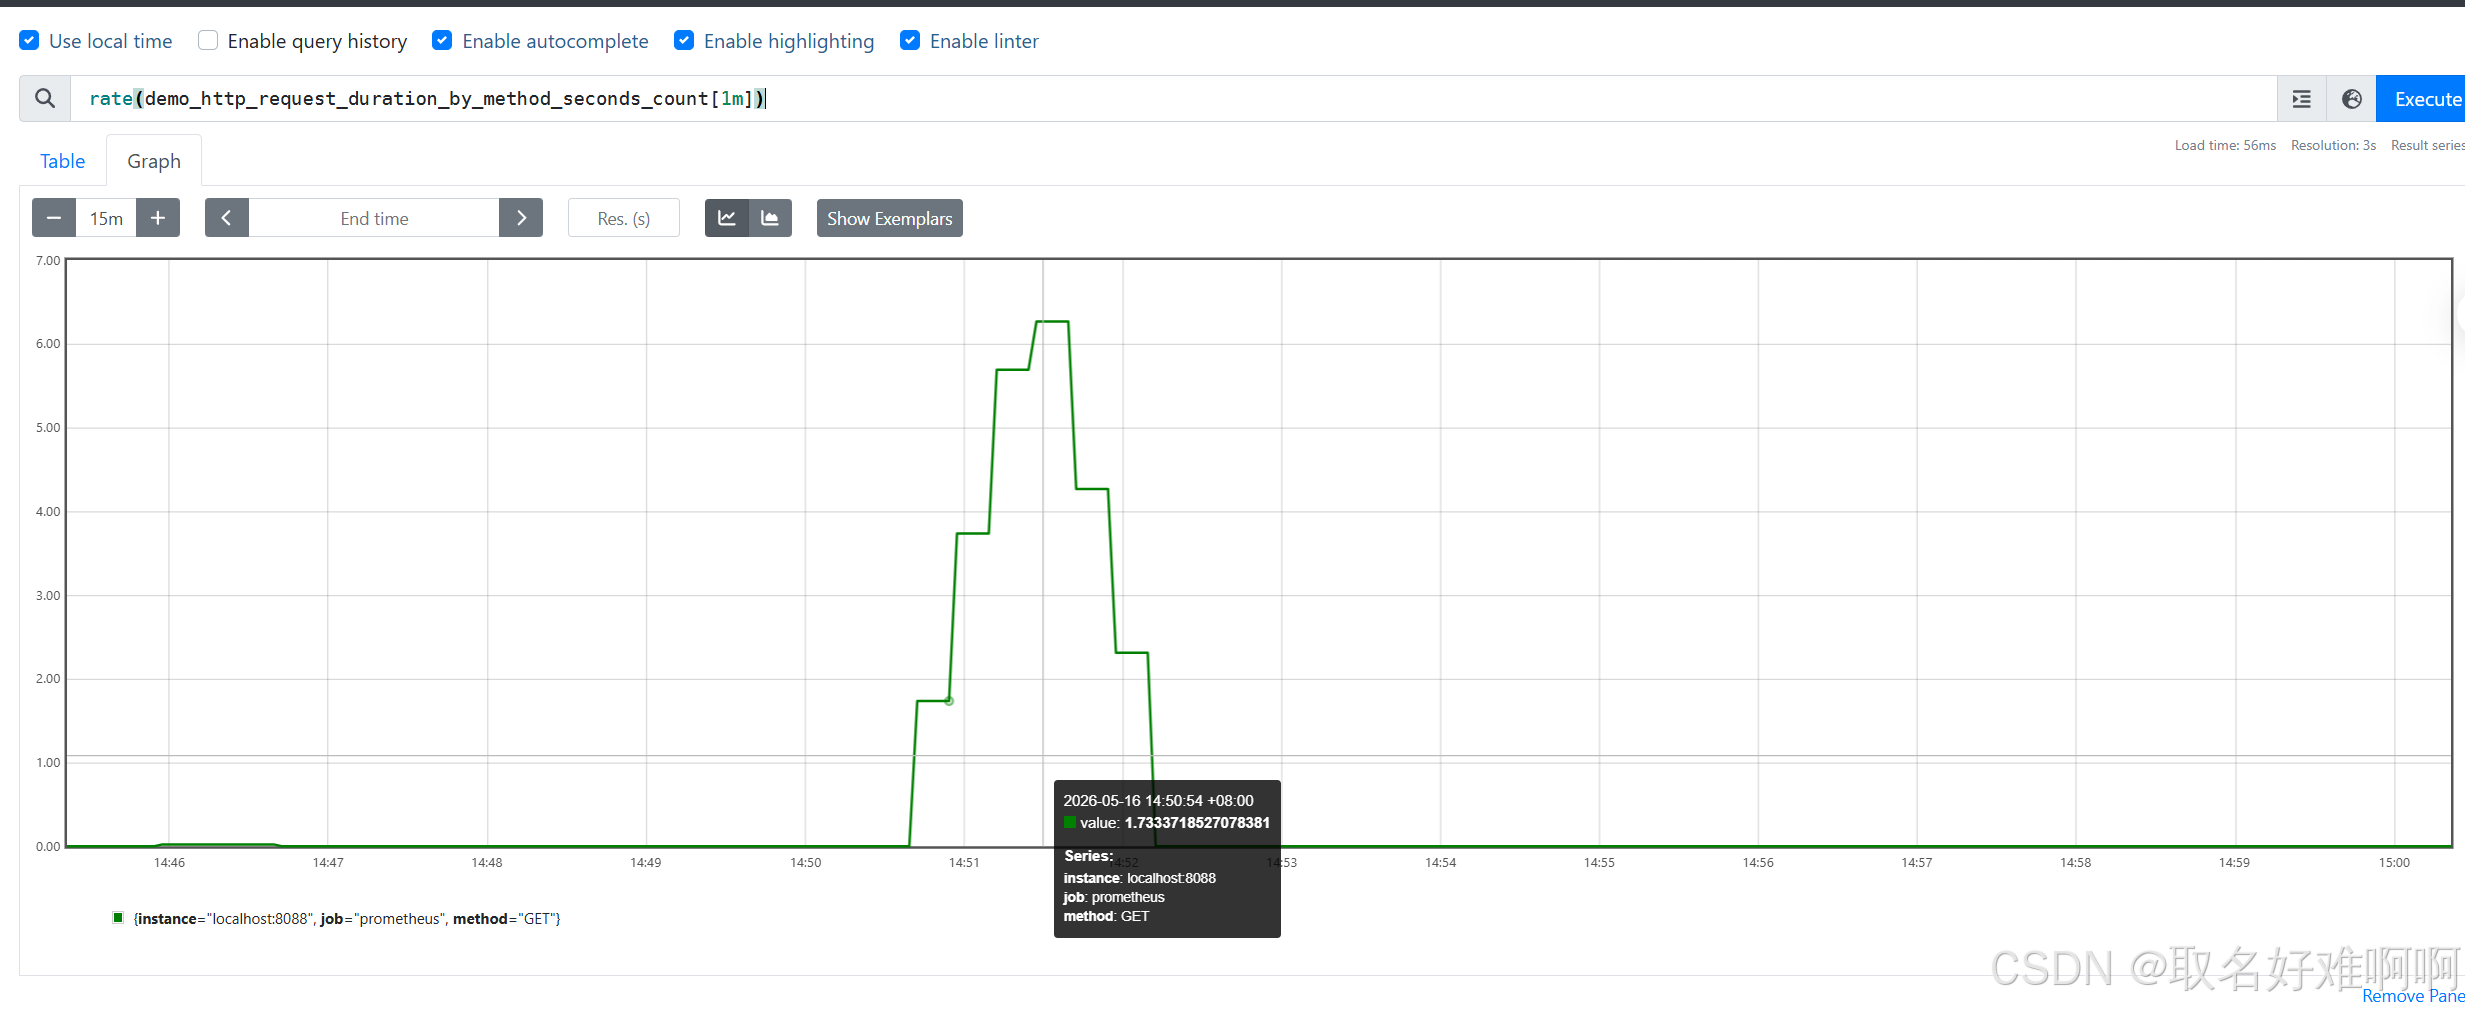
然后就是每个类型的方法的 QPS,查看全部类型的方法总和的 QPS 可以用这个指令:rate(demo_http_request_duration_by_method_seconds_count[1m]),又或者用下面的 sum(rate(demo_http_request_duration_by_method_seconds_count[1m])) by (method) 来查看每个方法的 QPS。
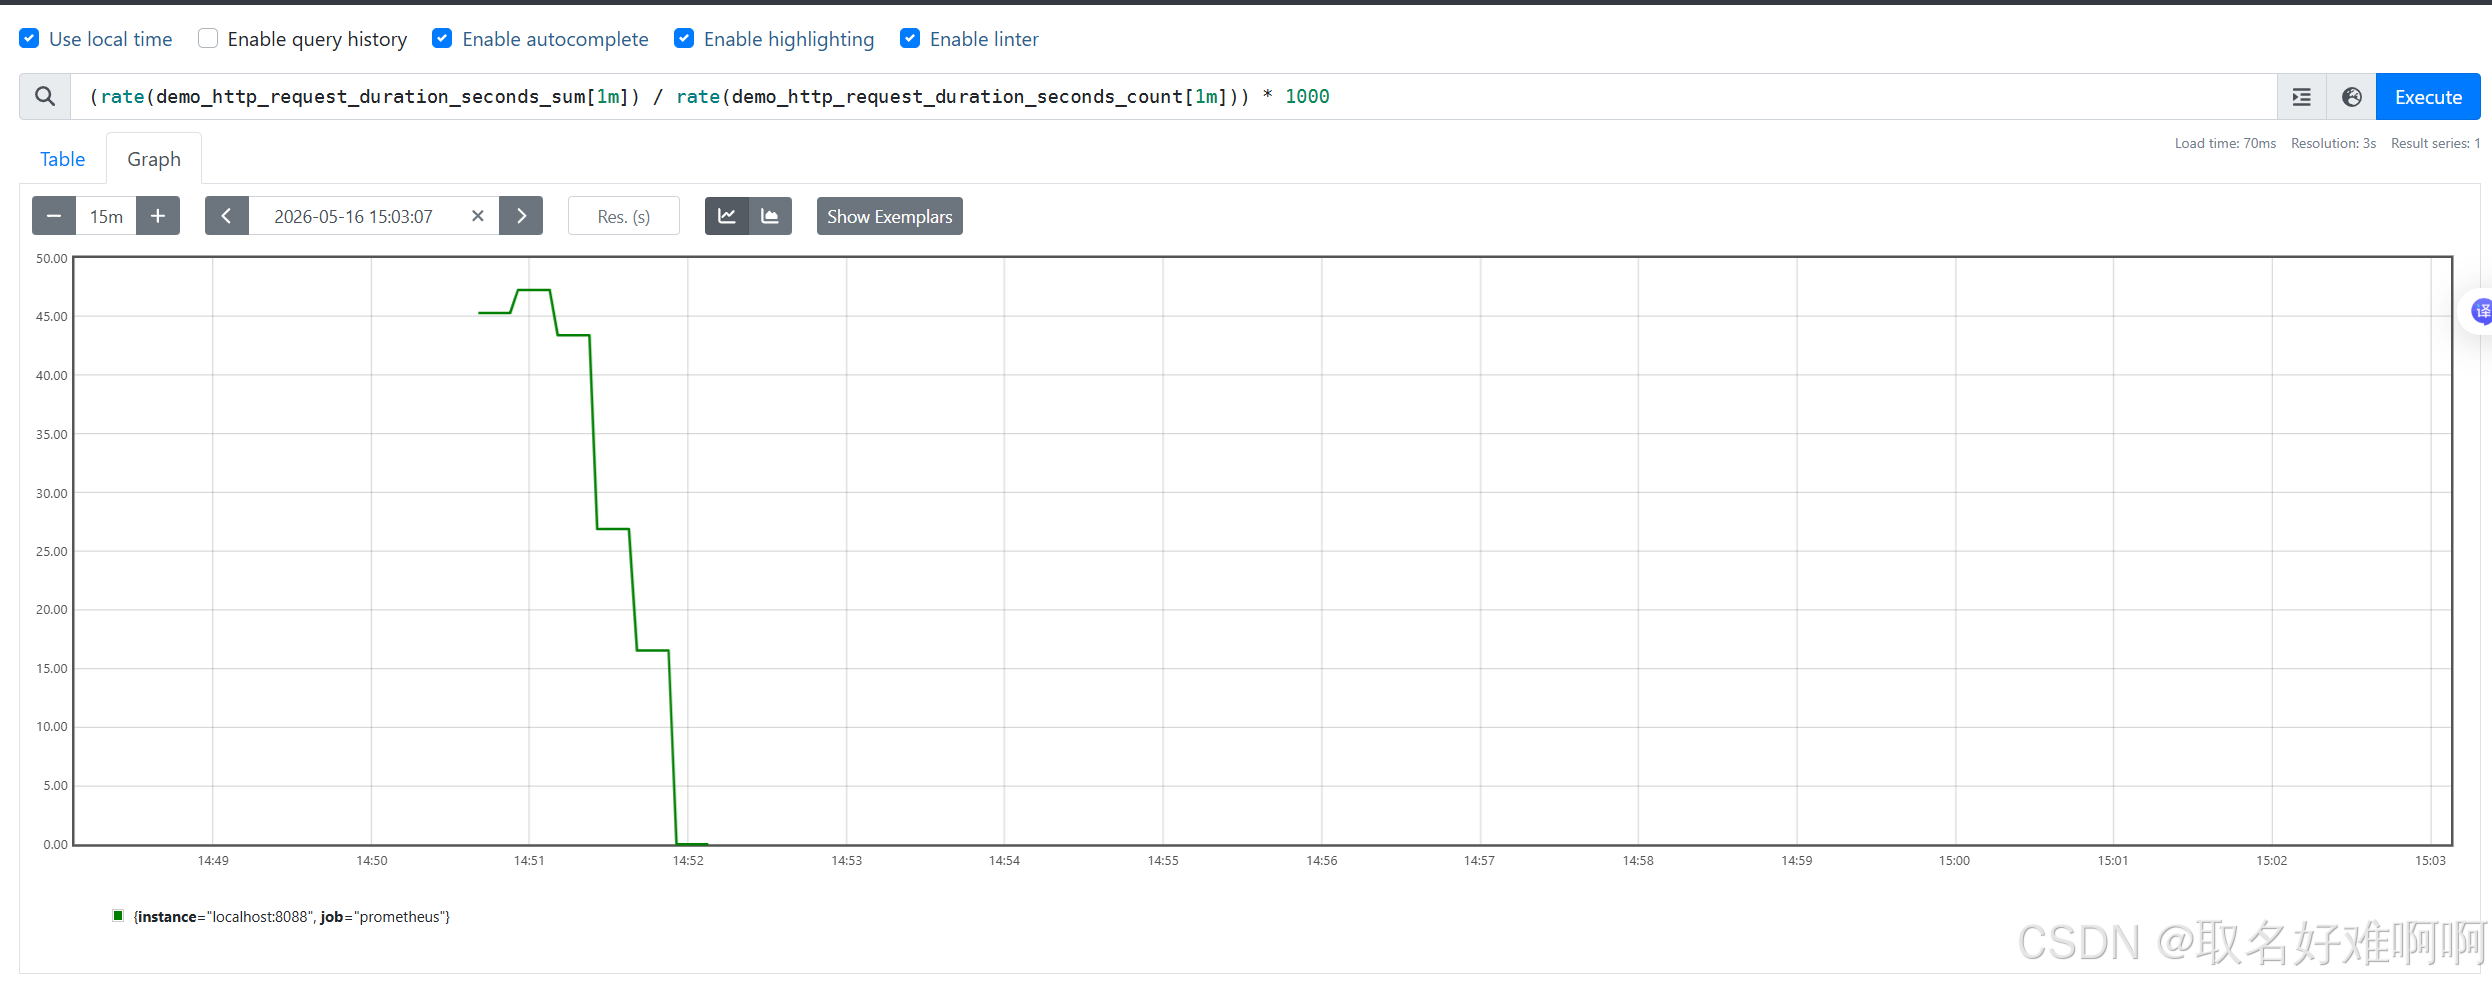
接下来就是查看请求平均耗时,统计时间是 1min 内:(rate(demo_http_request_duration_seconds_sum[1m]) / rate(demo_http_request_duration_seconds_count[1m])) * 1000。
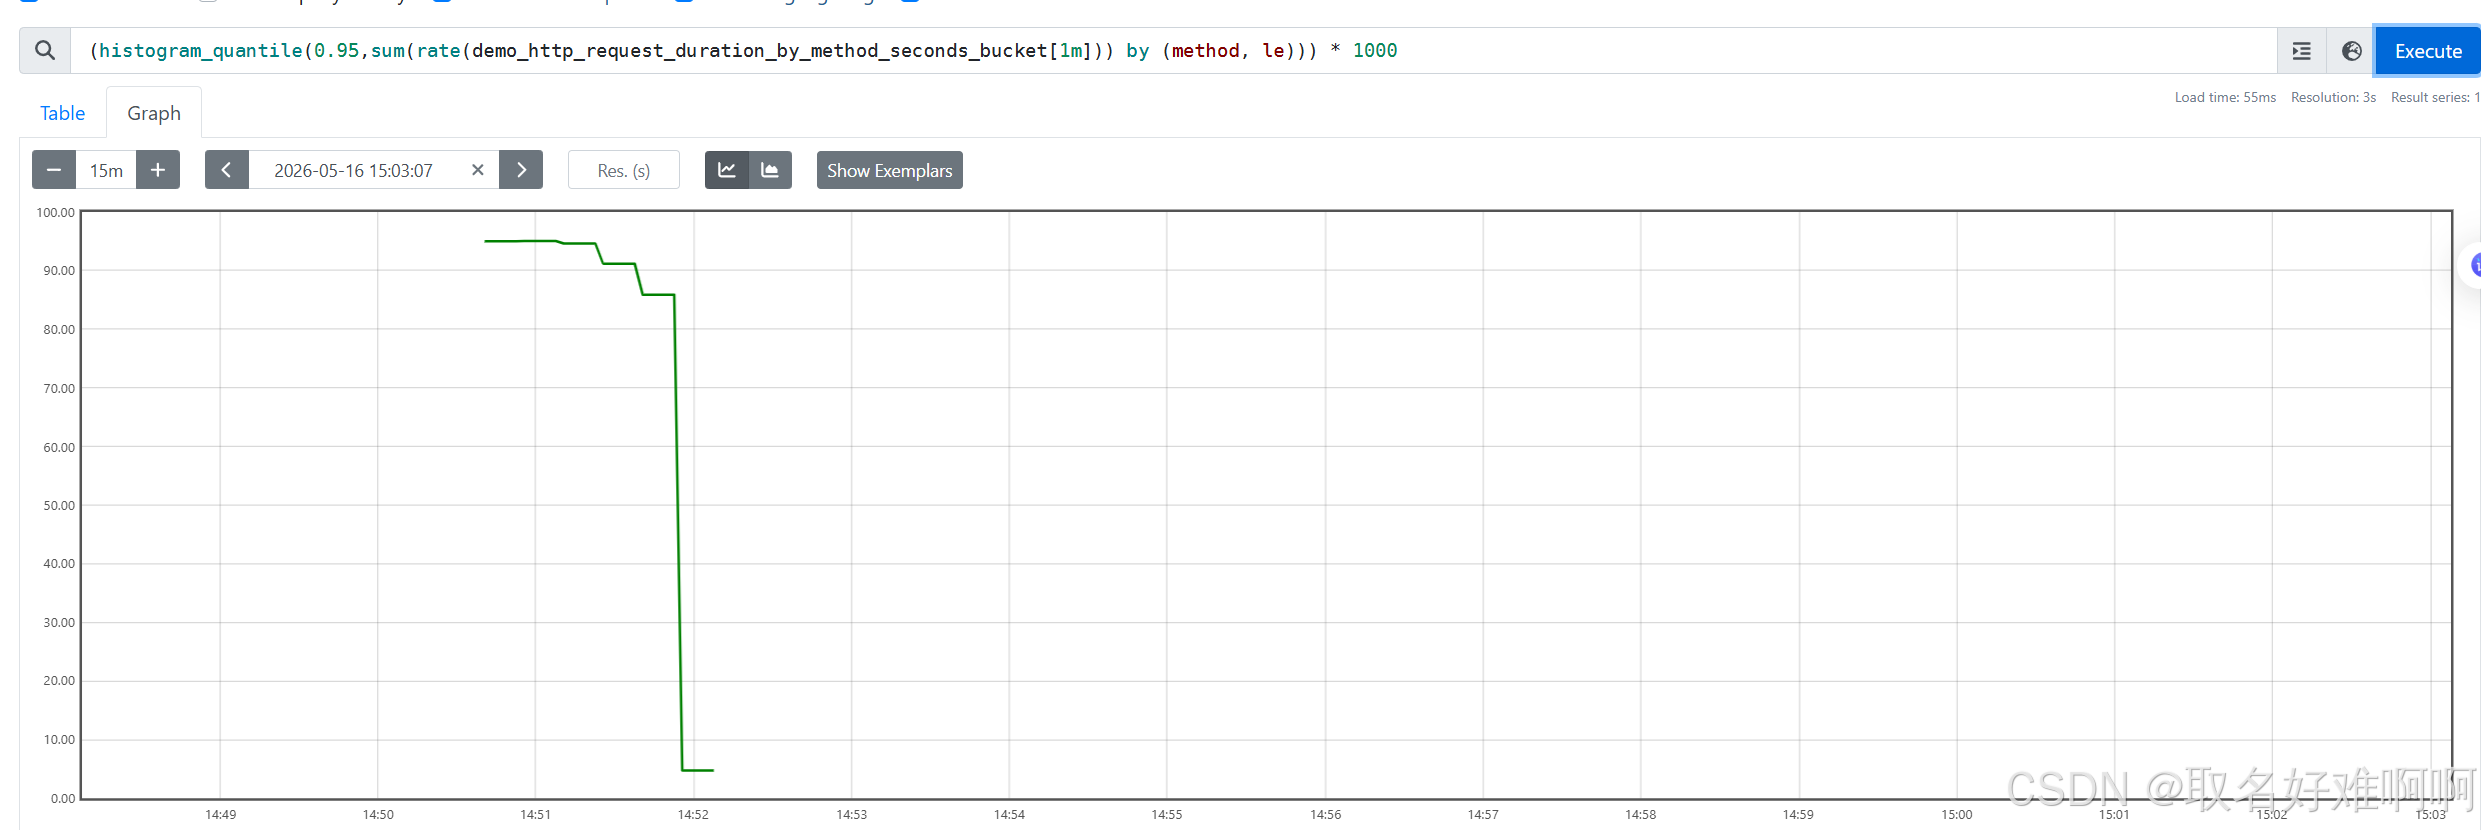
除了平均耗时,生产环境还有一个指标就是 p95 耗时,也就是通过这个指标:(histogram_quantile(0.95,sum(rate(demo_http_request_duration_by_method_seconds_bucket[1m])) by (method, le))) * 1000,这个指标会按照 Get、Post 等方法去分组,分别计算出 1 分钟 内的 p95 平均耗时。
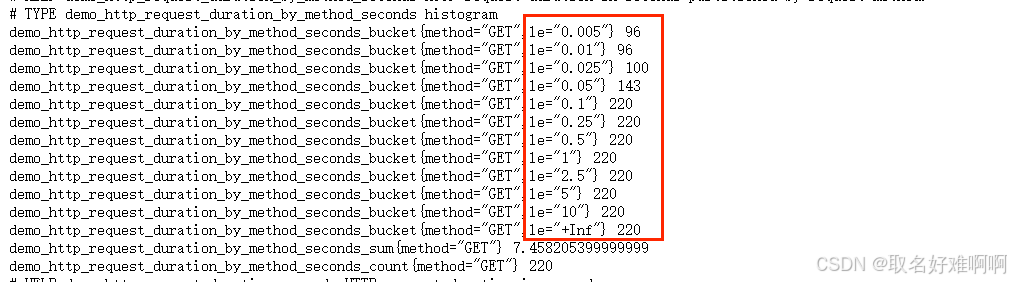
下面顺便再说下,我们会看到指标后面有一个 le,这个指标的意思就是小于 x 秒的请求数有多少,这个是 NewHistogram 才有的。
最后我们再来看最大值,生产环境下需要监控某个方法的最大值,用来确认这个方法的耗时情况,比如说如果发现整个链路有什么地方堵住了,一般来说就先看平均耗时和最大耗时确认是不是某个方法的耗时增加了,再确认这个方法内部哪个地方耗时增加。
由于我们没有单独的最大值耗时指标,所以可以用另外的方法去计算,首先通过 sum(rate(demo_http_request_duration_by_method_seconds_bucket[1m])) by (le, method) 算出 1 分钟内每秒处理的方法数,按照方法和 le 指标分组,曲线是这样的。
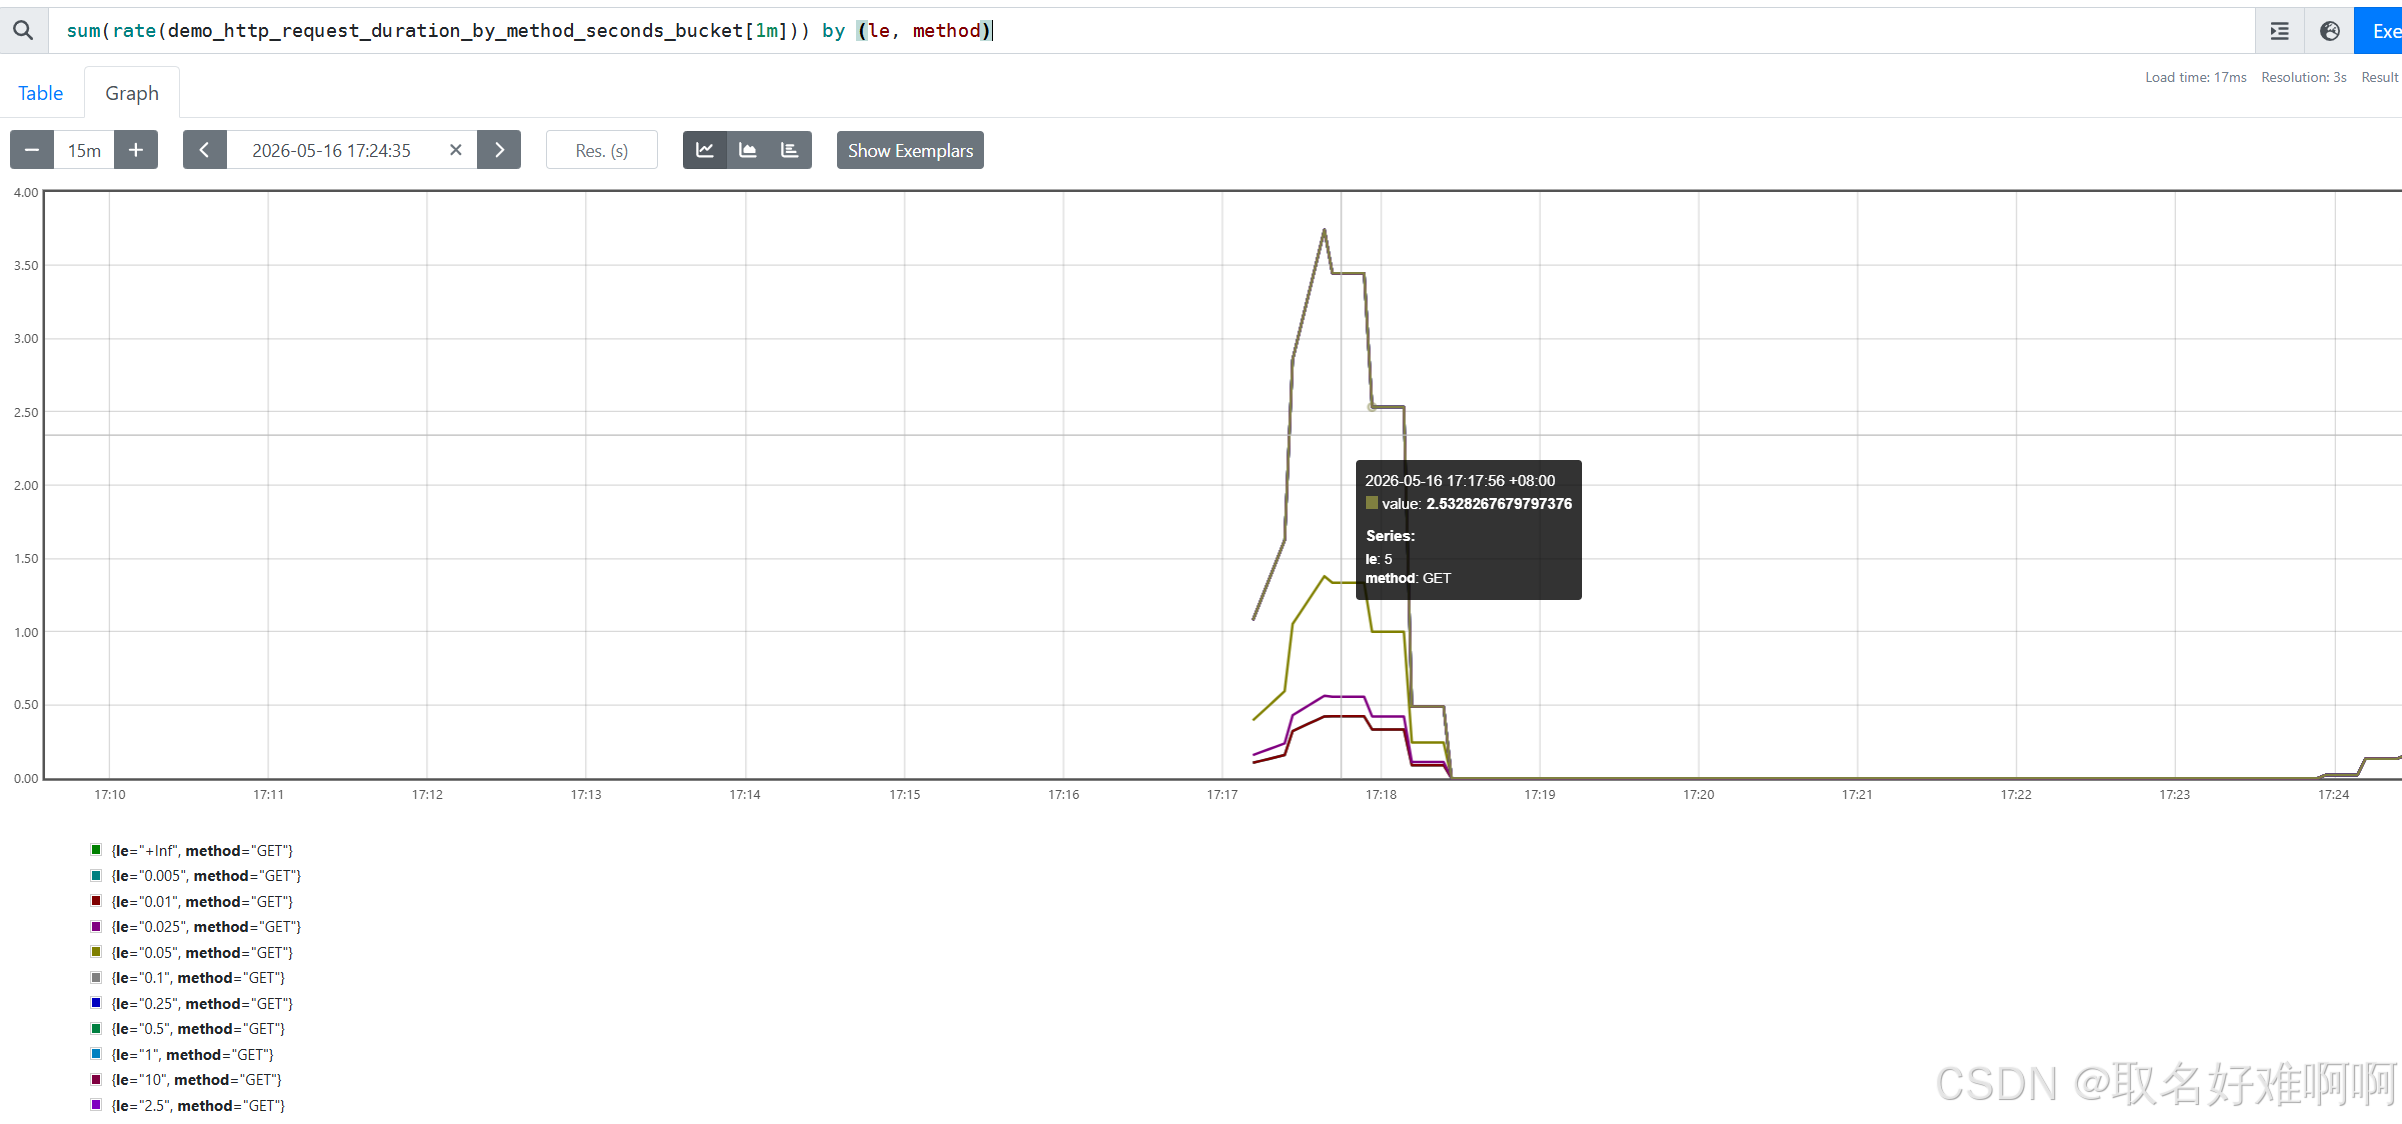
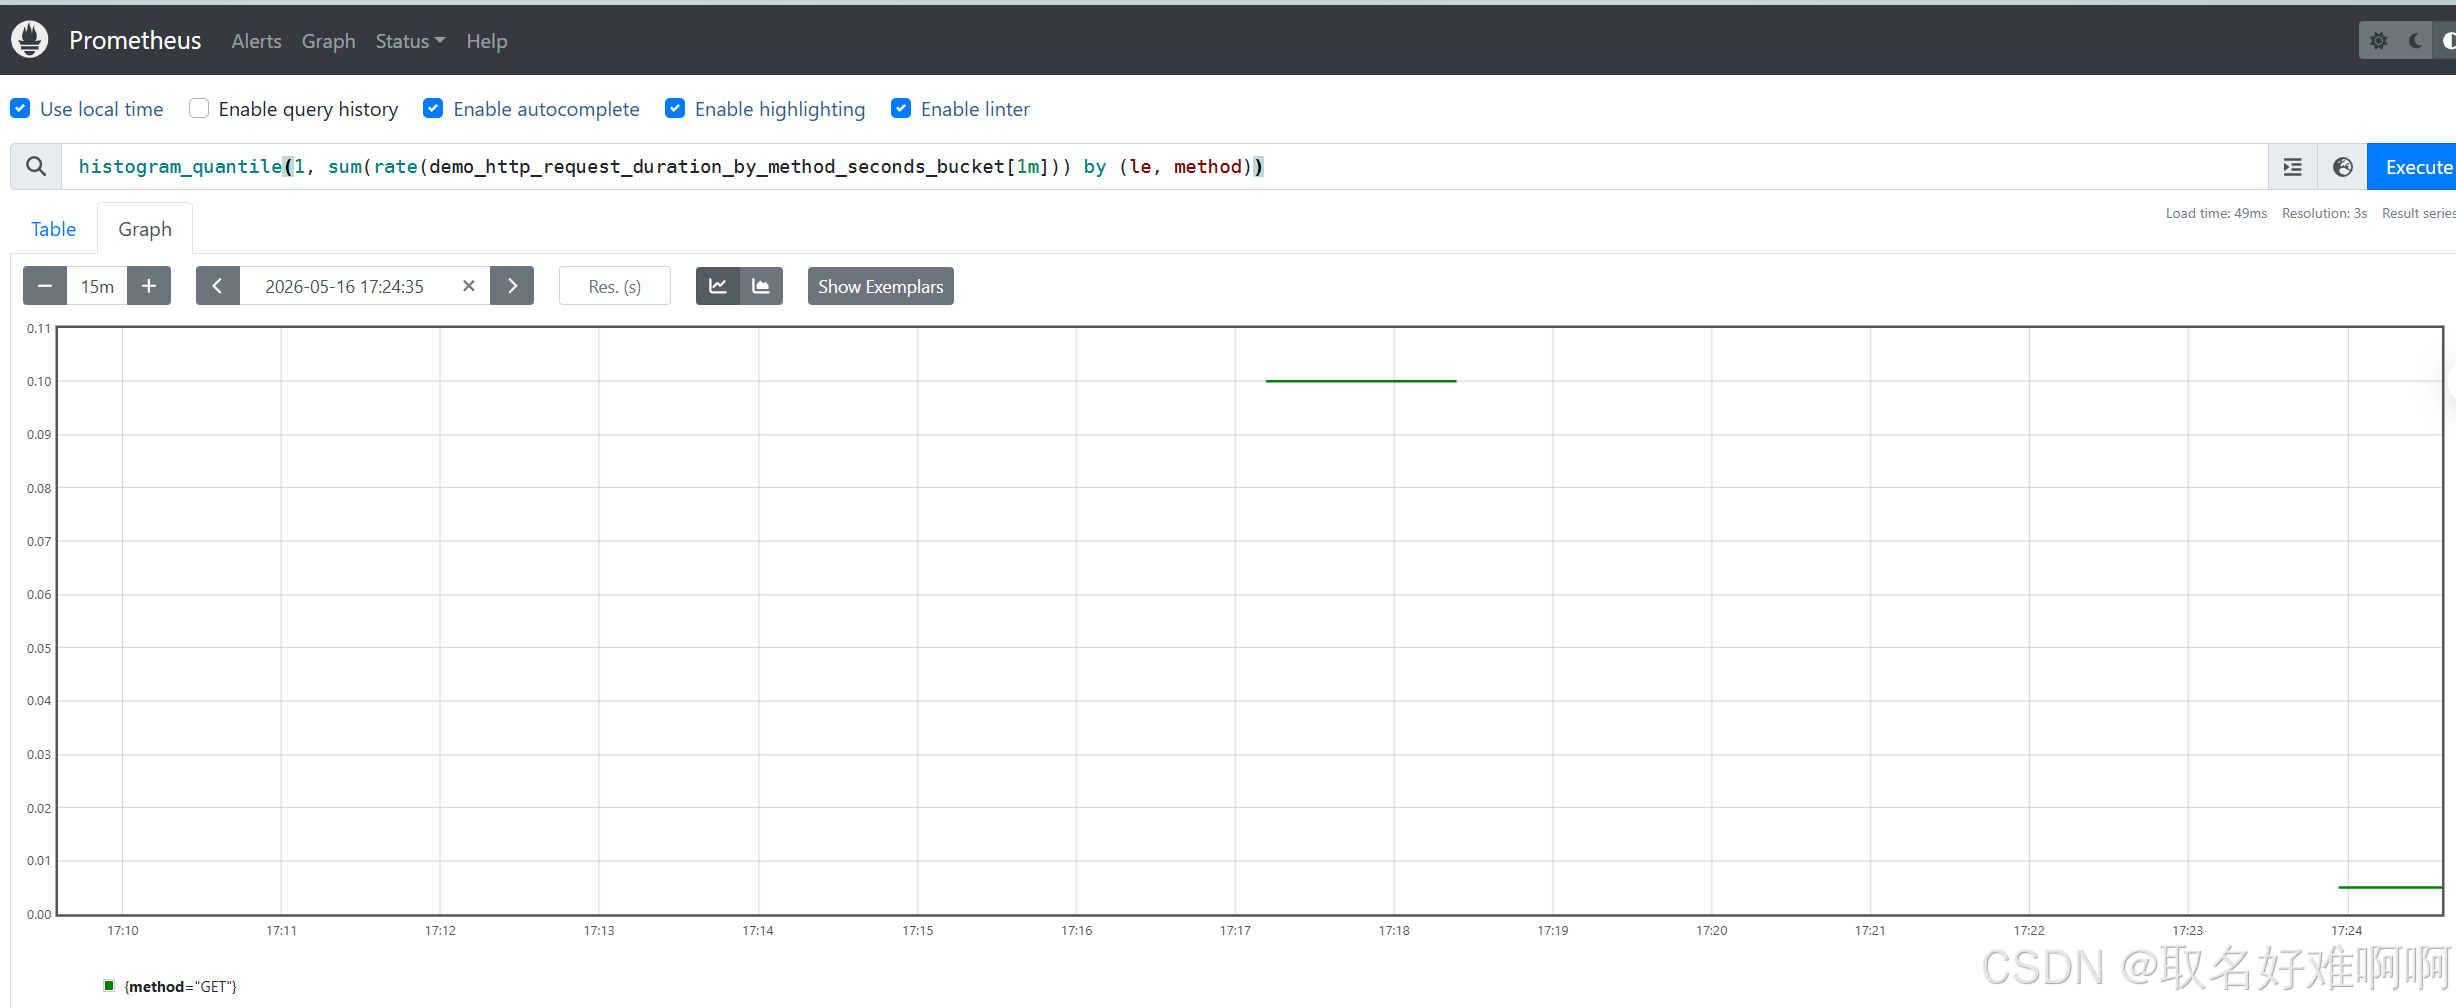
接下来就可以通过 histogram_quantile(1, sum(rate(demo_http_request_duration_by_method_seconds_bucket[5m])) by (le, method)) 计算出上面的全部方法,100% 在多少 s 内完成。
4. 小结
好了,这篇文章就先学习到这里,简单学习了下 prometheus 指标的使用。
如有错误,欢迎指出!!!